
 ?Mathematical formulae have been encoded as MathML and are displayed in this HTML version using MathJax in order to improve their display. Uncheck the box to turn MathJax off. This feature requires Javascript. Click on a formula to zoom.
ABSTRACT
Sediment transport in sewer systems is an important issue of interest to engineering practice. Several models have been developed in the past to predict a threshold velocity or shear stress resulting in self-cleansing flow conditions in a sewer pipe. These models, however, could still be improved. This paper develops three new self-cleansing models using the Evolutionary Polynomial Regression-Multi-Objective Genetic Algorithm (EPR-MOGA) methodology applied to new experimental data collected on a 242 mm diameter acrylic pipe. The three new models are validated and compared to the literature models using both new and previously published data sets. The results obtained demonstrate that three new models have improved prediction accuracy when compared to the literature ones. The key feature of the new models is the inclusion of pipe slope as a significant explanatory factor in estimating the threshold self-cleansing velocity.
Introduction
Sewer sediments can be defined as any settleable particulate material found in stormwater or wastewater that are able to form bed deposits in pipes and hydraulic structures (Ackers et al. Citation2001; Butler and Davies Citation2011). These solids contain a wide range of very small to large particles, i.e. ranging from clays with a mean diameter of 0.0001 to 60 mm gravels (Bertrand-Krajewski, Luc, and Scrivener Citation1993; Ashley et al. Citation2004) and may originate from a variety of sources, such as large fecal and organic matter, atmospheric fall-out and grit from abrasion of road surface, among others (Butler and Davies Citation2011). These particles move in the drainage catchment during storm events and, eventually, enter into the system.
The movement of particles in sewer pipes embodies the processes of erosion, entrainment, transportation, deposition, and compaction (Vanoni Citation2006). Each of these phases depends on the water velocity magnitude. For example, deposition begins when water velocity is low, erosion occurs for higher velocities and transportation for even higher velocities (Alvarez-Hernandez Citation1990). The movement of these particles inside sewers depends on several parameters, such as sediment concentration, mean particle size, the specific gravity of sediments (Ackers et al. Citation2001; Butler, May, and Ackers Citation2003), and flow-hydraulics (Merritt Citation2009).
Sediment transport in sewer systems has traditionally been an important issue in hydraulic engineering. During dry weather seasons, the risk of sedimentation in sewer pipes increases, and a permanent deposit of particles in the sewer may produce changes in the pipes such as the consolidation and cementation of sediments (Ebtehaj and Bonakdari Citation2013). As a related problem in this field, these variations may also alter the hydraulic roughness of the pipes, resulting in an increase of the flow resistance, blockage, flooding, surcharge and a premature overflow operation, among others (Ab Ghani Citation1993; Ashley and Verbanck Citation1996; Mays Citation2001; Bizier Citation2007; Vongvisessomjai, Tingsanchali, and Babel Citation2010). To avoid these problems, minimum velocity and minimum shear stress values have been proposed in different design manuals. As an example, a minimum self-cleansing velocity of 0.6 m s−1 is highly used in the United States (ASCE Citation1970) and France (Minister of Interior Citation1977), and, according to Montes, Kapelan, and Saldarriaga (Citation2019), minimum shear stress values between 1.0 and 4.0 Pa are recommended in several water utilities design manuals in the United States, Europe and South America.
Previous traditional self-cleansing criteria may be unsuitable if there are variations in particle diameter and sediment concentration (Vongvisessomjai, Tingsanchali, and Babel Citation2010). Based on the aforementioned, several experimental investigations have studied the movement of particles to determine a critical velocity to prevent sedimentation and particle deposition in sewers. These studies have developed self-cleansing equations to predict a minimum velocity or shear stress values, such as a function of several combination of parameters, e.g. mean particle diameter, volumetric sediment concentration and hydraulic radius, amongst others parameters. According to Safari, Mohammadi, and Ghani (Citation2018), these self-cleansing criteria studies can be classified into two major groups: bed sediment motion and non-deposition.
Bed sediment motion is a criterion used to calculate the flow conditions required to move deposited material at the bottom of the sewer pipes, i.e. a permanent accumulated material during low-flow rates. In this group, minimum velocity or minimum shear stress values are required to allow the initiation of sediment motion (i.e. incipient motion criterion) or scouring of existing sediment bed (i.e. scouring criterion) (Vongvisessomjai, Tingsanchali, and Babel Citation2010; Safari et al. Citation2017; Safari, Mohammadi, and Ghani Citation2018). Several studies in this group can be found in the literature of incipient motion (Novak and Nalluri Citation1975, Citation1984; Ab Ghani et al. Citation1999) and scouring (Camp Citation1946). A full review of bed sediment motion studies has been prepared by Safari, Mohammadi, and Ghani (Citation2018).
In contrast, in the second group, non-deposition criterion, minimum velocity values are required to prevent a permanent deposit of particles at the bottom of the pipes, i.e. avoiding a permanent accumulated material during low-flow rates. This group can be divided into three sub-groups: non-deposition without deposited bed (i.e. sediment movement without forming a stationary deposited bed), non-deposition with deposited bed (i.e. sediment movement forming a stationary deposited bed but limiting to a certain proportion of the pipe diameter (May et al. Citation1989)) and incipient deposition (i.e. changing from suspended to bedload transport) (Safari et al. Citation2017). Each of these sub-groups considers different sediment dynamics and represents the self-cleansing criteria such as a function of a particular combination of parameters. As an example, in the non-deposition transport without deposited bed, all the material should be transported in flume traction along the bottom of the pipe (Mayerle Citation1988; Butler, May, and Ackers Citation1996). For the non-deposition with deposited bed, a depth of sediment is allowed in the pipe, to increase the transport capacity (El-Zaemey Citation1991; Ab Ghani Citation1993; May Citation1993; Butler, May, and Ackers Citation1996; May et al. Citation1996). Finally, the incipient deposition criterion is defined as the limit where particles in suspension are deposited at the bottom of the pipes and begin to move such bedload (Butler, May, and Ackers Citation1996; Safari, Aksoy, and Mohammadi Citation2015).
In this paper, the non-deposition without deposited bed criterion is studied, which is a conservative criterion useful to the design of self-cleansing sewer pipes, according to Butler, May, and Ackers (Citation2003), Vongvisessomjai, Tingsanchali, and Babel (Citation2010) and Safari, Mohammadi, and Ghani (Citation2018). To apply this criterion, it is necessary to identify several parameters such as size, concentration and density of the sediments (Vongvisessomjai, Tingsanchali, and Babel Citation2010) and the mode of transport of the particles inside the pipes, i.e. bedload or suspended load transport. For bedload transport, several authors have developed equations to calculate a minimum self-cleansing velocity to prevent the deposition of particles at the bottom of the pipes. These equations have been developed using experimental approaches and data handling. Craven (Citation1953) studied the transport of sands in 152 mm diameter pipe, using three quartz sands of 0.25 mm, 0.58 mm and 1.62 mm. Robinson and Graf (Citation1972) conducted experiments using 102 mm and 152 mm diameter pipes, varying the material concentration and the pipe slope. Novak and Nalluri (Citation1975) evaluated the bedload transport in a 152 mm diameter pipe, using sand and gravel with mean diameters between 0.6 mm and 50 mm. Mayerle (Citation1988) conducted a series of experiments for non-deposition without deposited bed, using a circular channel of 152 mm diameter and a rectangular channel variating the particle diameter between 0.5 and 5.22 mm. May et al. (Citation1989) carried out experiments in a 300 mm diameter concrete pipe moving sediments, with a mean particle diameter of 0.72 mm and developed a guideline for the design of self-cleansing sewers. Other authors (El-Zaemey Citation1991; Mayerle, Nalluri, and Novak Citation1991; Perrusquía Citation1991; Ab Ghani Citation1993; Ota Citation1999; Vongvisessomjai, Tingsanchali, and Babel Citation2010) studied the sediment transport of non-cohesive material such as bedload movement using several mean particle sizes, pipe diameters, and material concentrations under uniform flow conditions.
For suspended load transport, Pulliah (Citation1978) carried out 21 experiments, using three uniform particles of 0.027 mm, 0.018 mm and 0.006 mm and varying the volumetric concentration between 170 ppm and 48,542 ppm. Macke (Citation1982) studied the suspended load transport in three pipes of 192 mm, 290 mm and 445 mm diameters, and estimated an equation that provides a good fit for suspended load particles (Ackers et al. Citation2001). Macke’s equation has been proposed for self-cleansing sewer systems design (May et al. Citation1996; Ackers et al. Citation2001). Arora (Citation1983) used three uniform sands of 0.147 mm, 0.106 mm and 0.082 mm, varying the material concentration from 35 ppm to 6,562 ppm. Vongvisessomjai, Tingsanchali, and Babel (Citation2010) studied the suspended load transport, using sands with a particle diameter of 0.2 mm and 0.3 mm and varying the sediment concentration between 113 ppm and 1,374 ppm.
In this context, Ackers, Butler, and May (Citation1996) evaluated the performance of several self-cleansing equations proposed by different authors (Macke Citation1982; Mayerle Citation1988; May et al. Citation1989; Ab Ghani Citation1993; Nalluri, Ghani, and El-Zaemey Citation1994; Nalluri and Ghani Citation1996) and proposed three formulas for design sewers under three typical sediment conditions, i.e. suspended load, bedload and cohesive sediment erosion. In their study, they concluded that for bedload transport, the May et al. (Citation1996) equation should be used to design future self-cleansing sewer systems. Recent studies have collected and used existing experimental data (Mayerle Citation1988; May et al. Citation1989; May Citation1993; Ota Citation1999; Vongvisessomjai, Tingsanchali, and Babel Citation2010) to develop new self-cleansing equations, using Adaptive Neuro-Fuzzy Inference System (Azamathulla, Ghani, and Fei Citation2012), Artificial Neuronal Network (Ebtehaj and Bonakdari Citation2013), non-linear regression and the digital analysis in MINITAB (Ebtehaj, Bonakdari, and Sharifi Citation2014), Group Method of Data Handling (Ebtehaj and Bonakdari Citation2016), Model Tree and Evolutionary Polynomial Regression (Najafzadeh, Laucelli, and Zahiri Citation2017) and Evolutionary Polynomial Regression Multi-Objective Genetic Algorithm (EPR-MOGA) tool (Montes et al. Citation2018), amongst other approaches.
Usually, the self-cleansing models found in the literature have been developed as a function of the modified Froude number (FR*):
This parameter allows the estimation of the minimum self-cleansing velocity (vl), using the gravitational acceleration coefficient (g), the mean particle diameter (d) and the specific gravity of sediments (SG). The differences with traditional self-cleansing models are the number of parameters required to estimate vl, and the exponents and coefficients of each equation. presents a review of typical equations used on sediment transport as bedload, where Cv is the volumetric sediment concentration; y the water level; R the hydraulic radius; λ the channel friction factor; D the pipe diameter; A the cross-section area; vt the velocity of sediment incipient motion, defined as (Novak and Nalluri Citation1975):
Table 1. Traditional self-cleansing models used to evaluate the bedload sediment transport in sewer pipes.
Dgr the dimensionless grain size:
β a cross-section shape factor and υ the water kinematic viscosity.
Each experimental study mentioned above has been carried out under uniform, steady flow conditions, and using a specific hydraulic conditions and particle characteristics. This means that the self-cleansing equations could be overfitting certain datasets resulting in poor performance when applied to other datasets. As an example, Safari, Mohammadi, and Ghani (Citation2018) showed that the Mayerle, Nalluri, and Novak (Citation1991)’s model has acceptable performance with the Mayerle (Citation1988) data, but it gives poor results when this equation is used with other datasets (May Citation1982, Citation1993; Ab Ghani Citation1993; Vongvisessomjai, Tingsanchali, and Babel Citation2010).
The cohesive properties of sewer sediments have not been considered in the above-mentioned studies. Higher velocities are required to move the cohesive material in the deposited bed (Butler, May, and Ackers Citation1996); however, according to Alvarez-Hernandez (Citation1990), who studied the cohesive effects on sewer sediments using Laponite clay gel and granular sand, when the threshold of movement is exceeded, cohesive sediments lose their cohesive properties and move as granular material. Based on the above, May et al. (Citation1996) suggest that the transport equations developed under well-controlled laboratory conditions can be applied to real sewer systems, where in sewer sediments present cohesive properties.
This paper proposes three new models for predicting self-cleansing flow conditions for bedload sediment transport in sewer pipes for uniformly graded and non-cohesive sediments. The aim is to improve the prediction accuracy of existing methods. Evolutionary Polynomial Regression Multi-Objective Genetic Algorithm methodology (EPR-MOGA) (Giustolisi and Savic Citation2009) implemented in the EPR-MOGA-XL tool (Laucelli et al. Citation2012) is used to develop these predictive self-cleansing models.
The rest of the paper is organized as follows. Section 2 presents the experimental setup and data collection. Section 3 contains the model development. In section 4 the model validation is presented. Finally, conclusions are presented in section 5.
Experimental data
The experimental work is carried out on a 242 mm diameter acrylic pipe located at the Universidad de los Andes, Colombia. This pipe has a length of 11.8 m and is supported on a steel truss, which is sustained on five hydraulic jacks. These jacks allow varying the pipe slope (So) between −1.5% and 1.6%. shows the general scheme of the experimental apparatus.
Figure 1. Experimental apparatus used to collect bedload sediment transport data.
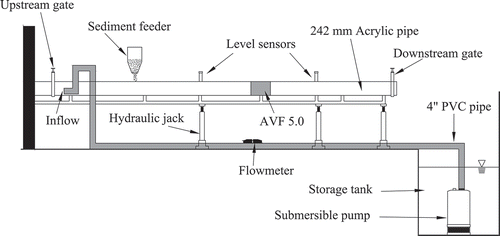
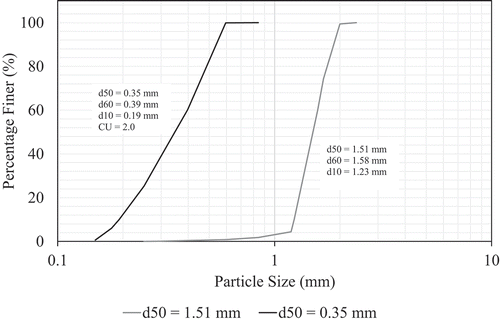
A submersible pump (10 HP, 60 Hz, 440 V) is used to supply water to the apparatus. This pump takes water from a 3.5 m3 tank downstream of the pipe and conducts it through a PVC pipe upstream. An ABB-Electromagnetic flowmeter sensor is installed on this pipe. Flows ranged from 0.82 L s−1 to 25.93 L s−1 were simulated. These flows are obtained using a variable frequency drive, which controls the rotation velocity of the submersible pump motor. Complementarily, the water depth is measured using two ultrasonic level sensors (see ). Water velocity is measured with a Greyline Area-Velocity Flowmeter Doppler Effect sensor, model AVFM 5.0. A sediment feeder controlled by a valve is used to supply the granular material to the system with particles having a mean diameter of 0.35 mm and 1.51 mm. The mean particle diameter is calculated developing a particle size distribution curve, which is useful to check the uniformity of the sediments. Both sands showed a poorly graded material (Uniformity Coefficient of 2.0 and 1.3, respectively), i.e. well uniformly graded material, as shown in . Particle density and specific gravity are determined by pycnometer method-procedure (Bong Citation2013), according to ASTM D854-10 (ASTM D854-14 Citation2014). Sediment supply rate is estimated weighting the amount of material supplied by the sediment feeder, during the time of the experiment (Ota Citation1999).
Figure 2. Grading curve of material used on experimental setup.
The sediment transport as bedload in the acrylic pipe is evaluated under steady uniform flow conditions. The step-by-step methodology employed to obtain steady uniform flow conditions is as follows. Firstly, the variable frequency drive is programmed for a specific frequency of operation, and the water flow is measured. Secondly, the water level is monitored, using the two ultrasonic sensors. According to Ab Ghani (Citation1993), when the water level difference is less than ± 2 mm, the steady uniform flow conditions are obtained. This criterion is evaluated experimentally, and the differences obtained between the energy gradient line, the water surface slope and the pipe slope are less than 2.0%. Thirdly, if the previous criterion is unsatisfied, the flow in the pipe is controlled using the downstream gate, which is opened or closed until the steady uniform flow conditions are obtained. Fourthly, sediments are supplied to the system at an increasing rate until deposition occurs. This condition is achieved by varying the opening area of the sediment feeder valve and weighing the amount of material during the experiment. Fifthly, the supplied rate is reduced manually, using the sediment feeder, until the non-deposition condition occurs. Finally, this condition is kept for at least 15 min and the water flow level, the water flow rate, the water velocity and the rate of sediment are collected. The above experimental procedure is repeated for different water flow rates and pipe slopes.
A set of 44 experiments were conducted using the above procedure. The data collected this way were used to derive new self-cleansing models (33 experiments) and the remaining data (11 experiments) were used to validate these models. Experimental data collected for bedload transport are shown in .
Table 2. Bedload experiments in the 242 mm acrylic pipe.
In addition to the previous data collected experimentally, four datasets found in the literature have been used to validate the new models proposed in this study. presents the characteristics of the data collected. These datasets have a typical range of variation of conditions commonly found in real sewer systems, according to Ackers et al. (Citation2001).
Table 3. Dataset used to evaluate the performance of self-cleansing models.
EPR-MOGA-based model development
Evolutionary Polynomial Regression (EPR) is a hybrid regression model (Giustolisi and Savic Citation2004, Citation2006) which combines Genetic Algorithm, for searching exponents in a symbolic formula, with a regression approach, for parameter estimation on final models (Giustolisi and Savic Citation2006, Citation2009). In its original version, the EPR strategy uses a single-objective genetic algorithm (SOGA) for exploring the space of solution (Giustolisi and Savic Citation2009). Later on (Giustolisi and Savic Citation2009) the use of multi-objective optimization strategy based on genetic algorithm (MOGA) allowed to improve the exploration of the space of symbolic formulas, providing also few alternative models which could be suited for different modelling purposes.
The EPR-MOGA strategy allows pseudo-polynomial expressions such as (Giustolisi and Savic Citation2009):
where is the vector of model predictions or estimated dependent variable (El-Baroudy et al. Citation2010); ao the optional bias term; aj the parameters which are estimated through numerical regression; X1 … Xk the matrix of the k candidate explanatory variables; ES the matrix of candidate exponents; f the inner function selected by the user and m is the maximum number of additive terms. Full details can be seen in (Giustolisi and Savic Citation2006).
Multi-objective genetic algorithm in EPR-MOGA strategy explores the space of solutions pursuing two or three objectives simultaneously (Giustolisi and Savic Citation2009): maximization of the model accuracy, i.e. minimization of the Sum of Squared Errors (as shown in Equation (16)), and minimization of complexity of final formula in Equation (12), i.e. the number of pseudo-polynomial additional terms j, the number of inputs Xk or both. Using this multi-objective strategy, it is possible to obtain parsimonious model structures with high fitting levels.
Recently, Laucelli et al. (Citation2012) implemented the EPR-MOGA strategy as an add-in tool in MS-Excel called EPR-MOGA-XL, which was used in this work.
To develop new self-cleansing models for sewers three optimization strategies (OS) are used here. Each OS considers a different potential group of input parameters to describe the modified Froude number, as shown in .
Table 4. Optimization strategies adopted to derive new self-cleansing models.
Each OS is implemented using the EPR-MOGA-XL and taking into account several considerations. In this paper, the expression structure considered is the Case 2 (as shown in Equation (12)), reported by Giustolisi and Savic (Citation2006) with no function f; the range of exponent values with a step of 0.02 ES = [−0.60, −0.58, −0.56, …, 0.16] and a maximum number of polynomial terms m equals to one. In addition, the regression method considered is Least Squares (Giustolisi and Savic Citation2006). Finally, the optimization strategy considered aims to minimizing the number of inputs in the final formula (i.e. Xi) in the pseudo-polynomial structure and the Sum of Squared Error. Such settings allowed to have a large search space, based on 39 candidate exponents ES, while seeking for a compact monomial formulas readily interpretable from hydraulic standpoint.
The models obtained by EPR-MOGA-XL are shown in , which presents the best fitting to training data shown in . As shown in , Models (13), (14) and (15) have a structure that considers the parameters that most affect the prediction for sediment transport (Nalluri, Ghani, and El-Zaemey Citation1994; May et al. Citation1996; Ebtehaj and Bonakdari Citation2016), such as the volumetric sediment concentration, mean particle diameter, specific gravity of particles and hydraulics radius. Nevertheless, models (14) and (15) include the pipe slope, which increases the model accuracy for training and testing dataset, as shown in .
Table 5. Models obtained using EPR for different optimization strategies.
Table 6. Performance of models returned by EPR-MOGA-XL and literature self-cleansing models/equations. Bolded values show best performing models.
In addition, the symbolic expressions returned by EPR-MOGA enable direct comparison with existing models. In more detail, selected explaining variables and relevant exponents allow to validate each single model based on the consistency with technical insight on the phenomenon, thus promoting the general validity of selected models outside the training data set.
Evaluation of proposed models
Performance measures
To validate the models obtained by EPR-MOGA-XL, the testing datasets shown in are used. The models proposed are evaluated using four performance measures (index): Sum of Squared Errors (SSE), Coefficient of Determination (CoD) and Akaike Information Criterion (AIC). These expressions are defined as follows:
where Y and Y* are the calculated and observed data, respectively, n the number of data, Y*m the mean of observed data and kl the number of parameters included in the model. The Sum of Squared Errors measures how well the model predictions (Froude numbers) are close to the corresponding observations. Smaller values of SSE are better with zero value denoting a perfect match between predictions and observations. The Coefficient of Determination (CoD) estimates the fraction (i.e. percentage) of model prediction variation that can be explained by all model input variables together. The CoD has a value between 0 and 1 with 1 denoting a perfect match between model predictions and observations. Finally, the Akaike Information Criterion (AIC) is a measure of trade-off between the goodness of fit (i.e. accuracy) and parsimony (i.e. simplicity) of the model. Generally, the model with the lowest AIC value is selected as the optimal model. These three performance measures were selected here because they are, in addition to being well known and frequently used, complementary to each other, i.e. they evaluate different aspects of model fitting to observed data.
Self-cleansing model performance comparison
The performance of EPR models and traditional equations is presented in . As it can be seen from this table, some traditional models have low correlations with experimental data. For example, Craven (Citation1953) model (Equation (4)) has a CoD value varying between 0.00 and 0.43, which shows poor performance of this model applied to all experimental datasets. Another example is Ab Ghani (Citation1993) model (Equation (6)), which presents better results, CoD = [0.56, 0.95], and high fitting for the datasets.
Based on the aforementioned, Ab Ghani (Citation1993) model considers five parameters to predict the modified Froude number: Volumetric sediment concentration, mean particle diameter, hydraulic radius, dimensionless grain size, and channel friction factor. In contrast, Craven (Citation1953) considers the volumetric sediment concentration, mean particle diameter, and pipe diameter, to predict the modified Froude number. These differences in the combination of input parameters used can increase or decrease the model performance. As several previous studies show (Mayerle Citation1988; Ab Ghani Citation1993; Nalluri, Ghani, and El-Zaemey Citation1994; May et al. Citation1996; Ebtehaj and Bonakdari Citation2016), the most important parameters in the estimation of self-cleansing conditions in sewers can be classified in dimensionless groups (Ebtehaj and Bonakdari Citation2016) related to motion (FR*), transport (Cv), sediment characteristics (Dgr, d, SG), transport mode (d/R) and flow resistance (λ). For example, models such as FR* = aCvα(d/R)ϴ (Mayerle Citation1988; Vongvisessomjai, Tingsanchali, and Babel Citation2010; Ebtehaj, Bonakdari, and Sharifi Citation2014; Najafzadeh, Laucelli, and Zahiri Citation2017 and EPR-MOGA Equation (13)) tend to represent better the experimental data (CoD = [0.00, 0.99]) for almost all datasets; differences are represented by the values of the exponents α and ϴ. Other models, that are in the form FR* = aCvα(d/R)ϴDgrγβω (Ab Ghani Citation1993, with ω = 0; Safari et al. Citation2017), also show good results (CoD = [0.56, 0.95]) for all the experimental datasets. Finally, EPR-MOGA models in the form FR* = aCvα(d/R)ϴDgrγSoµ (Equation (14) with γ = 0 and Equation (15)) show the highest fitting for all the experimental datasets (CoD = [0.84, 0.98]).
As the results in show, the EPR-MOGA models, especially Equations (14 and 15), have high correlations for all experimental data. Graphically, these results can be seen in , which shows the fitting of the self-cleansing equations for several experimental data. The traditional Craven (Citation1953) equation underestimates the calculation of the modified Froude number for all experimental datasets. This means that if this formula is used for the design of self-cleansing sewer systems, the minimum slope required will be flatter than that actually required, increasing the risk to deposit of particles at the bottom of the pipes.
Figure 3. Fitting of traditional equations and EPR-MOGA models, using (a) Present study training data; (b) Present study testing data; (c) Mayerle (Citation1988) data; (d) Ab Ghani (Citation1993) data; (e) Ota (Citation1999) data and (f) Vongvisessomjai, Tingsanchali, and Babel (Citation2010) data.
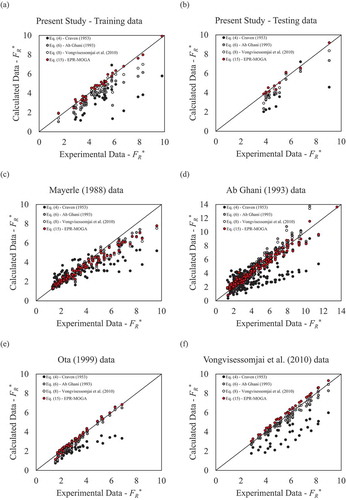
The modified Froude number calculated by model (15) correctly represents the measured experimental data. However, for Mayerle (Citation1988) dataset when FR* > 4.0, all the self-cleansing equations, including the EPR-MOGA models, tend to sub-estimate the real value. The other experimental datasets can be correctly represented by EPR-MOGA models. This increase in the model accuracy can be explained by the inclusion of the pipe slope parameter in the self-cleansing models. The accuracy increases in all cases, which means that this parameter can be significant in the prediction of self-cleansing capacity in sewer pipes.
Conclusions
The study proposes new self-cleansing models based on data collected from a set of 44 lab experiments conducted on a 242 mm diameter acrylic pipe with varying steady-state flow conditions and sediment characteristics. The data collected this way were processed using the EPR-MOGA-XL modelling technique to derive three new self-cleansing models based on respective optimization strategies. The new self-cleansing models were validated with collected experimental data but also the corresponding data found in the literature. A comparison to eight self-cleansing equations published previously in the literature was also performed in the process. This was done using four different evaluation metrics. Based on the results obtained the following conclusions are made:
EPR-MOGA-based models showed overall better performance than traditional self-cleansing models. This is attributed to the proposed self-cleansing models include the pipe slope parameter to calculate the modified Froude number. By including this parameter in the estimation of self-cleansing in sewer pipes, a better fitting is observed in all the experimental datasets considered.
In addition, the EPR-based new models tend to represent, in a better way, the experimental data for the whole range of variation for the existing experimental data (e.g. d = [0.20–8.74 mm], vl = [0.24–1.25 m s−1], Cv = [0.27–1,450 ppm], and So = [0.04–2.56%], amongst other parameter variation). The reason for this is that EPR-MOGA approach trades-off model prediction accuracy with model generalization capability ensuring overfitting is avoided in the model development process.
Based on the above, new self-cleansing models can be useful for the design of new sewer systems by estimating the threshold self-cleansing flow conditions.
It is recommended to continue the experimental investigation of sediment transport, especially in large sewer pipes and considering different flow regimes (e.g. non-steady flow conditions) as self-cleansing conditions are less well understood under these conditions. In addition, different sediment characteristics, hydraulic conditions and non-circular cross sections should be evaluated in the future, including experiments for cohesive material.
Disclosure Statement
No potential conflict of interest was reported by the author(s).
References
- Ab Ghani, A. 1993. “Sediment Transport in Sewers.” PhD diss., University of Newcastle Upon Tyne. Newcastle Upon Tyne, UK.
- Ab Ghani, A., A. Salem, R. Abdullah, A. Yahaya, and N. Zakaria. 1999. “Incipient Motion of Sediment Particles over Deposited Loose Beds in a Rectangular Channels.” In Proceedings of the 8th International Conference on Urban Storm Drainage, 157–163. Sydney, Australia.
- Ackers, J., D. Butler, D. Leggett, and R. May. 2001. “Designing Sewers to Control Sediment Problems.” In Urban Drainage Modeling: Proceedings of the Specialty Symposium Held in Conjunction with the World Water and Environmental Resources Congress, edited by Robert W. Brashear and Cedo Maksimovic, 818–823. Orlando, FL. doi:10.1061/9780784405833
- Ackers, J., D. Butler, and R. May. 1996. “Design of Sewers to Control Sediment Problems.” Report 141. London, UK: Construction Industry Research and Information Association (CIRIA).
- Alvarez-Hernandez, E. 1990. “The Influence of Cohesion on Sediment Movement in Channels of Circular Cross-Section.” PhD diss., University of Newcastle Upon Tyne. Newcastle Upon Tyne, UK.
- American Society of Civil Engineers [ASCE]. 1970. “Design and Construction of Sanitary and Storm Sewers.” Report No. 37. New York, USA: American Society of Civil Engineers Manuals and Reports on Engineering Practices.
- Arora, A. 1983. “Velocity Distribution and Sediment Transport in Rigid-Bed Open Channels.” PhD diss., University of Roorkee. Roorkee, India.
- Ashley, R., J. L. Bertrand-Krajewski, T. Hvitved-Jacobsen, and M. Verbanck. 2004. “Solids in Sewers.” Scientific and Technical Report Series. London: IWA Publishing.
- Ashley, R., and M. Verbanck. 1996. “Mechanics of Sewer Sediment Erosion and Transport.” Journal of Hydraulic Research 34 (6): 753–770. doi:10.1080/00221689609498448.
- ASTM D854-14. 2014. Standard Test Methods for Specific Gravity of Soil Solids by Water Pycnometer. West Conshohocken, PA: ASTM International.
- Azamathulla, H., A. A. Ghani, and S. Fei. 2012. “ANFIS-Based Approach for Predicting Sediment Transport in Clean Sewer.” Applied Soft Computing Journal 12 (3): 1227–1230. doi:10.1016/j.asoc.2011.12.003.
- Bertrand-Krajewski, J., P. B. Luc, and O. Scrivener. 1993. “Sewer Sediment Production and Transport Modelling: A Literature Review.” Journal of Hydraulic Research 31 (4): 435–460. doi:10.1080/00221689309498869.
- Bizier, P., Ed. 2007. Gravity Sanitary Sewer Design and Construction. 2nd ed. Reston, VA: American Society of Civil Engineers.
- Bong, C. 2013. “Self-Cleansing Urban Drain Using Sediment Flushing Gate Based on Incipient Motion.” PhD diss., Universiti Sains Malaysia. Penang, Malaysia.
- Butler, D., and J. Davies. 2011. Urban Drainage. 3rd ed. London, UK: Spon Press.
- Butler, D., R. May, and J. Ackers. 1996. “Sediment Transport in Sewers Part 1: Background.” In Proceedings of the Institution of Civil Engineers - Water, Maritime and Energy 118 (2): 103–112. doi:10.1680/iwtme.1996.28431.
- Butler, D., R. May, and J. Ackers. 2003. “Self-Cleansing Sewer Design Based on Sediment Transport Principles.” Journal of Hydraulic Engineering 129 (4): 276–282. doi:10.1061/(ASCE)0733-9429(2003)129:4(276).
- Camp, T. 1946. “Design of Sewers to Facilitate Flow.” Sewage Works Journal 18 (1): 3–16.
- Craven, J. 1953. “The Transportation of Sand in Pipes I. Full-Pipe Flow.” In Proceedings of the Fifth Hydraulics Conference, 67–76. Iowa City, IA.
- Ebtehaj, I., and H. Bonakdari. 2013. “Evaluation of Sediment Transport in Sewer Using Artificial Neural Network.” Engineering Applications of Computational Fluid Mechanics 7 (3): 382–392. doi:10.1080/19942060.2013.11015479.
- Ebtehaj, I., and H. Bonakdari. 2016. “Bed Load Sediment Transport in Sewers at Limit of Deposition.” Scientia Iranica 23 (3): 907–917. doi:10.24200/sci.2016.2169.
- Ebtehaj, I., H. Bonakdari, and A. Sharifi. 2014. “Design Criteria for Sediment Transport in Sewers Based on Self-Cleansing Concept.” Journal of Zhejiang University SCIENCE A 15 (11): 914–924. doi:10.1631/jzus.A1300135.
- El-Baroudy, I., A. Elshorbagy, S. Carey, O. Giustolisi, and D. Savic. 2010. “Comparison of Three Data-Driven Techniques in Modelling the Evapotranspiration Process.” Journal of Hydroinformatics 12 (4): 365–379. doi:10.2166/hydro.2010.029.
- El-Zaemey, A. 1991. “Sediment Transport over Deposited Beds in Sewers.” PhD diss., University of Newcastle Upon Tyne. Newcastle Upon Tyne, UK.
- Giustolisi, O., and D. Savic. 2004. “A Novel Genetic Programming Strategy: Evolutionary Polynomial Regression.” In Proceedings of the 6th International Conference on Hydroinformatics, 787–794. Singapore.
- Giustolisi, O., and D. Savic. 2006. “A Symbolic Data-Driven Technique Based on Evolutionary Polynomial Regression.” Journal of Hydroinformatics 8 (3): 207–222. doi:10.2166/hydro.2006.020b.
- Giustolisi, O., and D. Savic. 2009. “Advances in Data-Driven Analyses and Modelling Using EPR-MOGA.” Journal of Hydroinformatics 11 (3–4): 225–236. doi:10.2166/hydro.2009.017.
- Laucelli, D., L. Berardi, A. Doglioni, and O. Giustolisi. 2012. “EPR-MOGA-XL: An Excel Based Paradigm to Enhance Transfer of Research Achievements on Data-Driven Modeling.” In Proceedings of 10th International Conference on Hydroinformatics HIC, 14–18. Hamburg, Germany.
- Macke, E. 1982. “About Sediment at Low Concentrations in Partly Filled Pipes.” PhD diss., Technical University of Braunschweig, Germany. Braunschweig, Germany.
- May, R. 1982. “Sediment Transport in Sewers.” Report IT 222. Wallingford, UK: Hydraulics Research Wallingford.
- May, R. 1993. “Sediment Transport in Pipes and Sewers with Deposited Beds.” Report SR 320. Wallingford, UK: Hydraulics Research Wallingford.
- May, R., J. Ackers, D. Butler, and S. John. 1996. “Development of Design Methodology for Self-Cleansing Sewers.” Water Science and Technology 33 (9): 195–205. doi:10.2166/wst.1996.0210.
- May, R., P. Brown, G. Hare, and K. Jones. 1989. “Self-Cleansing Conditions for Sewers Carrying Sediment.” Report SR 221. Wallingford, UK: Hydraulics Research Wallingford.
- Mayerle, R. 1988. “Sediment Transport in Rigid Boundary Channels.” PhD diss., University of Newcastle upon Tyne. Newcastle Upon Tyne, UK.
- Mayerle, R., C. Nalluri, and P. Novak. 1991. “Sediment Transport in Rigid Bed Conveyances.” Journal of Hydraulic Research 29 (4): 475–495. doi:10.1080/00221689109498969.
- Mays, L. 2001. Stormwater Collection Systems Design Handbook. New York: McGraw-Hill.
- Merritt, L. 2009. “Tractive Force Design for Sanitary Sewer Self-Cleansing.” Journal of Hydraulic Engineering 135 (12): 1338–1348.
- Minister of Interior. 1977. Instruction Technique Relative Aux Réseaux D’assainissement Des Agglomerations, IT 77284 I. Paris, France: Minister of interior: circulaire interministerielle.
- Montes, C., L. Berardi, Z. Kapelan, and J. Saldarriaga. 2018. “Evaluation of Sediment Transport in Sewers Using the EPR-MOGA-XL.” In 1st Water Distribution Systems Analysis - Computing and Control for the Water Industry Joint Conference, Kingston, Ontario, Canada.
- Montes, C., Z. Kapelan, and J. Saldarriaga. 2019. “Impact of Self-Cleansing Criteria Choice on the Optimal Design of Sewer Networks in South America.” Water 11 (6): 1148. doi:10.3390/w11061148.
- Najafzadeh, M., D. Laucelli, and A. Zahiri. 2017. “Application of Model Tree and Evolutionary Polynomial Regression for Evaluation of Sediment Transport in Pipes.” KSCE Journal of Civil Engineering 21 (5): 1956–1963. doi:10.1007/s12205-016-1784-7.
- Nalluri, C., A. A. Ghani, and A. El-Zaemey. 1994. “Sediment Transport over Deposited Beds in Sewers.” Water Science and Technology 29 (1–2): 125–133.
- Nalluri, C., and A. A. Ghani. 1996. “Design Options for Self-Cleansing Storm Sewers.” Water Science and Technology 33 (9): 215–220. doi:10.2166/wst.1996.0214.
- Novak, P., and C. Nalluri. 1975. “Sediment Transport in Smooth Fixed Bed Channels.” Journal of the Hydraulics Division of the American Society of Civil Engineering 101 (HY9): 1139–1154.
- Novak, P., and C. Nalluri. 1984. “Incipient Motion of Sediment Particles over Fixed Beds.” Journal of Hydraulic Research 22 (3): 181–197. doi:10.1080/00221688409499405.
- Ota, J. 1999. “Effect of Particle Size and Gradation on Sediment Transport in Storm Sewers.” PhD diss., University of Newcastle Upon Tyne. Newcastle Upon Tyne, UK.
- Perrusquía, G. 1991. “Bedload Transport in Storm Sewers: Stream Traction in Pipe Channels.” PhD diss., Chalmers University of Technology. Gothenburg, Sweden.
- Pulliah, V. 1978. “Transport of Fine Suspended Sediment in Smooth Rigid Bed Channels.” PhD diss., University of Roorkee. Roorkee, India.
- Robinson, M., and W. Graf. 1972. Critical Deposit Velocities for Low-Concentration Sand-Water Mixtures. Atlanta, GA: ASCE National Water Resources Engineering Meeting.
- Safari, M., H. Aksoy, and M. Mohammadi. 2015. “Incipient Deposition of Sediment in Rigid Boundary Open Channels.” Environmental Fluid Mechanics 15 (5): 1053–1068. doi:10.1007/s10652-015-9401-8.
- Safari, M., H. Aksoy, N. Unal, and M. Mohammadi. 2017. “Non-Deposition Self-Cleansing Design Criteria for Drainage Systems.” Journal of Hydro-Environment Research 14 (2017): 76–84. doi:10.1016/j.jher.2016.11.002.
- Safari, M., M. Mohammadi, and A. A. Ghani. 2018. “Experimental Studies of Self-Cleansing Drainage System Design: A Review.” Journal of Pipeline Systems Engineering and Practice 9 (4): 04018017. doi:10.1061/(ASCE)PS.1949-1204.0000335.
- Vanoni, V., Ed. 2006. Sedimentation Engineering. Reston, VA: American Society of Civil Engineers.
- Vongvisessomjai, N., T. Tingsanchali, and M. Babel. 2010. “Non-Deposition Design Criteria for Sewers with Part-Full Flow.” Urban Water Journal 7 (1): 61–77. doi:10.1080/15730620903242824.