
 ?Mathematical formulae have been encoded as MathML and are displayed in this HTML version using MathJax in order to improve their display. Uncheck the box to turn MathJax off. This feature requires Javascript. Click on a formula to zoom.
ABSTRACT
Applying life cycle assessment (LCA) to water distribution networks (WDNs) usually requires considerable reliable data, and neglecting specific parts could significantly affect the reliability of results. In this paper, a comprehensive life cycle inventory dataset was collected to evaluate the environmental burdens associated with the construction and renovation stages of WDNs. The aim is to explore the effects of the availability of primary and secondary data on the LCA results based on analysis of uncertainties. The results indicate the importance of considering road construction processes, especially for small-to-medium-sized plastic pipes. Although recovering energy from the incineration of plastic pipes partially compensates for the impacts at the end of life, these incineration processes significantly affect the global warming potential. Finally, this study demonstrates that without considering all known information (e.g., network data), reliable LCA for WDNs can be performed, providing suggestions on which data to focus on in data collection process.
Introduction
An urban water system (UWS), as one of the key infrastructures in urban areas, is composed of several parts including a water treatment plant (WTP), a water distribution network (WDN), a wastewater collection (WWC), and a wastewater treatment plant (WWTP). Currently, UWSs are facing increasingly complex challenges such as climate change and population growth (UNESCO Citation2012). The world’s population is expected to reach 8.5 billion in 2030, 9.7 billion in 2050, and 10.9 billion in 2100 (UN DESA Citation2019), which will lead to growing domestic, agricultural, and industrial water demands. Therefore, it is necessary to construct new systems and to renovate obsolete UWSs. Accordingly, the sustainability of UWS infrastructure must be assessed by determining environmental potentials within the construction and renovation stages of UWSs by carrying out detailed life cycle assessment (LCA). LCA as a standardized method (ISO Citation2006) has proven its applicability for the environmental evaluation of different life cycle stages of UWSs such as construction, operation, and end of life (Loubet et al. Citation2014). LCA calculates the corresponding emissions of materials and energy involved in a product or process with regard to impact categories (e.g., global warming potential and toxicity).
1.1 Background
In some studies, LCA has been conducted for entire UWSs and operation stages have been evaluated from an environmental perspective (García-Sánchez and Güereca Citation2019; Godskesen et al. Citation2013). Xue et al. (Citation2019) assessed the life cycle environmental and economic impacts of the UWS of Greater Cincinnati in the United States. They indicated that 41% of global warming potential and 43% of energy consumption of the entire UWS were related to the operation and maintenance phase of the WDN. In contrast, some researchers have only focused on specific parts of UWSs, such as WWTPs (Awad, Alalm, and El-Etriby Citation2019; Garfí, Flores, and Ferrer Citation2017), WDNs (Sanjuan-delmás et al. Citation2014; Piratla et al. Citation2012), and WWCs (Morera et al. Citation2016; Vahidi et al. Citation2016), to elucidate the significance of inventory data and compare the environmental impacts caused in different LCA phases. Risch et al. (Citation2015) conducted a comprehensive LCA for sewer systems and WWTPs considering the construction and operation phases. The results demonstrated the great contribution of sewer systems (especially their construction phase) to the environmental impacts of urban wastewater systems. Vahidi et al. (Citation2016) analyzed different pipe materials for two types of sewer systems (gravity systems and systems with lifting stations) and highlighted the impacts of pipe manufacturing in gravity systems. The impacts of trench materials, installation machinery, and road construction were neglected in that study, whereas Risch et al. (Citation2015) indicated the importance of environmental burdens associated with climate change and terrestrial acidification for civil works and bituminous paving in sewer systems. In addition, Petit-Boix et al. (Citation2014) showed that the environmental impacts of the installation phase for WWCs in small-to-medium-sized cities could be considerable, as they could reach up to 80% of the total effects in some impact categories.
Focusing on the pipes in WDNs, environmental effects derived from various phases of WDNs have been investigated in the literature. For instance, Piratla et al. (Citation2012) investigated carbon dioxide emissions of pipe materials in different phases. They concluded that the amount of CO2 emissions released in the production phase of polyvinyl chloride (PVC) pipes was higher than that associated with ductile iron (DI). However, in other publications, the impacts of the production of 200 mm DI pipes regarding the global warming category were found to be around four to six times higher than those associated with PVC pipes (Sanjuan-delmás et al. Citation2014; Hajibabaei, Nazif, and Sereshgi Citation2018).
1.2 Problem statement
Various conclusions in the aforementioned literature were mostly based on the different types of data collected regarding the time and available budget. Performing LCA is strongly dependent on the availability of life cycle inventory data, which has been a serious challenge not only for LCA of UWSs but also in other LCA applications (Miah et al. Citation2018). Generally, conducting LCA requires two types of data: 1) foreground (primary) data, which are measured or collected from specific companies or parties; and 2) background (secondary) data, which refer to the data that can be found in the literature and databases (ILCD Citation2010; Klöpffer and Grahl Citation2014). Applying LCA to WDNs requires the collection of large amounts of primary and secondary data, which is time-consuming and costly. In addition, primary data collection depends on the data owners’ willingness to share information. Besides, the lack of availability of reliable data for LCA enforces constraints on the goals and scope of the studies (Opher and Friedler Citation2016). To fill this research gap, a systematic investigation exploring the effects of the availability of data on the environmental assessment of WDNs is needed. It is worthwhile to mention that reliability in the context of LCA refers to verified (e.g., official statistics) or unverified data (e.g., personal information), which can considerably affect the accuracy of results (Frischknecht et al. Citation2007).
1.3 Aim of the study
This article aims to conduct a comprehensive LCA for WDNs to highlight hotspots and investigate the effects of considering different qualities of primary and secondary data on the results. The findings of this research provide suggestions on which data to focus on in the data collection process for reliable LCA of WDNs, especially when extensive data collection is necessary. In other words, the results indicate to what extent conducting reliable LCA for WDNs is achievable if some inventory data for the LCA or even for parts of networks are missing. That makes it possible to perform LCA of WDNs with incomplete data to identify the potential targets for environmental improvements.
1.4 Objectives
To achieve the aim of this study, the following specific objectives were formulated to conduct comprehensive LCA for the construction and renovation of WDNs:
Providing a detailed inventory of materials, energy, and machinery used for different phases of construction and renovation;
Comparing the environmental impacts of WDN pipes in 10 diameter classes, considering two design pressures for the lifespans of 25 and 50 years;
Identifying the most relevant data for LCA of WDNs and therefore the least amount of data needed for reliable LCA in the construction phase;
Investigating the possibility of conducting LCA of WDNs with (partly) unknown data, based on uncertainty analyses and Monte Carlo simulations.
To attain these goals, a state-of-the-art data set including uncertainty bandwidths was assembled. In addition to the general LCA data, other types of inventory (e.g., road construction, pipe laying, hydrostatic testing, and incineration of old pipes), which have been neglected in most previous studies, were considered in this research.
2. Materials & methods
In this study, LCA was applied to evaluate the environmental impacts of WDNs. Based on the methodology proposed by the International Organization for Standardization (ISO Citation2006), LCA was executed through the four following steps: (1) system boundaries and functional unit definition; (2) life cycle inventory analysis; (3) life cycle impact assessment; and (4) uncertainty analysis and scenarios.
2.1 System boundaries and functional unit definition
The system boundaries comprised materials and activities carried out in the construction and renovation stages. The operation stage was excluded, as its impacts are mainly site-specific compared with other stages (Petit-Boix et al. Citation2014). For WDNs equipped with pumping stations, the environmental impacts of the operation phase mostly depend on the pumping energy, which is influenced by several factors such as topography and the efficiency of the pumps (Sanjuan-delmás et al. Citation2014) or even the energy mix. In addition, for gravity-driven water networks, operation impacts are mainly caused by pipe breaks, which have minor environmental effects compared with those derived from the construction stage (Hajibabaei, Nazif, and Sitzenfrei Citation2019). Therefore, the system boundaries defined in this study were focused on the different phases in the construction and renovation stages to provide more general detailed data for WDNs.
depicts the defined phases in each stage of the system boundaries. The construction stage consists of four phases including production, transportation, pipe installation, and road construction (see )). ) shows the processes and materials considered in each phase. For instance, in the production phase of high-density polyethylene, pipes are manufactured using raw materials (polyethylene) and extruder machine (manufacturing process). In the installation phase, based on the material and diameter of the pipes, gravel and sand, as well as several types of machinery, are used in the piping process. Then, in the road construction phase, the effects of asphalt placement are considered. The transportation phase comprises the transportation of pipes, trench materials, and asphalt materials to the site. Additionally, transportation of extra soil excavated from the installation site to the landfill is considered in this phase.
Figure 1. Stages and phases considered in the system boundaries
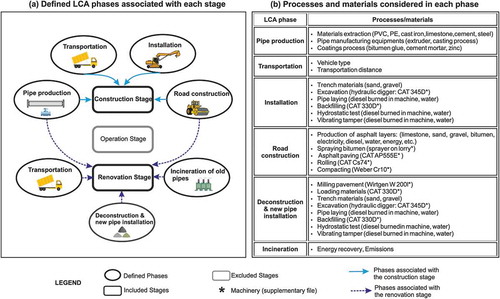
As shown in ), for the renovation stage of plastic pipes, five phases are defined: production, installation (i.e., trench deconstruction and installation of new pipes), road construction, incineration, and transportation. The production phase is the same for both the renovation and construction stages. The installation phase requires breaking the previous asphalt, excavating the trench, extracting the previous pipe, and installing the new pipe (see )). Then, new asphalt is constructed on top of the trench in the road construction phase. In the incineration phase, extracted pipes are transported to the incineration plant to recover energy. The transportation phase of the renovation stage comprises the following steps:
Transportation of new pipes and trench materials to the installation site,
Transportation of the removed pavement and extra soil from the installation site to the landfill,
Transportation of old pipes to the incineration plant, and
Transportation of new asphalt materials from the plant to the site.
In addition to the system boundaries, the functional unit is defined in the first step of LCA. A functional unit, as a quantified description of the function of a system (Arzoumanidis et al. Citation2020), provides a reference, based on which all the inputs and outputs are defined. In this study, the functional unit was defined as the construction and renovation of one meter of infrastructure required for WDNs with a life span of 50 years.
2.2 Life cycle inventory (LCI) analysis
In this step, all the inputs and outputs required for LCA of a system (e.g., materials, processes, and emissions) are quantified based on the collected data. For this purpose, in each phase, the inventory data related to three different types of pipe, including ductile iron (DI), polyvinyl chloride (PVC), and high-density polyethylene (HDPE), were collected in 10 different diameter classes ranging from 80 to 600 mm. Most of the pipe data were collected from factories and the Tehran Province Water and Wastewater Company (TPWWC Citation2019) in Iran. Several techniques, such as completing questionnaires, conducting interviews, and visiting sites, were employed to collect data on materials, energy, and processes leading to environmental impacts. In addition, the ecoinvent database, which offers international LCI data, was used for modeling sub-processes of the data (ecoinvent Citation2019). Out of these gathered data, a state-of-the-art LCI dataset with the uncertainty bandwidths was compiled for the LCA of WDNs. A summary of the LCI data for each phase can be found in the Supplementary Information (SI).
The effects of material extraction, production processes, and lining/coating of pipes were evaluated in the production phase of pipes. Considering a standard trench (SI, Figure S1), gravel and sand were chosen as bedding materials in the installation phase (AWWA Citation2003). Therefore, for this phase, the effects of bedding materials, as well as the piping process, including excavation, pipe placing, backfilling, compacting, etc., were investigated (see )). The machinery utilized for the installation of pipes (SI, Tables S16–21) was modeled based on the producer and secondary data and the ecoinvent database (Gschösser, Wallbaum, and Adey Citation2014; Atlas Citation2011; ecoinvent Citation2019; Caterpillar Citation2001; Weber Citation2010; Wirtgen Group Citation2010). For the transportation phase, transport vehicles were modeled using the ecoinvent 3.5 database. The road construction phase comprised LCI data for the production and construction of standard asphalt pavement with a width of 7.5 m in two lanes (Gschösser, Wallbaum, and Boesch Citation2011; Gschösser, Wallbaum, and Adey Citation2014). The details and inventory data for the production and construction of one square meter of the asphalt pavement are provided in the SI (Table S22). The effects of the incineration phase were analyzed based on a standard incineration power plant. This plant is located in the southern part of Tehran with an area of 22,600 m2 and a capacity of 3 MW. The plant has two lines of electricity generation, and the incinerators operate under international standards (Nabavi-Pelesaraei et al. Citation2017). The emissions released from the incineration process and the electricity production were modeled using the ecoinvent 3.5 database.
2.3 Life cycle impact assessment
In this step, to evaluate the magnitude and significance of impacts, the input and output quantified in the LCI (second step) were sorted, characterized, and aggregated to different environmental indicators. For this study, using the LCA software SimaPro 9.0 (Pré Consultants Citation2019), which includes the ecoinvent 3.5 database, the environmental impacts were evaluated. In this context, environmental impacts refer to the adverse or beneficial effects resulting from products, activities, and services used for the construction and renovation of WDNs. The CML-IA method V4.7 developed by the Center of Environmental Science of Leiden University (CML-IA Characterisation Factors Citation2016) was used for the life cycle impact assessment. The impact categories of global warming potential (GWP; kilogram CO2 equivalents), ozone layer depletion (OLD; kilogram CFC-11 equivalents), photochemical oxidation (PO; kilogram C2H4 equivalents), acidification potential (AP; kilogram SO2 equivalents), and eutrophication potential (EP; kilogram PO43− equivalents) were chosen. Additionally, non-renewable cumulative energy demand (CED, MJ equivalents) V1.11 was selected to investigate the direct and indirect energy sources consumed throughout the life cycles of the WDNs. Supplementary to this, to more easily compare between different scenarios, Eco-indicator 99 was applied, in which environmental impacts were classified, normalized, and weighted to a dimensionless number (point) (Pre’ Consultants Citation2014). In this study, the results were mostly interpreted based on the GWP and CED indicators to allow comparison with other studies. However, environmental burdens associated with other indicators are presented in the SI.
2.4 Uncertainty analysis and scenarios
To investigate the effects of neglecting parts of the data on the LCA results, the environmental impacts of two case studies were evaluated based on two scenarios. In the first scenario, the LCI data with effects of less than 10% of the total impacts of each phase were overlooked by investigating each phase based on the Eco-indicator. In the second scenario, it was assumed that the network data of the WDNs were not available. To determine the lengths and diameters of the networks’ pipes, DynaVIBe-Web (Mair, Rauch, and Sitzenfrei Citation2014) was used. This web-based application uses the strong correlation between street networks and water supply networks, and based on free available street map data, possible WDNs can be generated (Sitzenfrei Citation2016). To generate what are called semi-virtual WDNs, a digital elevation model of the region, the supplied area, and the total water demand are the required inputs (SI, Figure S6).
In the next step, the environmental impacts of scenarios composed of (partly) incomplete data were compared with the impacts of networks with the complete LCI data. To account for the uncertainties of the LCI data and evaluate the reliability of the results, Monte Carlo simulations were performed using the SimaPro software. In LCA context, uncertainty derived from input data used to create inventories is generally known as parameter uncertainty. Uncertainty throughout the LCI data can be described by a specific distribution characterized by a standard deviation (Goedkoop et al. Citation2008). Therefore, to calculate the standard deviation for every LCI entry, the pedigree matrix approach proposed by ecoinvent (Frischknecht et al. Citation2007) was applied based on seven factors (i.e., reliability, completeness, temporal correlation, geographical correlation, further technological correlation, sample size, and basic uncertainty). Subsequently, the Monte Carlo simulation was executed, in which a random value was taken from the uncertainty distribution of each LCI data point, and the LCA result was then calculated. This procedure was repeated 1,000 times, and the results formed a probability distribution for each scenario. Comparing different distributions created for the scenarios made it possible to investigate the influence of neglecting parts of the data on the LCA results. Based on the proposed procedure, reliable suggestions on which data to focus on for LCA of WDNs, especially when extensive data collection is necessary, can be provided.
3. Results & discussion
3.1. Environmental impacts associated with the construction stage
shows the environmental burdens for the construction stage of three pipes with the design pressure of 10 bar. The values of all the environmental indicators for 200 and 400 mm pipes are presented in as examples. The results of other indicators for all 10 different diameters can be found in the SI file (SI, Tables S35-43). As shown in ), the road construction phase of the plastic pipes with small diameters (e.g., 110 mm) has a significantly higher impact on the CED compared with the other phases. This is mostly because of the environmental burdens of bitumen as an energy-intensive petroleum refining product (Santero, Masanet, and Horvath Citation2010). The amount of raw materials required for the production of HDPE 400 mm with a design pressure of 10 bar is 13 times greater than that required for 110 mm pipes, whereas the materials needed for asphalt placement on the top of the 400 mm trench are approximately 1.6 times greater than that needed for 110 mm pipes. Therefore, for HDPE pipes with a diameter of 400 mm, the production phase plays a significant role with contributions of 65% and 67% to the GWP and CED indicators, respectively. In addition, the abundant materials and energy required for the manufacturing of DI pipes make the production phase of DI the highest-impact phase. For instance, indicates that the emissions from the production of DI and PVC pipes with a diameter of 400 mm regarding the GWP category are 363 and 84.6 kg CO2 equivalents, respectively. Thus, according to ), the production phase of 400 mm DI contributes more than 80% to the GWP. Generally, as shown in ), by increasing the pipe diameter, the contribution of the production phase is rapidly increased, which leads to reducing the environmental contribution of road construction.
Table 1. Environmental indicators of different phases in the construction stage (1 m of WDN, design pressure = 10 bar)
Figure 2. Environmental impacts for 1 m of WDN construction (design pressure of 10 bar)
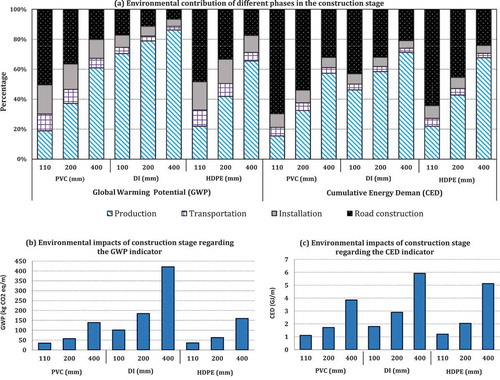
However, the environmental impacts of the installation phase can also be considerable, especially for plastic pipes with small diameters (less than 110 mm). For example, the CO2 emission associated with the installation of 90 mm PVC pipe with a design pressure of 10 bar is 6.3 kg (SI, Table S43), which is approximately 1.5 times greater than that associated with the production phase. In summary, ,) indicate that the total environmental burden of DI pipes in the construction stage is higher than those of PVC and HDPE pipes.
The environmental contributions of different phases for the pipes with a design pressure of 6 bar can be found in the SI (SI, Figure S2). In these pipes, the production phase has less contribution in comparison with the pipes with a design pressure of 10 bar. For instance, as shown in ), for PVC pipes with a diameter of 400 mm (10 bar), around 60% of the impacts within the GWP indicator are associated with the production phase, whereas for the same pipe but with a design pressure of 6 bar, this amount is around 50%. These differences are mainly derived from the amount of raw materials and energy consumed over the production phase. As an example, one meter of PVC 400 mm pipe (10 bar) is made of 32 kg of polyvinyl chloride, whereas for manufacturing this pipe with a design pressure of 6 bar, 21 kg/m of raw material is required (see SI, Table S5–6).
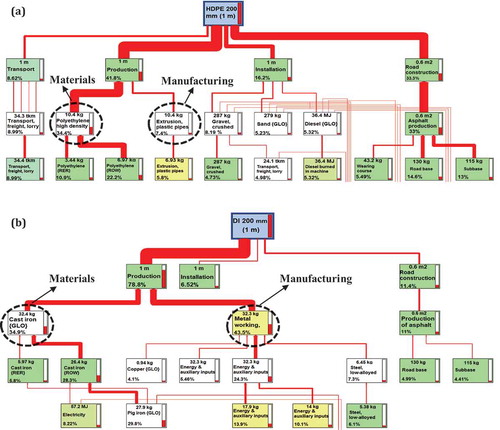
provides information on the environmental burdens associated with the construction of 1 m of HDPE and DI in terms of the GWP indicator. In this figure, line thickness represents the environmental loads caused by each process and material. Because many processes are involved in the construction phase, only the contributions of materials and processes with impacts greater than 4% of the total effects are indicated in this figure. As shown in ), for the HDPE pipe with a diameter of 200 mm, 34.4% of the total impacts are related to the raw materials, whereas the manufacturing process (extrusion), with 7.4% of the overall impacts, has a minor effect on the GWP indicator. However, according to ), more than 40% of the impacts within the GWP are attributed to the manufacturing process of DI. Generally, it can be concluded that unlike DI pipes, raw materials have more significant influences on the environmental impacts of the production phase of plastic pipes. Therefore, unavailable data in this phase can significantly influence the results. For instance, focusing on the materials and neglecting part of the energy required for pipe manufacturing, Piratla et al. (Citation2012) concluded that the CO2 emissions from the embodied energy of PVC were higher than those associated with DI pipes, which contrasts with the findings of other research (Sanjuan-delmás et al. Citation2014; Hajibabaei, Nazif, and Sereshgi Citation2018).
Figure 3. Contribution of each process in terms of the GWP indicator for construction of 1 m of WDN (impacts > 4% of total effects) with: (a) HDPE 200 mm, (b) DI 200 mm
3.2. Environmental impacts associated with the renovation stage of plastic pipes
The environmental impacts of PVC and HDPE pipes in the renovation stage are shown in . Analyzing the contribution of each phase indicates that similar to the construction stage, road construction is the primary source of impact with small-diameter pipes. Bitumen as a resource-intensive product is the main factor responsible for increasing the impacts of this phase. For example, for the CED indicator with 200 mm PVC, around 41% out of 53% of the environmental effects of road construction are related to the production of 13 kg of bitumen (SI, Figure S3). Thus, only 12% of the impacts are associated with other materials (gravel, sand, limestone, etc.) and the energy consumed during the construction of asphalt pavement.
Figure 4. Environmental impacts for 1 m of WDN renovation (design pressure of 10 bar)
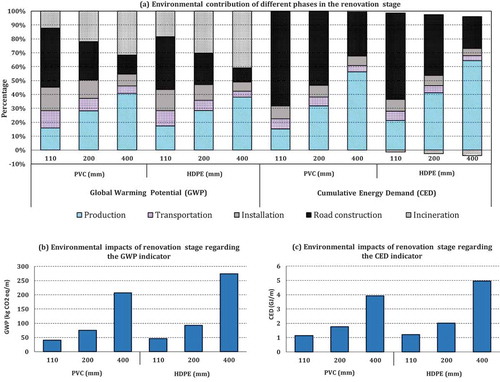
As indicated in , the recovery of electricity in the incineration phase cannot play a role in the reduction of the GWP indicator. Although a reduction in the GWP indicator associated with energy recovery has been reported in some studies (Turconi et al. Citation2011), it was attributed to the different types of materials (municipal solid waste) burned in the incinerators. In this study, the significant contributions of the incineration phase to the GWP are attributed to the chemical compositions released during the incineration of plastic solid waste. Burning plastic waste such as PVC and HDPE pipes leads to emissions of volatile organic compounds, polycyclic aromatic hydrocarbons, sulfur oxides, and large amounts of greenhouse gases, which increase the GWP (Al-Salem, Lettieri, and Baeyens Citation2009; Antelava et al. Citation2019). The heating value of the incineration of HDPE is 41.84 MJ/kg, which is two times greater than that of PVC (Morera et al. Citation2016). Therefore, as shown in ), the energy recovery from burning HDPE pipes can offset the adverse effects of incineration impacts associated with the CED indicator.
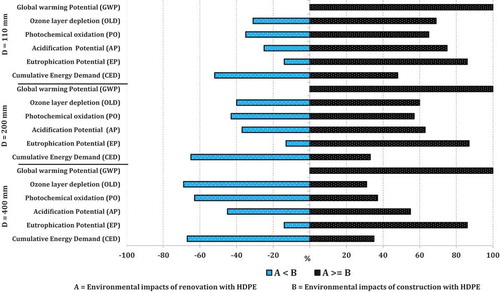
To make a comparison between the environmental impacts of the construction and renovation stages of HDPE pipes, Monte Carlo simulations were performed for three diameters. To do so, based on the defined standard deviation for each LCI, 1,000 Monte Carlo runs were executed to form the uncertainty distribution. For all of the environmental indicators, shows the probability that the environmental impact of the renovation stage is higher (A ≥ B) or lower (A < B) compared with the construction stage. For large diameters such as 400 mm, because of the electricity recovered by the incinerators, the renovation stage shows lower impacts than the construction stage in the OLD, PO, and CED indicators. For example, for HDPE with a diameter of 400 mm, the possibility that the impact in terms of the OLD indicator in the renovation stage is lower than that in the construction stage is 69%. Generally, it can be concluded that by increasing the pipe diameters of HDPE pipes, the probability of obtaining more benefits in terms of the OLD, PO, AP, and CED indicators from recovering energy increases. However, compared with the construction stage, some extra processes such as removing old pavement, incinerating old pipes, and transporting additional materials are needed in the renovation stage. These extra materials and activities lead to more emissions of greenhouse gases, nitrogen dioxide, nitrogen oxide, and sulfur oxides. Therefore, as shown in , those extra processes increase the probability of higher impacts in the renovation stage in terms of the GWP and EP indicators compared with the construction stage.
Figure 5. Monte Carlo simulations for comparing the environmental impacts of the construction and renovation stages
3.3. Influence of life span of pipes on environmental impacts
In WDNs, various factors such as operational (e.g., pressure management and installation conditions), environmental (e.g., temperature and soil moisture), and pipe-intrinsic factors (e.g., diameter and quality of materials) can influence the life span and failure rate of water pipes (Sanjuan-delmás et al. Citation2014; Barton et al. Citation2019). Because these factors vary for different cases, few reliable data can be found for the actual life span of water distribution pipe materials. Sanjuan-delmás et al. (Citation2014) assumed a life span of 50 years for assessing the environmental impacts of 200 mm DI pipe with a design pressure of 10 bar. In addition, some studies have considered average life spans of PVC and HDPE to be 25 ± 5 and 40 ± 10 years, respectively (Morera et al. Citation2016). In this study, based on the information obtained from the TPWWC and pipe producers (TPWWC Citation2019), average life spans of 25 years, 50 years, and over 50 years were adopted for PVC, HDPE, and DI pipes, respectively.
) indicates that the differences between the environmental impacts in terms of the GWP indicator are not considerable in the construction stage of small plastic pipes. DI pipes are the most impactful pipes with all different diameters in terms of the GWP. For example, during the construction of one meter of 200 mm DI pipe (10 bar) in the production, transportation, installation, and road construction phases, around 184 kg CO2 eq is released, which is approximately three times greater than the amount associated with plastic pipes. This fact is due to the higher environmental impacts of the production phase of DI () compared with those of the other pipe materials. ) shows that the differences between the environmental burdens of DI and plastic pipes in terms of the CED are less compared with ). This issue can be explained by the large amount of energy required for the raw materials in the production phase of plastic pipes, especially HDPE pipes, which is reflected in the CED indicator.
Figure 6. Influence of the life spans of different pipe materials on environmental impacts
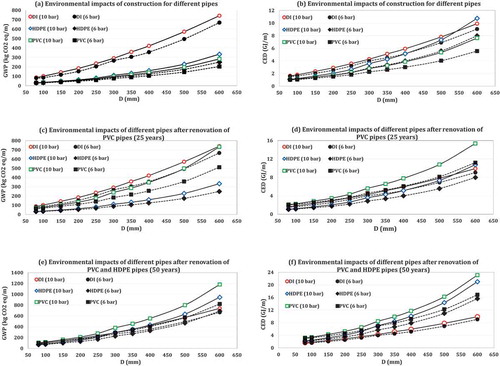
With the replacement of PVC pipes after 25 years, ) shows that although PVC pipes have more significant impacts than HDPE pipes, the effects in terms of the GWP of DI pipes (10 bar) are still higher than those of PVC. ,) show the environmental effects caused by the construction of pipes plus two renovations for PVC pipes and one renovation for HDPE pipes. As shown in ,), the renovation of PVC after 25 and 50 years makes it the highest-impact material in terms of the CED indicator.
demonstrates that considering the different life spans for pipe materials can turn them into the options with the highest or lowest impacts. Several studies have been conducted based on LCA to identify the best or worst pipe materials (Piratla et al. Citation2012; Du et al. Citation2013; Vahidi et al. Citation2016; Hajibabaei, Nazif, and Sitzenfrei Citation2019). However, it can be concluded from that considering several factors such as life span, design pressure, and diameter can significantly affect the environmental burdens of different pipe materials. Therefore, a specific pipe material cannot be generally presented as the most environmentally impactful pipe for WDNs.
3.4. Effects of availability of various types of data on LCA of WDNs
In this section, the effects of the availability of the various types of data on the environmental impacts of the construction phase are investigated. For this purpose, two WDNs located in the southern part of Tehran, Iran, were chosen as case studies. The first is a network with a pipe length of 73.74 km, a supply area of 413.1 ha, and 115,000 inhabitants, and was built around 31 years ago (Network 1). The majority of the network’s pipeline is made of DI (90%), and the percentage of PVC, HDPE, and steel pipes combined is 10% of the total length. The second network, with an average age of 20 years, supplies water to an area of 955.56 ha with a population of 195,000 (Network 2). This WDN is composed of 212.37 km of pipes including DI (62%), HDPE (30%), steel (5.5%), and PVC (2.5%). The length and diameter of each type of pipe, as well as the number of valves in the networks, are presented in the SI (SI, Table S44).
First, using the assembled dataset and calculated impacts based on the functional unit (one meter), the environmental burdens associated with the construction stage were calculated. Then, running Monte Carlo simulations, the probability distributions in terms of the GWP, CED, and Eco-indicators were formed (blue curves in ). For instance, ) shows that the 95% confidence interval for the impacts associated with the GWP of Network 1 is between 9 and 11.4
kg CO2 eq. Applying the first scenario and neglecting the data with impacts of less than 10% of the total effects of each phase, every phase was investigated separately. For example, in the installation phase of 1 meter of DI pipe with a diameter greater than 200 mm, only the contributions of bedding materials and diesel were more than 10% of the total effects (SI, Figure S5). Therefore, the effects of backfilling, excavation, and compacting were overlooked. Applying this approach to each pipe material resulted in overlooking around 40% of the LCI data for the case studies. As illustrated in , the probability distributions for this scenario (red curves) are still comparable with the networks analyzed with the complete data. This result conveys the crucial message that when the time for data collection is limited, by neglecting a portion of the LCI data, reliable LCA for the construction stage of WDNs is still achievable.
Figure 7. Probability distribution of case studies associated with GWP, CED, and Eco-indicator
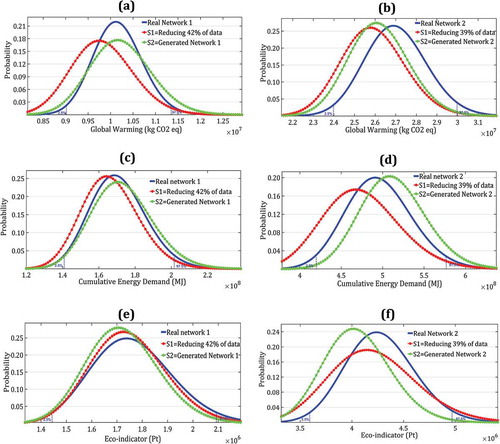
In the second scenario, the lengths and diameters of pipes were determined using DynaVIBe-Web. For this scenario, pipe materials were the only property that needed to be defined to perform the LCA. Pipe materials were determined based on the period of construction of the WDNs. For instance, in the period of construction of Network 1, DI with the diameter range of 80 to 500 mm was a common material, and pipes with larger and smaller diameters were usually made of steel and plastic pipes, respectively. In contrast, Network 2 is a grown network (SI, Figure S4) that was extended around ten years ago, and because HDPE pipes have been commonly used for new networks in that period of time, it was assumed that newly constructed parts were made of HDPE pipes. ,,) show that for Network 1, the probability distributions of the second scenario depict suitable results compared with the real network, and there is not much change in the skewness values and means of the distributions. For example, the mean values of the distributions in terms of the CED of Network 1 for the real case and the generated network ()) are 1.71 and 1.73
MJ, respectively. indicates that although the distributions of the generated network for Network 2 are more shifted to the sides compared with Network 1, the results are still comparable with the real case. The differences between environmental impacts of the generated network and the real one for Network 2 are related to the assumptions made about the pipe materials in the grown areas.
4. Conclusions & recommendations
In this study, using a comprehensive LCI dataset, the environmental impacts of construction and renovation of WDNs were evaluated. The main finding of the study are as follows:
Analyzing materials and processes showed the importance of considering the effects of asphalt placement on the environmental impacts of WDNs. For example, regarding the CED indicator, the environmental burdens associated with the road construction phase are higher than the total impacts of the transportation and installation phases.
In the production phase of DI pipes, as the most impactful phase, the manufacturing process plays a role in the environmental impact, whereas the production phase of plastic pipes is significantly affected by the impacts of raw materials. This finding highlights the significance of paying more attention to collecting data related to the materials of plastic pipes for future studies.
Although the incineration of plastic pipes in the renovation stage has adverse effects on the GWP and EP indicators, recovering energy could offset some impacts for pipes with large diameters. For instance, regarding GWP, the environmental effect of the incineration phase of 400 mm HDPE is 40% of the total impact, whereas recovering energy from this phase compensates around 5% of the effects in the CED.
Investigating the influence of neglecting parts of data on the LCA results indicated that with partly incomplete LCI data and focusing on the processes and materials with the stronger effects, environmental evaluation is still meaningful. In the second scenario (generated network), the proposed method showed suitable results for the case studies. For example, the differences between the means of the distributions in terms of the Eco-indicator in the real case studies and generated networks are 2.2% and 5.3%, respectively.
This study proposed comprehensive LCI data collection for the impact assessment of three pipe materials. However, for future studies, following up by composing complete inventory data for other pipes (e.g., asbestos cement, steel, and concrete) is suggested to explore the actual amounts of data needed for reliable LCA based on different pipe materials. Additionally, an in-depth analysis should be conducted to investigate the effects of the availability of data on the LCA results for the operation stage. For potential future research, holistic LCA for various study areas is recommended to investigate the effects of topology, pressure of the system, and socioeconomic factors on environmental impacts. It may also be of interest to evaluate the environmental effects of new installation methods such as trenchless technology to explore potential for environmental improvement.
Supplementary_information_.xlsx
Download MS Excel (5 MB)Acknowledgements
This study is part of the SAFERUP! Project, an innovative training network to develop “safe, accessible, and urban pavements”.
Disclosure statement
No potential conflict of interest was reported by the author(s).
Supplementary material
Supplemental data for this article can be accessed here.
Additional information
Funding
References
- Al-Salem, S. M., P. Lettieri, and J. Baeyens. 2009. “Recycling and Recovery Routes of Plastic Solid Waste (PSW): A Review.” Waste Management 29 (10): 2625–2643. doi:10.1016/j.wasman.2009.06.004.
- American Water Works Association (AWWA). 2003. Ductile-Iron Pipe and Fittings (Vol. 41), Standards Committee A21 on Ductile-Iron Pipe and Fittings. Vol. 41. Denver, USA: American Water Works Association.
- Antelava, A., S. Damilos, S. Hafeez, G. Manos, S. M. Al-Salem, B. K. Sharma, K. Kohli, and A. Constantinou. 2019. “Plastic Solid Waste (PSW) in the Context of Life Cycle Assessment (LCA) and Sustainable Management.” Environmental Management 64 (2): 230–244. doi:10.1007/s00267-019-01178-3.
- Arzoumanidis, I., M. D’Eusanio, A. Raggi, and L. Petti. 2020. “Functional Unit Definition Criteria in Life Cycle Assessment and Social Life Cycle Assessment: A Discussion.” In Perspectives on Social LCA, 1–10. Cham: Springer.
- Atlas. 2011. Data gathered from Atlas Industries, construction equipment and machinery. Atlas Bitumen Sprayer. Atlas. Gujarat, India.
- Awad, H., M. G. Alalm, and H. K. El-Etriby. 2019. “Environmental and Cost Life Cycle Assessment of Different Alternatives for Improvement of Wastewater Treatment Plants in Developing Countries.” Science of the Total Environment 660: 57–68. doi:10.1016/j.scitotenv.2018.12.386.
- Barton, N. A., T. S. Farewell, S. H. Hallett, and T. F. Acland. 2019. “Improving Pipe Failure Predictions: Factors Effecting Pipe Failure in Drinking Water Networks.” Water Research 164: 114926. doi:10.1016/j.watres.2019.114926.
- Caterpillar, T. C. 2001. Caterpillar Performance Handbook. Preoria: Caterpillar.
- CML-IA Characterisation Factors. 2016. “CML - Department of Industrial Ecology.” https://www.universiteitleiden.nl/en/research/research-output/science/cml-ia-characterisation-factors
- Du, F., G. J. Woods, D. Kang, K. E. Lansey, and R. G. Arnold. 2013. “Life Cycle Analysis for Water and Wastewater Pipe Materials.” Journal of Environmental Engineering 139 (5): 703–711. doi:10.1061/(ASCE)EE.1943-7870.0000638.
- ecoinvent. 2019. “Swiss Centre for Life Cycle Inventories. Ecoinvent Database V3.5.” https://www.ecoinvent.org/database/database.html
- Frischknecht, R., N. J. Editors, H.-J. Althaus, G. Doka, R. Dones, T. Heck, S. Hellweg, et al. 2007. “Ecoinvent 2 Overview and Methodology.” Ecoinvent Report No1 1 (1): 1–77. http://www.ecoinvent.org/fileadmin/documents/en/01_OverviewAndMethodology.pdf
- García-Sánchez, M., and L. P. Güereca. 2019. “Environmental and Social Life Cycle Assessment of Urban Water Systems: The Case of Mexico City.” Science of the Total Environment 693: 133464. doi:10.1016/j.scitotenv.2019.07.270.
- Garfí, M., L. Flores, and I. Ferrer. 2017. “Life Cycle Assessment of Wastewater Treatment Systems for Small Communities: Activated Sludge, Constructed Wetlands and High Rate Algal Ponds.” Journal of Cleaner Production 161: 211–219. doi:10.1016/j.jclepro.2017.05.116.
- Godskesen, B., M. Hauschild, M. Rygaard, K. Zambrano, and H.-J. Albrechtsen. 2013. “Life-Cycle and Freshwater Withdrawal Impact Assessment of Water Supply Technologies.” Water Research 47 (7): 2363–2374. doi:10.1016/j.watres.2013.02.005.
- Goedkoop, M., A. De Schryver, M. Oele, S. Durksz, and D. de Roest 2008. Introduction to LCA with SimaPro 7. The Netherlands: PRé Consultants.
- Gschösser, F., H. Wallbaum, and B. T. Adey. 2014. “Environmental Analysis of New Construction and Maintenance Processes of Road Pavements in Switzerland.” Structure and Infrastructure Engineering 10 (1): 1–24. doi:10.1080/15732479.2012.688977.
- Gschösser, F., H. Wallbaum, and M. E. Boesch. 2011. “Hidden Ecological Potentials in the Production of Materials for Swiss Road Pavements.” Journal of Management in Engineering 28 (1): 13–21. doi:10.1061/(ASCE)ME.1943-5479.0000077.
- Hajibabaei, M., S. Nazif, and F. T. Sereshgi. 2018. “Life Cycle Assessment of Pipes and Piping Process in Drinking Water Distribution Networks to Reduce Environmental Impact.” Sustainable Cities and Society 43 (November): 538–549. doi:10.1016/j.scs.2018.09.014.
- Hajibabaei, M., S. Nazif, and R. Sitzenfrei. 2019. “Improving the Performance of Water Distribution Networks Based on the Value Index in the System Dynamics Framework.” Water 11 (12): 2445. doi:10.3390/w11122445.
- ILCD. 2010. “General Guide for Life Cycle Assessment - Detailed Guidance. International Reference Life Cycle Data System (ILCD) Handbook.” European Commission-Joint Research Centre-Institute for Environment and Sustainability. doi:10.2788/38479.
- International Organization for Standardization (ISO). 2006. “ISO 14040-Environmental Management - Life Cycle Assessment - Principles and Framework.” International Organization for Standardization 3: 20. doi:10.1016/j.ecolind.2011.01.007.
- Klöpffer, W., and B. Grahl. 2014. Life Cycle Assessment (LCA): A Guide to Best Practice. Weinheim: Wiley-VCH Verlag GmbH & Co. KGaA.
- Loubet, P., P. Roux, E. Loiseau, and V. Bellon-Maurel. 2014. “Life Cycle Assessments of Urban Water Systems: A Comparative Analysis of Selected Peer-Reviewed Literature.” Water Research 67: 187–202. doi:10.1016/j.watres.2014.08.048.
- Mair, M., W. Rauch, and R. Sitzenfrei. 2014. “Spanning Tree-Based Algorithm for Generating Water Distribution Network Sets by Using Street Network Data Sets.” World Environmental and Water Resources Congress 2014: 465–474. doi:10.1061/9780784413548.050.
- Miah, J. H., A. Griffiths, R. McNeill, S. Halvorson, U. Schenker, N. Espinoza-Orias, S. Morse, A. Yang, and J. Sadhukhan. 2018. “A Framework for Increasing the Availability of Life Cycle Inventory Data Based on the Role of Multinational Companies.” The International Journal of Life Cycle Assessment 23 (9): 1744–1760. doi:10.1007/s11367-017-1391-y.
- Morera, S., C. Remy, J. Comas, and L. Corominas. 2016. “Life Cycle Assessment of Construction and Renovation of Sewer Systems Using a Detailed Inventory Tool.” The International Journal of Life Cycle Assessment 21 (8): 1121–1133. doi:10.1007/s11367-016-1078-9.
- Nabavi-Pelesaraei, A., R. Bayat, H. Hosseinzadeh-Bandbafha, H. Afrasyabi, and K. W. Chau. 2017. “Modeling of Energy Consumption and Environmental Life Cycle Assessment for Incineration and Landfill Systems of Municipal Solid Waste Management - A Case Study in Tehran Metropolis of Iran.” Journal of Cleaner Production 148: 427–440. doi:10.1016/j.jclepro.2017.01.172.
- Opher, T., and E. Friedler. 2016. “Reducing Inventory Data Requirements for Scenario Representation in Comparative Life Cycle Assessment (LCA), Demonstrated on the Urban Wastewater System.” Urban Water Journal 13 (7): 759–772. doi:10.1080/1573062X.2015.1036084.
- Petit-Boix, A., D. Sanjuan-Delmás, C. M. Gasol, G. Villalba, M. E. Suárez-Ojeda, X. Gabarrell, A. Josa, and J. Rieradevall. 2014. “Environmental Assessment of Sewer Construction in Small to Medium Sized Cities Using Life Cycle Assessment.” Water Resources Management 28 (4): 979–997. doi:10.1007/s11269-014-0528-z.
- Piratla, K. R., S. M. Asce, S. T. Ariaratnam, M. Asce, and A. Cohen. 2012. “Estimation of CO 2 Emissions from the Life Cycle of a Potable Water Pipeline Project.” Journal of Management 22–30. January. doi:10.1061/(ASCE)ME.1943-5479.0000069.
- Pré Consultants, S. 2019. “SimaPro Software.” SimaPro Version.
- Pre’ Consultants. 2014. “SimaPro Database Manual.” PRe’. Amersfoort (Nederlands).
- Risch, E., O. Gutierrez, P. Roux, C. Boutin, and L. Corominas. 2015. “Life Cycle Assessment of Urban Wastewater Systems: Quantifying the Relative Contribution of Sewer Systems.” Water Research 77: 35–48. doi:10.1016/j.watres.2015.03.006.
- Sanjuan-delmás, D., A. Petit-boix, C. M. Gasol, G. Villalba, M. E. Suárez-ojeda, X. Gabarrell, A. Josa, and J. Rieradevall. 2014. “Environmental Assessment of Different Pipelines for Drinking Water Transport and Distribution Network in Small to Medium Cities: A Case from Betanzos, Spain.” Journal of Cleaner Production 66: 588–598. doi:10.1016/j.jclepro.2013.10.055.
- Santero, N., E. Masanet, and A. Horvath. 2010. Life Cycle Assessment of Pavements: A Critical Review of Existing Literature and Research. Berkeley, CA: Lawrence Berkeley National Lab (LBNL).
- Sitzenfrei, R. 2016. “A Review on Network Generator Algorithms for Water Supply Modelling and Application Studies.” World Environmental and Water Resources Congress 2016: 505–515.
- Tehran Province Water and Wastewater Company (TPWWC). 2019. “Analysis of Tehran’s Water Distribution Network.” Accessed January 2019. Tehran (Iran).
- Turconi, R., S. Butera, A. Boldrin, M. Grosso, L. Rigamonti, and T. Astrup. 2011. “Life Cycle Assessment of Waste Incineration in Denmark and Italy Using Two LCA Models.” Waste Management & Research 29 (10_suppl): S78–90. doi:10.1177/0734242X11417489.
- UN DESA. 2019. “World Population Prospects 2019. United Nations. Department of Economic and Social Affairs.” World Population Prospects 2019. http://www.ncbi.nlm.nih.gov/pubmed/12283219
- UNESCO. 2012. “Managing Water under Uncertainty and Risk (UNWWD Report 4, Vol 1).” Vol. 1. http://unesdoc.unesco.org/images/0021/002156/215644e.pdf
- Vahidi, E., E. Jin, M. Das, M. Singh, and F. Zhao. 2016. “Environmental Life Cycle Analysis of Pipe Materials for Sewer Systems.” Sustainable Cities and Society 27: 167–174. doi:10.1016/j.scs.2016.06.028.
- Weber. 2010. Data gathered from Weber Maschinentechnik for Bodenverdichter CR 10. Weber Maschinentechnik GmbH. Bad Laasphe.
- Wirtgen Group. 2010. Technical specification – Cold milling machine W 200 Windhagen (Technical specification No. 11-20). Retrieved from www.wirtgen.de
- Xue, X., S. Cashman, A. Gaglione, J. Mosley, L. Weiss, X. C. Ma, J. Cashdollar, and J. Garland. 2019. “Holistic Analysis of Urban Water Systems in the Greater Cincinnati Region: (1) Life Cycle Assessment and Cost Implications.” Water Research X 2: 100015. doi:10.1016/j.wroa.2018.100015.