
 ?Mathematical formulae have been encoded as MathML and are displayed in this HTML version using MathJax in order to improve their display. Uncheck the box to turn MathJax off. This feature requires Javascript. Click on a formula to zoom.
ABSTRACT
Local real-time control (RTC) represents a potentially cost-effective solution for stormwater management in urban drainage systems. Existing methodologies to select the location of flow control devices (FCDs) are limited to single gate systems and are based on analysis of activated storage volume capacity, without considering hydrodynamic processes or rainfall characteristics. In this paper, a new genetic algorithm (GA)–based methodology is developed to determine the optimal location of multiple FCDs in urban drainage networks, when assessing RTC performance through hydraulic analysis. The methodology is tested on a case study network, where a high number of possible FCD location arrangements are tested and compared, and the RTC effectiveness in reducing combined sewer overflows has been evaluated over a range of design storm events. Results demonstrate the capability of the proposed method in selecting robust FCD placement strategies, for example when designing local RTC systems to meet specific performance criteria.
Introduction
Urbanisation, rapid population growth and more intense rainfall events are placing urban drainage systems (UDS) under significant operational pressure (Berggren et al. Citation2012; Miller and Hutchins Citation2017; Butler et al. Citation2007; Todeschini Citation2012). RTC systems in drainage networks are designed to operate and manage existing assets by monitoring the state of the system and regulating flow conditions in real time. They are usually implemented to mitigate urban flooding, regulate flows to wastewater treatment plants, reduce pollution for receiving waterbodies while minimizing capital and operational investments (Schütze et al. Citation2008). RTC systems are considered alternatives to construction-focused solutions (Dirckx et al. Citation2011), since their operational objectives are reached through dynamic control of operations mostly within the existing system. RTC systems can be classified either as local control systems or system-wide control systems, based on their complexity level and control scope (Vitasovic Citation2006; García et al. Citation2015; Schütze et al. Citation2003).
In local control systems, the control strategy usually relies on a limited number of actuators, and the operation is managed by direct measurement (e.g. level, flow) collected within the area affected by the RTC system. In system-wide control systems, the operational objectives are reached using a global control strategy and asset control may rely on data collected in other locations within the drainage network, often in conjunction with hydrodynamic models and optimisation techniques. Local control has the advantage of lesser effort and expense for data transfer than a complex RTC system (Schütze et al. Citation2003), making such a solution more economically viable for smaller UDS. Moreover, the operation of local RTC does not depend on the communication with other UDS assets and facilities, central RTC servers, or on-line models (Vitasovic Citation2006), enhancing the resilience to failure of the system.
Despite being an affordable and low-cost solution for stormwater management problems, there is a lack of research on strategy and implementation of decentralized and local RTC (e.g. Carbone, Garofalo, and Piro Citation2014; Garofalo et al. Citation2017) compared to studies of global control systems (e.g. Meneses et al. Citation2018; Fuchs and Beeneken Citation2005; Grum et al. Citation2011; Seggelke et al. Citation2013; Lund et al. Citation2018; Kroll et al. Citation2018; Dirckx et al. Citation2011). CENTAURFootnote1 is a local RTC system that utilizes the existing in-sewer capacity to control stormwater volumes in sewer networks (Ostojin et al. Citation2017; Mounce et al. Citation2020). CENTAUR commands FCDs inserted into existing infrastructure (i.e. gates installed in manholes), which consists of a movable sluice gate coupled with an emergency overflow weir. Sluice gate operation is based on an autonomous Fuzzy Logic–based control algorithm, and monitoring of water levels close to the FCD installation location. This technology has been developed to provide a local, low cost and easy to deploy solution for stormwater management, with potential benefits equivalent to capital intensive solutions (Shepherd et al. Citation2016). While design and implementation of a single FCD operated by CENTAUR has been investigated in previous research (Leitão et al. Citation2017; Shepherd et al. Citation2017; Abdel-Aal et al. Citation2016; Shepherd et al. Citation2016; Simões et al. Citation2018; Sá Marques et al. Citation2018), there are still significant research challenges and questions involved with the optimal positioning and interaction of multiple FCDs within an UDS. Selection of optimal control locations for urban flooding and CSO spill reduction is considered an essential step in designing RTC systems in sewer networks (Campisano, Schilling, and Modica Citation2000; Leitão et al. Citation2017; Philippon et al. Citation2015), and constitutes an ongoing research topic (Kroll et al. Citation2018; Muñoz et al. Citation2019). While a single FCD controlled by CENTAUR has been implemented as a pilot test in a sewer network (Sá Marques et al. Citation2018), multiple flow controllers will likely be needed in future implementations to meet required performance objectives (e.g. defined reductions in flood or CSO spill frequency).
Assessing optimal combinations of several FCD locations manually is a complex and time-consuming process, due to the high number of possible configurations (number and location of FCDs), hydraulic interactions between RTC assets, and spatial and temporal variation of rainfall and runoff volumes within the drainage system. One methodology to rapidly assess FCDs placement is to consider the in-sewer volume mobilised by the actuator in the existing pipe network (Kroll et al. Citation2018; Philippon et al. Citation2015; Campisano, Schilling, and Modica Citation2000; Dirckx et al. Citation2011). Leitão et al. (Citation2017) proposed a method to identify locations to install FCDs based on the in-pipe volume activated by the actuator, without the need for hydraulic simulations, by approximating the flow using a steady-state assumption. Their case study results showed that manholes with good storage potential can be located close together; however, under steady-state assumptions, it is not possible to evaluate how such actuators hydraulically interact, and thus the effectiveness of using installation locations which utilise the same storage volume. When considering optimum combinations of FCDs within local control RTC system, Kroll et al. (Citation2018) discarded all potential locations directly upstream/within the steady-state energy line of another FCD location. Therefore, to better understand the benefits and limitations of local RTC systems comprising several flow control locations, a robust assessment of the hydraulic interaction of different combinations of several FCDs would be beneficial.
A common approach in UDS optimisation problems is to combine a simulation model, to describe hydrologic and hydraulic processes within the catchment, with an optimisation algorithm, to test different alternatives and search the near-optimal solutions. Optimisation in stormwater management problems is typically a nonlinear and nonconvex problem (Shishegar, Duchesne, and Pelletier Citation2018), and a limited number of applications of classic optimisation techniques (e.g. linear programming, dynamic programming) can be found in the literature (Limbrunner et al. Citation2013a). For solving nonconvex or large-scale optimisation problems, heuristic approaches are considered more flexible and efficient than deterministic approaches (Lin, Tsai, and Yu Citation2012). Genetic Algorithms (GAs) are a popular and well-established heuristic optimisation method, capable to solve both constrained and unconstrained problems with discontinuous and non-differentiable objective functions (Kokash Citation2005). A literature review of the state-of-the-art of GAs in water resources planning and management can be found in Nicklow et al. (Citation2010) within which evolutionary algorithms (EAs), and GAs in particular, are found to be the most popular and successful optimisation method in urban drainage and sewer system applications. Examples include: optimisation of water quality and water treatment costs in a river basin (Cho, Seok Sung, and Ryong Citation2004), allocation of best management practices (Arabi, Govindaraju, and Hantush Citation2006; Perez-Pedini, Limbrunner, and Vogel Citation2005), positioning and sizing of detention tanks in UDS (Cimorelli et al. Citation2015) and stormwater detention systems in watersheds (Yeh and Labadie Citation1997). Vezzaro and Grum (Citation2014) utilized a GA to minimize the cost function of an RTC implemented in a urban drainage system, while Rauch and Harremoës (Citation1999) combined a GA with a model-predictive control system to minimize pollution from an urban wastewater network.
In such optimisation-based methods, the simulation runtime required by drainage models to run hydraulic analysis is by far the most time-consuming element and can limit the ability of a GA to find near-optimal solutions in a feasible time frame (Butler et al. Citation2018). Wang et al. (Citation2019) proposed an alternative approach when assessing a large number of potential solutions, resulting in a significant reduction of computational time compared to optimisation methods. In the framework outlined by Wang et al. (Citation2019), the best combination and placement of sustainable drainage systems (SuDS) devices in UDS are determined by random sampling of potential candidate locations. This approach can be potentially used to determine the best combination and location of FCDs within sewer networks and offers an alternative approach if computational time limits the implementation of optimisation algorithms. However, the efficiency and reliability of this method have not been directly tested against more conventional optimisation methods.
The main aim and novelty of this study is therefore to test a GA optimisation as well as a random sampling method, in combination with full hydrologic and hydraulic urban drainage network simulations, to find optimum combinations of FCD locations within a UDS. As far as the authors are aware, to date no existing methodologies to robustly optimise the deployment strategy for multiple FCD placement within a local RTC approach are to be found in the literature. A case study in the sewer network of Coimbra (Portugal) where locations of between 1 and 10 FCDs operated by the CENTAUR system were optimised. The single objective function to assess the different combinations of FCD locations in the case study is CSO spill volume reduction, and the procedure is repeated for different design storm events. Performance and computational demand of GA solutions are also compared to those found using the random sampling method proposed by Wang et al. (Citation2019).
Methodology
Case study network
The sewer network selected for this study is a subcatchment of the Zona Central Catchment (Coimbra, Portugal). It consists mostly of a combined sewer system, with a catchment area of 0.89 km2. The sewer network is simulated using an EPA Storm Water Management Model (SWMM) (Rossman Citation2015), and comprises 434 subcatchments, 536 manholes, 538 conduits and a single combined sewer overflow. Pipe diameters vary between 0.2 and 1.7 m, and pipe slopes vary between −0.51 and 2.26 m/m with 90% of the pipes between −0.08 and 0.22 m/m. SWMM is a dynamic rainfall-runoff and network hydraulic simulation model widely used in sewerage and stormwater management studies. Surface run-off routing is calculated by a nonlinear reservoir model, in which precipitation excess is converted into overland flow. The unsteady and non-uniform flow within the drainage system is computed solving the Saint-Venant equations (conservation of mass and momentum equations) via the dynamic wave approach (Rossman Citation2006). Several examples of optimisation problems in UDS performed with SWMM models can be found in the literature. They include flood mitigation (Newton et al. Citation2014), CSO spill volume reduction (Kroll et al. Citation2018), detention tanks (Tao et al. Citation2014; Cunha et al. Citation2016; Duan, Li, and Yan Citation2016; Wang, Sun, and Sweetapple Citation2017), low impact development (LID) practices (Baek et al. Citation2015; Eckart, McPhee, and Bolisetti Citation2018), best management practices (Oraei Zare, Saghafian, and Shamsai Citation2012; Karamouz and Nazif Citation2013) and water quality (Fu, Butler, and Khu Citation2008).
SWMM default functionalities (e.g. data analysis, RTC modelling) can be modified or extended by third-party add-ons, thanks to the open-source nature of the software. In this work, SWMM simulations are carried out by the interface MatSWMM (Riaño-Briceño et al. Citation2016) in the Matlab environment. MatSWMM is an open-source Matlab, Python, and LabVIEW-based software package. It can be used for designing and testing RTC systems in urban drainage networks and allows a flow control device to be operated by the CENTAUR control algorithm. Shepherd et al. (Citation2016) describe the methodology used to link an SWMM sewer network model with a Fuzzy Logic control algorithm through the MatSWMM interface in Matlab.
Identifying FCD locations
Flow control devices are designed as actuators comprised a controlled sluice gate coupled with an overflow weir and can be installed in pre-existing manholes within a UDS. In this study, the emergency overflow weir is designed to prevent flooding upstream of the FCD location during a 50-year return period storm, when the sluice gate is fully or partially closed. It also guarantees safety in case of failure of the system. More details of the system are described by Mounce et al. (Citation2020). The FCD operation is autonomous and locally handled by the CENTAUR control algorithm, measuring water level in the CSO chamber and immediately upstream of the FCD location. Sluice gates can work independently but hydraulically interact within the sewer network. FCD dimensions and properties are adapted for each location (manhole) and automatically added to the SWMM sewer network model by a Matlab tool developed for the current study. FCDs have a sluice gate diameter set equal to the downstream pipe diameter, to avoid restrictions in cross section. The sluice gate opening degree ranges between 0 (fully close) and 1 (fully open). The emergency overflow overtop weir is modelled as a rectangular opening at the top of the FCD.
A Matlab programme converts the sewer network model into tabular form. The network is thus represented as a collection of nodes (i.e. manholes) connected by links (i.e. pipes), and the potential FCD locations are determined by applying constraints to each node of the network. A manhole is considered a potential location for installation of the FCD if located upstream of the target location (CSO chamber), with one upstream entering pipe and one downstream exiting pipe. In the case study catchment, a total of 389 potential FCD locations are identified.
In-sewer storage capacity
To reduce the computational run time of optimisation, potential FCD locations are initially screened based on the assessment of available storage capacity. The in-sewer storage capacity activated by an FCD corresponds to the maximum stormwater volume that can be stored upstream of the actuator. Calculations are carried out for the 389 potential locations previously identified, with a procedure based on Leitão et al. (Citation2017). The in-sewer storage capacity mobilised by an FCD is approximated to the pipe volume upstream of the actuator location, under a reference level (m A.D.):
where is the ground-level elevation at the FCD location (m A.D.) and
is a safety margin (set equal to 0.1 m). Reference level RL matches the maximum static water level of the stormwater stored upstream to the FCD.
The computation starts at the FCD location, advances upstream identifying links connecting the nodes, and continues until the node invert is higher than the reference level , or the node has no upstream links. If upstream bifurcations are identified, the computation is carried out along each bifurcation branch until one of the previous conditions occurs, as suggested by Kroll et al. (Citation2018). A control location is excluded if the computation identifies nodes connected to pumps.
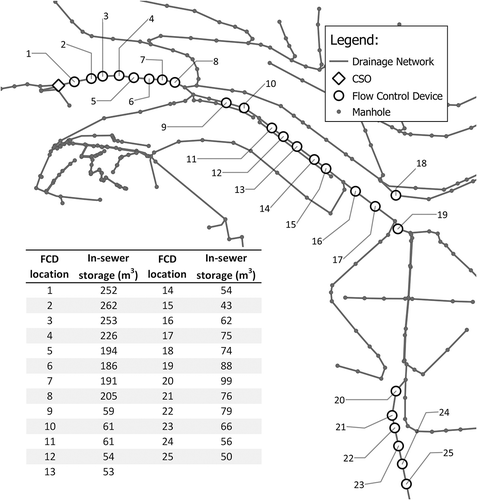
The analysis shows that the 389 potential control locations previously identified have static storage capacities ranging from 0.1 to 262 m3. A total of eight locations present storage volume between 186 and 262 m3 (all located along the same sewer branch immediately upstream to the CSO chamber), while 17 locations show in-sewer storage volume between 50 and 100 m3. Potential FCD locations which mobilise less than 50 m3 are judged highly unlikely to be optimal locations for FCDs and are hence removed from subsequent analysis. The number of control locations considered is thus reduced to 25 (see ).
Figure 1. In-sewer storage capacity at potential control locations
Genetic algorithm for optimising FCD placement schemes
In this study, a GA is used to minimize spill volumes discharged in the receiving waterbody during synthetic storm events based on different FCDs placement schemes. Spill volume reduction performed by FCDs is evaluated by linking the hydraulic analysis, carried out using SWMM, with a Matlab GA. The number of variables optimized by the GA is equal to the number of potential FCD locations considered within the sewer network. The implementation of a FCD in a given potential location (i.e. manhole) is represented by a binary 0/1 integer variable (0 = actuator not implemented, 1 = actuator implemented). A GA solution is therefore a sequence of 0/1 integer values and corresponds to a unique set of control locations within the network. Each FCD placement scheme is thus represented by the one-dimensional binary array: , where
represents the implementation of a FCD at the i-th potential location within the sewer network (0/1 integer variable), and
the total number of potential FCD locations considered. The population size is set equal to 100 per GA generation, and the actual number of FCDs implemented in each hydraulic simulation is forced by the linear equality constraint
number of FCDs implemented. Examples of 0/1 programming in GA, successfully implemented in stormwater and watershed management problems, can be found in Arabi, Govindaraju, and Hantush (Citation2006); Damodaram and Zechman (Citation2013); Limbrunner et al. (Citation2013); Perez-Pedini, Limbrunner, and Vogel (Citation2005); Shen, Chen, and Xu (Citation2013); and Srivastava et al. (Citation2002).
Optimisation is carried out for different design storm events and a given number of installed FCDs. Three synthetic design storms obtained by the alternating block method (Chow, Maidment, and Mays Citation1988) are selected to assess the capability of the local RTC system to minimize spill volumes. Storms are based on Portuguese IDF curves (RGSPPDADAR Citation1995), with return period equal to 1 year and duration of 15, 30 and 60 min, respectively (time of aggregation 5 min). After preliminary analysis of in-sewer storage capacity within sewer network, design events longer than 60-min duration generate runoff volumes considerably higher than the overall in-sewer capacity mobilised by any combination of the 25 potential FCD locations previously selected (). For storms with longer duration, as well as larger return period events, additional storage volume would need to be constructed for a local RTC system of this type to be effective. Time of concentration is calculated using synthetic storms with constant rainfall intensities (RGSPPDADAR Citation1995); it corresponds to the time interval between beginning of the rainfall event, and moment of constant discharge at the most downstream outlet within the network. The resulting time of concentration of the sewer network is approximated to 15 min for the 15-min storm, and 25 min for the 60-min storm. Spill volume reduction achieved by the local RTC system is quantified by comparing modelled stormwater volume discharged at CSO in the original network with no intervention (), with the stormwater volume discharged at the same location with FCDs implemented within the network. Placement of FCDs is optimised for the number of installed flow controllers ranging between 1 and 10, and for each storm event examined. Due to the limited number of possible FCD placement schemes in the case study site, all possible combinations of FCD locations are tested for schemes where the number of implemented FCDs is less than 3. When the number of FCDs ranges from 3 to 10, the placement is optimised by the GA.
Table 1. Design storm parameters (test storm events) and resulting modelled uncontrolled spill volume
Comparison of GA method with randomly sampled FCD placement schemes
Spill volume reductions achieved as well as computational time of GA solutions are compared with those obtained using the random sampling approach proposed by Wang et al. (Citation2019). Random sampling of FCD placement schemes is based on the degree of confidence, where every possible combination of FCD placement has the same probability of being selected. This method is used to test a large number of combinations with lower computational burden compared to the GA. For each number of FCDs tested in this study, combinations of control locations are randomly generated, and the performance (spill volume reduction) calculated through hydraulic analysis. The random sample size
is calculated as (Brase and Brase Citation2012)
where is the total number of possible FCDs placements in each sampling round,
is the success probability (0.5),
is the confidence interval (
and
is the normal distribution value (1.960 for confidence interval
).
Random sampling of control locations is carried out for different numbers of flow control devices. For each number of FCDs evaluated, 384 random FCD placement schemes are generated and tested (see EquationEquation 2)(2)
(2) . In cases where the total number of schemes is less than 384, all possible schemes are considered and tested. A total of 3397 combinations between number and location of FCDs are thus generated and tested with this approach.
Results and discussion
Solutions found by GA
FCD locations within sewer network
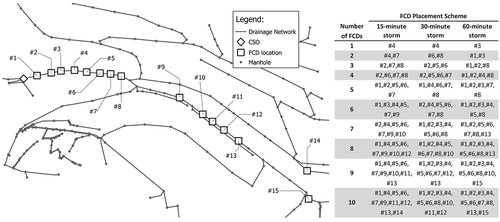
shows the installation locations of the FCDs as determined by the GA methodology for different numbers of FCDs within the sewer network. Optimal FCD placement schemes are found to be dependent on the storm event and the number of installed flow controllers. Results show that the GA generally favours manholes located near the target location (CSO). In case of 1 to 5 FCDs, GA solutions correspond to locations along the pipe-line immediately upstream of the target location for all storms considered, where devices mobilise a larger storage capacity compared to other potential FCD locations within the network. At these locations, flow control devices are capable of reacting quickly to changes in water depth at the target location and to reduce peak flows during storm events. When additional devices are deployed, FCDs are placed along one of the upstream pipes contributing to the target location. This results in a local RTC system composed of independent FCDs implemented in series, capable of quickly reacting to changes in water level at the target location and storing stormwater in different areas within the network. Control locations from #1 to #8 are selected more often than others in the optimised FCD placement schemes, while locations from #9 to #15 are only selected when the number of FCDs is between 6 and 10. Potential FCD locations in the most upstream area of the sewer network are never selected by GA (see ). While control locations in this area show storage capacity comparable to locations further downstream, the distance between CSO and FCDs affects the capability of the gates to quickly reduce flow at the target location before CSO spills occur.
Figure 2. FCD locations selected by the GA within sewer network model
Results on FCD locations obtained by the GA are in agreement with recommendations outlined by Sá Marques et al. (Citation2018), based on the implementation of a single FCD controlled by CENTAUR in a sewer network. In both studies, the dynamic control of water depth achieved by a flow control device is found more efficient when the target site is located close to the FCD location, and it decreases if additional flows are conveyed by other branches that contribute to the target location.
CSO spill volume reduction
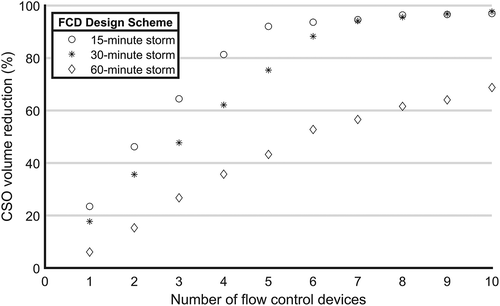
shows spill volumes relative to the baseline system with no FCDs (), for the three design storms tested. The overall spill volume reduction is progressively increased by implementing additional FCDs. Each point in represents the performance achieved by the RTC system, for the optimised FCD placement scheme for a given storm event. While a higher number of installed flow controllers corresponds to increasing spill volume reduction, the reduction associated with the implementation of additional FCDs declines with the numbers of devices implemented. Moreover, the effectiveness of the RTC system in controlling stormwater volumes depends heavily on the storm duration. The RTC system’s impact in reducing CSO spills decreases with increasing duration (and hence storm volume) entering the UDS. The RTC system is observed to have the highest efficiency for the 15-min storm, in which more than 90% of the original spill volume can be reduced by the use of 5 FCDs. During the 30-min storm, the same 90% efficiency is reached when deploying 7 FCDs. In the case of the 60-minute storm duration, a spill volume reduction of 70% is obtained by the RTC system using 10 flow controllers.
Figure 3. Performance of solutions found by GA, for different storm events and number of flow control devices
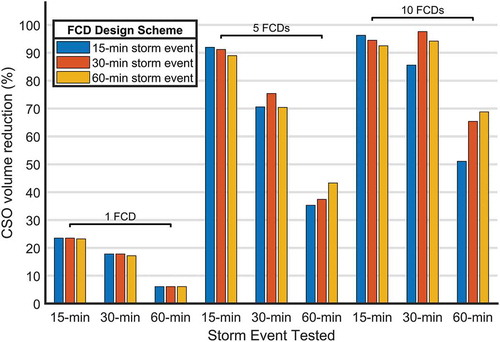
Solutions found by the GA were also tested under storm durations other than those used within the original optimisation. The purpose of this is to investigate the capability of a selected set of FCD locations to control stormwater volumes for a range of rainfall events, other than which this set was originally optimised for. Each set of FCD locations was originally optimised for either only the 15-, 30- or 60-min design event (). These optimised location arrangements are then tested against all three design storms in order to to assess the impact of the type of event. The resulting performance is compared in , for when the number of FCDs is 1, 5 and 10. For example, the scheme optimised for the 30-minute duration storm with 5 FCD locations can reduce the original spill volume by 75%, while the scheme with 5 FCD locations that was optimised for the 60- or 15-min storm results in a spill volume reduction of 70% for the 30-min storm. As expected, the GA solution performs best for the storm duration the scheme was optimised for, although the differences are relatively small, especially when only one FCD is implemented. The performance during other duration events is reduced by around 3–8% if five FCDs are implemented, and by around 3–18% if 10 FCDs are implemented. Results show that, for a given number of FCDs, similar overflow volume reduction is achieved by different optimised FCD placement schemes, giving alternate options in the choice of definitive placement of flow controllers. The selection of definitive placement of FCDs is expected to be function of operational targets (e.g. required spill volume or spill frequency reduction), efficiency (i.e. identifying the number of FCDs above which placement of additional FCDs does not activate considerable additional spare storage capacity), and other factors not considered in this study such as installation site accessibility, initial investment and operational costs.
Figure 4. Spill volume reduction achieved by FCD schemes optimised for a given design rainfall duration (FCD Design Scheme, denoted by different colours), when tested for other storm event durations (indicated on x-axis)
Comparison between optimisation-based and random sampling approaches
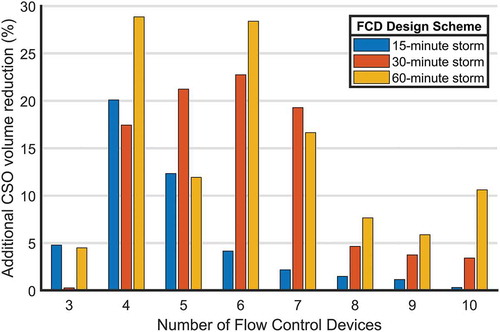
Performance of FCD placement schemes
For each number of installed FCDs and all storm events considered, maximum spill volume reduction obtained by the GA-based optimisation method is compared with the performance of solutions found by the randomly sampled approach. shows the additional CSO volume reduction achieved by the GA method relative to the random sampling approach for each placement scheme. As shown in , optimised FCD locations found by the GA-based method result in equal or higher spill volume reduction compared to those obtained from the randomly sampled methodology in all cases (systems limited to one or two FCDs not shown, as here all possible options were compared). FCD placement schemes found by the GA result in performance improvements between 1% and 29% compared to those found by the random sampling approach, with the largest performance improvements found for 30- and 60-minute storms with four to seven FCDs placed.
Figure 5. Percentage additional CSO spill volume reduction achieved by FCD placement schemes optimised using GA relative to schemes selected by random sampling method
Computational times for hydraulic FCDs location optimisation using GA or random sampling
Hydraulic simulations of the site resulted in run times between 20 and 60 s depending on the number of FCDs and storm event tested, allowing the analysis of a wide range of spill volume mitigation scenarios. The GA optimisation and SWMM simulations were run in parallel on two Windows10 computers with Intel E5-2637 processor and 32GB of RAM, and one Windows10 computer with Intel i5-7200 processor and 8GB of RAM. The computational time required by the GA to identify solutions ranged between 14 h and 3 days in each scenario considered. Hydraulic analysis of randomly sampled FCD schemes during three storms was carried out on a single machine, with total computational time of 4 days (Windows10 computer with Intel i5-7200 processor and 8GB of RAM).
The number of candidates tested by the GA is significantly higher than the 3397 randomly sampled FCD placement schemes. With a population of 100 solutions per generation, the optimisation-based framework resulted in a total of 80,200 SWMM hydraulic simulations. Computational time is a function of the number of potential FCD locations considered, number and level of complexity of hydraulic elements within the sewer network, and the machine’s computational power used to perform hydraulic analysis. If computational time might constitute a limiting factor, the number of hydraulic simulations may be reduced by limiting the number of storm events tested as in this case the optimum FCD locations showed fairly similar performance independent of the design event used during optimisation. However, this would warrant further testing for different case studies. A reduced number of potential FCD locations can significantly lower the total population of candidate solutions evaluated in the optimisation process. In this regard, a static or steady-state analysis of available in-sewer storage capacity suggested in the literature (Campisano, Schilling, and Modica Citation2000; Leitão et al. Citation2017; Philippon et al. Citation2015; Kroll et al. Citation2018) provides an efficient methodology to discard potential FCD locations which only have a small potential storage volume.
Conclusions
A novel GA-based optimisation framework has been developed to identify the optimal location of FCDs in urban drainage networks to reduce CSO spill volume based on an established local RTC system. Optimal FCD locations are obtained through hydraulic analysis rather than assessing the static storage volume potential within the network. This ensures that hydraulic interaction between FCDs and their impacts on flows and levels within the network are considered in the process.
In the case study, the flow controllers are all individually operated by the CENTAUR fuzzy logic algorithms. Results show that GA optimisation favours FCD locations close to the CSO, where flow controllers can mobilise large in-pipe volumes compared to other potential FCD locations further upstream. Moreover, the limited distance allows the devices to quickly react to changes in water level at the CSO location, and reduce the flow before the spill occurs. When selecting multiple FCD locations, the approach also favours locations quite close together, which in a location selection method based only on potential storage volume comparisons, would likely be discounted.
A better performance is achieved by the GA-based optimisation compared to a simpler random sampling optimisation approach. However, the computational time required to run hydraulic simulations is found to potentially limit the number of scenarios evaluated by the GA solver. In the case of large urban drainage systems, particular attention is needed when establishing the number of potential FCD locations and storm events evaluated in the optimisation, so that optimal FCD placement schemes can be found in a reasonable timeframe. For this, a simple static volume–based screening approach would be useful to discount locations with very limited storage volumes.
For the case study, optimal placement of FCDs proved robust and not overly sensitive to design storm duration used in the optimisation, although the sensitivity of the location selection for the design event does increase as more FCDs are added and solutions become more bespoke. The case study’'s results show how the local RTC system has the potential of preventing CSO spills for short and intense storms, and diminish total overflow discharged volumes during rainfall events with longer duration.
The proposed methodology can be used to select optimal installation strategies to fulfil different specific operational targets, such as spill volume or spill frequency reduction, and design flexible local RTC systems capable of controlling stormwater volumes under a wide range of storm events. It needs to be acknowledged that in practical applications, the final choice of FCD number and locations is expected to also be based on the cost–benefit analysis carried out during preliminary design of the RTC system. Factors such as initial investment and operational costs, installation site accessibility, road and traffic management might hinder or impede the installation of FCDs at locations identified as effective through hydraulic analysis. These issues could be identified prior to analysis in order to reduce the number of examined potential FCD locations and, thus, diminish the computational time required by the optimization procedure. This information, while not available in this study, may be included in future work to further enhance the applicability of the proposed methodology to other scenarios. In cases of scarce feasible installation sites, or inadequate reduction of overflow discharge volumes due to rainfall events of long duration or consecutive events, the overall performance could be increased by coupling the RTC system with other solutions to control run-off volumes, such as SuDS systems or storm tanks.
Acknowledgements
The authors would like to thank Águas de Coimbra for providing the sewer network used in this study. The authors also gratefully acknowledge the support from Dr Nuno Eduardo Simões (University of Coimbra) for providing the documentation of the sewer network model.
Disclosure statement
No potential conflict of interest was reported by the authors.
Additional information
Funding
Notes
1. Details on CENTAUR project available at: https://www.sheffield.ac.uk/centaur/home/outputs.
References
- Abdel-Aal, M., W. Shepherd, S. R. Mounce, S. Ostojin, A. Schellart, J. Shucksmith, P. J. Skipworth, and S. Tait. 2016. “Alleviating the Risk of Sewer Flooding Using Fuzzy Logic in a Real Time Control System – An Experimental Study.” In 8th International Conference on Sewer Processes and Networks. Rotterdam, The Netherlands.
- Arabi, M., R. S. Govindaraju, and M. M. Hantush. 2006. “Cost-Effective Allocation of Watershed Management Practices Using a Genetic Algorithm.” Water Resources Research 42: 10. doi:10.1029/2006WR004931.
- Baek, S. S., D. H. Choi, J. W. Jung, H. J. Lee, H. Lee, K. S. Yoon, and K. H. Cho. 2015. “Optimizing Low Impact Development (LID) for Stormwater Runoff Treatment in Urban Area, Korea: Experimental and Modeling Approach.” Water Research 86: 122–131. doi:10.1016/j.watres.2015.08.038.
- Berggren, K., M. Olofsson, M. Viklander, G. Svensson, and A. Gustafsson. 2012. “Hydraulic Impacts on Urban Drainage Systems Due to Changes in Rainfall Caused by Climatic Change.” Journal of Hydrologic Engineering 17 (1): 92–98. doi:10.1061/(ASCE)HE.1943-5584.0000406.
- Brase, C. H., and C. P. Brase. 2012. Chapter 7: Estimation in Understandable Statistics: Concepts and Methods. Tenth. ed. Boston, MA: Brooks/Cole, Cengage Learning.
- Butler, D., B. McEntee, C. Onof, and A. Hagger. 2007. “Sewer Storage Tank Performance under Climate Change.” Water Science and Technology 56 (12): 29–35. doi:10.2166/wst.2007.760.
- Butler, D., D. C. James, C. Makropoulos, and J. W. Davies. 2018. Urban Drainage. 4th ed. Boca Raton, FL: CRC Press LLC.
- Campisano, A., W. Schilling, and C. Modica. 2000. “Regulators’ Setup with Application to the Roma-Cecchignola Combined Sewer System.” Urban Water Journal 2 (3): 235–242. doi:10.1016/s1462-0758(00)00061-3.
- Carbone, M., G. Garofalo, and P. Piro. 2014. “Decentralized Real Time Control in Combined Sewer System by Using Smart Objects.” Procedia Engineering 473–478. https://doi.org/10.1016/j.proeng.2014.11.237
- Cho, J., K. Seok Sung, and S. Ryong. 2004. “A River Water Quality Management Model for Optimising Regional Wastewater Treatment Using A Genetic Algorithm.” Journal of Environmental Management 73 (3): 229–242. doi:10.1016/j.jenvman.2004.07.004.
- Chow, V. T., D. R. Maidment, and L. W. Mays. 1988. Applied Hydrology. New York: Mc Graw-Hill.
- Cimorelli, L., F. Morlando, L. Cozzolino, C. Covelli, R. Della Morte, and D. Pianese. 2015. “Optimal Positioning and Sizing of Detention Tanks within Urban Drainage Networks.” Journal of Irrigation and Drainage Engineering 142: 1. doi:10.1061/(ASCE)IR.1943-4774.0000927.
- Cunha, M. C., J. A. Zeferino, N. E. Simões, and J. G. Saldarriaga. 2016. “Optimal Location and Sizing of Storage Units in a Drainage System.” Environmental Modelling and Software 83: 155–166. doi:10.1016/j.envsoft.2016.05.015.
- Damodaram, C., and E. M. Zechman. 2013. “Simulation-Optimization Approach to Design Low Impact Development for Managing Peak Flow Alterations in Urbanizing Watersheds.” Journal of Water Resources Planning and Management 139 (3): 290–298. doi:10.1061/(ASCE)WR.1943-5452.0000251.
- Dirckx, G., M. Schütze, S. Kroll, C. H. Thoeye, G. De Gueldre, and B. Van De Steene. 2011. “Cost-Efficiency of RTC for CSO Impact Mitigation.” Urban Water Journal 8 (6): 367–377. doi:10.1080/1573062X.2011.630092.
- Duan, H. F., F. Li, and H. Yan. 2016. “Multi-Objective Optimal Design of Detention Tanks in the Urban Stormwater Drainage System: LID Implementation and Analysis.” Water Resources Management 30 (13): 4635–4648. doi:10.1007/s11269-016-1444-1.
- Eckart, K., Z. McPhee, and T. Bolisetti. 2018. “Multiobjective Optimization of Low Impact Development Stormwater Controls.” Journal of Hydrology 562: 564–576. doi:10.1016/j.jhydrol.2018.04.068.
- Fu, G., D. Butler, and S. T. Khu. 2008. “Multiple Objective Optimal Control of Integrated Urban Wastewater Systems.” Environmental Modelling and Software 23: 225–234.
- Fuchs, L., and T. Beeneken. 2005. “Development and Implementation of a Real Time Control Strategy for the Sewer System of the City of Vienna.” Water Science & Technology 52 (5): 187–194. doi:10.2166/wst.2005.0133.
- García, L., J. Barreiro-Gomez, E. Escobar, D. Téllez, N. Quijano, and C. Ocampo-Martinez. 2015. “Modeling and Real-Time Control of Urban Drainage Systems: A Review.” Advances in Water Resources 85: 120–132. doi:10.1016/j.advwatres.2015.08.007.
- Garofalo, G., A. Giordano, P. Piro, G. Spezzano, and A. Vinci. 2017. “A Distributed Real-Time Approach for Mitigating CSO and Flooding in Urban Drainage Systems.” Journal of Network and Computer Applications 78 (January): 30–42. doi:10.1016/j.jnca.2016.11.004.
- Grum, M., D. Thornberg, M. L. Christensen, S. A. Shididi, and C. Thirsing. 2011. “Full-Scale Real Time Control Demonstration Project in Copenhagen’s Largest Urban Drainage Catchments.” In 12th International Conference on Urban Drainage. Porto Alegre/Brazil.
- Karamouz, M., and S. Nazif. 2013. “Reliability-Based Flood Management in Urban Watersheds considering Climate Change Impacts.” Journal of Water Resources Planning and Management 139 (5): 520–533. doi:10.1061/(ASCE)WR.1943-5452.0000345.
- Kokash, N. 2005. “An Introduction to Heuristic Algorithms.” Department of Informatics and Telecommunications, University of Trento (Italy).
- Kroll, S., M. Weemaes, J. Van Impe, and P. Willems. 2018. “A Methodology for the Design of RTC Strategies for Combined Sewer Networks.” Water 10 (11): 1675. doi:10.3390/w10111675.
- Leitão, J. P., J. P. Carbajal, J. Rieckermann, N. E. Simões, A. Sá Marques, and L. M. de Sousa. 2017. “Identifying the Best Locations to Install Flow Control Devices in Sewer Networks to Enable In-Sewer Storage.” Journal of Hydrology 556: 371–383. doi:10.1016/j.jhydrol.2017.11.020.
- Limbrunner, J. F., R. M. Vogel, S. C. Chapra, and P. H. Kirshen. 2013. “Optimal Location of Sediment-Trapping Best Management Practices for Nonpoint Source Load Management.” Journal of Water Resources Planning and Management 139 (5): 478–485. doi:10.1061/(ASCE)WR.1943-5452.0000316.
- Lin, M., J. Tsai, and C. Yu. 2012. “A Review of Deterministic Optimization Methods in Engineering and Management.” Mathematical Problems in Engineering 2012: 1–15. doi:10.1155/2012/756023.
- Lund, N. S. V., A. K. V. Falk, M. Borup, H. Madsen, and P. S. Mikkelsen. 2018. “Model Predictive Control of Urban Drainage Systems: A Review and Perspective Towards Smart Real-Time Water Management.” Critical Reviews in Environmental Science and Technology 48 (3): 279–339. doi:10.1080/10643389.2018.1455484.
- Meneses, E. J., M. Gaussens, C. Jakobsen, P. S. Mikkelsen, M. Grum, and L. Vezzaro. 2018. “Coordinating Rule-Based and System-Wide Model Predictive Control Strategies to Reduce Storage Expansion of Combined Urban Drainage Systems: The Case Study of Lundtofte, Denmark.” Water 10 (1): 76. doi:10.3390/w10010076.
- Miller, J. D., and M. Hutchins. 2017. “The Impacts of Urbanisation and Climate Change on Urban Flooding and Urban Water Quality: A Review of the Evidence Concerning the United Kingdom.” Journal of Hydrology: Regional Studies 12: 345–362. doi:10.1016/j.ejrh.2017.06.006.
- Mounce, S. R., W. Shepherd, S. Ostojin, M. Abdel-Aal, A. N. A. Schellart, J. D. Shucksmith, and S. J. Tait. 2020. “Optimisation of a Fuzzy Logic-Based Local Real-Time Control System for Mitigation of Sewer Flooding Using Genetic Algorithms.” Journal of Hydroinformatics 22 (2): 281–295. doi:10.2166/hydro.2019.058.
- Muñoz, D. F., N. E. Simões, L. M. de Sousa, L. Maluf, A. Sá Marques, and J. P. Leitão. 2019. “Generalizing Multi-Reward Functions Aimed at Identifying the Best Locations to Install Flow Control Devices in Sewer Systems.” Urban Water Journal 16 (8): 564–574. doi:10.1080/1573062X.2019.1700284.
- Newton, C., D. Jarman, F. Memon, R. Andoh, and D. Butler. 2014. “Developing a Decision Support Tool for the Positioning and Sizing of Vortex Flow Controls in Existing Sewer Systems.” Procedia Engineering 70: 1231–1240. doi:10.1016/j.proeng.2014.02.136.
- Nicklow, J., P. Reed, D. Savic, T. Dessalegne, L. Harrell, A. Chan-Hilton, M. Karamouz, et al. 2010. “State of the Art for Genetic Algorithms and Beyond in Water Resources Planning and Management.” Journal of Water Resources Planning and Management 136 (4): 412–32. doi:10.1061/(asce)wr.1943–5452.0000053.
- Oraei Zare, S., B. Saghafian, and A. Shamsai. 2012. “Multi-Objective Optimization for Combined Quality-Quantity Urban Runoff Control.” Hydrology and Earth System Sciences 16: 4531–4542. doi:10.5194/hess-16-4531-2012.
- Ostojin, S., W. Shepherd, K. Williams, N. Simões, and J. Steinhardt. 2017. “CENTAUR: Smart Utilisation of Wastewater Storage Capacity to Prevent Flooding.” In CIWEM Urban Drainage Group Autumn Conference & Exhibition 2017, 1–8. Blackpool, UK.
- Perez-Pedini, C., J. F. Limbrunner, and R. M. Vogel. 2005. “Optimal Location of Infiltration-Based Best Management Practices for Storm Water Management.” Journal of Water Resources Planning and Management 131 (6): 441–448. doi:10.1061/(ASCE)0733-9496(2005)131:6(441).
- Philippon, V., M. Riechel, M. Stapf, H. Sonnenberg, M. Schütze, E. Pawlowsky-Reusing, and P. Rouault. 2015. “How to Find Suitable Locations for In-Sewer Storage? Test on a Combined Sewer Catchment in Berlin.” In 10th International Urban Drainage Modelling Conference, 295–298. Mont-Sainte-Anne, QC, Canada.
- Rauch, W., and P. Harremoës. 1999. “Genetic Algorithms in Real Time Control Applied to Minimize Transient Pollution from Urban Wastewater Systems.” Water Research 33 (5): 1265–1277.
- RGSPPDADAR. 1995. “Regulamento Geral De Sistemas Públicos E Prediais De Distribuição De Águas E De Drenagem De Águas.” decreto regulamentar no 23/95 de 23 de Agosto.
- Riaño-Briceño, G., J. Barreiro-Gomez, A. Ramirez-Jaime, N. Quijano, and C. Ocampo-Martinez. 2016. “MatSWMM - an Open-Source Toolbox for Designing Real-Time Control of Urban Drainage Systems.” Environmental Modelling and Software 83: 143–154. doi:10.1016/j.envsoft.2016.05.009.
- Rossman, L. A. 2006. “Storm Water Management Model, Quality Assurance Report: Dynamic Wave Flow Routing.” National Risk Management Research Laboratory, Office of Research and Development, US Environmental Protection Agency.
- Rossman, L. A. 2015. “Storm Water Management Model User’s Manual Version 5.1.” National Risk Management Research Laboratory, Office of Research and Development, US Environmental Protection Agency. https://www.epa.gov/water-research/storm-water-management-model-swmm
- Sá Marques, J. A. A., N. E. Simões, L. S. Maluf, and W. Shepherd. 2018. “Report on the Performance of the Pilot CENTAUR and Recommendations.” https://www.sheffield.ac.uk/polopoly_fs/1.779201!/file/D3.2_Report_on_Performance_of_CENTAUR_Pilot_v1.6_WithNotApprovedNote.pdf
- Schütze, M., A. Campisano, H. Colas, P. Vanrolleghem, and W. Schilling. 2003. “Real-Time Control of Urban Water Systems.” In International Conference on Pumps, Electromechanical Devices and Systems Applied to Urban Water Management. Valencia, Spain.
- Schütze, M., V. Erbe, U. Haas, M. Scheer, and M. Weyand. 2008. “Sewer System Real-Time Control Supported by the M180 Guideline Document.” Urban Water Journal 5 (1): 69–78. doi:10.1080/15730620701754376.
- Seggelke, K., R. Löwe, T. Beeneken, and L. Fuchs. 2013. “Implementation of an Integrated Real-Time Control System of Sewer System and Waste Water Treatment Plant in the City of Wilhelmshaven.” Urban Water Journal 10 (5): 330–341. doi:10.1080/1573062X.2013.820331.
- Shen, Z., L. Chen, and L. Xu. 2013. “A Topography Analysis Incorporated Optimization Method for the Selection and Placement of Best Management Practices.” PLoS ONE 8 (1): 1–12. doi:10.1371/journal.pone.0054520.
- Shepherd, W., S. Ostojin, S. Mounce, P. Skipworth, and S. Tait. 2016. “CENTAUR: Real Time Flow Control System for Flood Risk Reduction.” In CIWEM Urban Drainage Group Autumn Conference & Exhibition 2016. Blackpool, United Kingdom.
- Shepherd, W., S. R. Mounce, S. Ostojin, M. Abdel-Aal, A. Schellart, P. Skipworth, and S. Tait. 2017. “Optimising a Fuzzy Logic Real-Time Control System for Sewer Flooding Reduction Using a Genetic Algorithm.” In CCWI 2017 – Computing and Control for the Water Industry. Sheffield, United Kingdom.
- Shishegar, S., S. Duchesne, and G. Pelletier. 2018. “Optimization Methods Applied to Stormwater Management Problems: A Review.” Urban Water Journal 15 (3): 276–86. doi:10.1080/1573062X.2018.1439976.
- Simões, N., L. Girão, L. Maluf, W. Shepherd, S. Ostojin, A. Sá Marques, S. Mounce, P. Skipworth, S. Tait, and J. P. Leitão. 2018. “Real-Time CSO Spill Control Using Existing in-Sewer Storage.” In 11th Int. Conference on Urban Drainage Modelling. Palermo, Italy.
- Srivastava, P., J. M. Hamlett, P. D. Robillard, and R. L. Day. 2002. “Watershed Optimization of Best Management Practices Using AnnAGNPS and a Genetic Algorithm.” Water Resources Research 38 (3): 1–14. doi:10.1029/2001WR000365.
- Tao, T., J. Wang, K. Xin, and S. Li. 2014. “Multi-Objective Optimal Layout of Distributed Storm-Water Detention.” International Journal of Environmental Science and Technology 11 (5): 1473–1480. doi:10.1007/s13762-013-0330-0.
- Todeschini, S. 2012. “Trends in Long Daily Rainfall Series of Lombardia (Northern Italy) Affecting Urban Stormwater Control.” International Journal of Climatology 32 (6): 900–919. doi:10.1002/joc.2313.
- Vezzaro, L., and M. Grum. 2014. “A Generalised Dynamic Overflow Risk Assessment (DORA) for Real Time Control of Urban Drainage Systems.” Journal of Hydrology 515: 292–303. doi:10.1016/j.jhydrol.2014.05.019.
- Vitasovic, Z. C. 2006. Real Time Control of Urban Drainage Networks. Washington, DC: U.S. Environmental Protection Agency.
- Wang, M., Y. Sun, and C. Sweetapple. 2017. “Optimization of Storage Tank Locations in an Urban Stormwater Drainage System Using a Two-Stage Approach.” Journal of Environmental Management 204: 31–38. doi:10.1016/j.jenvman.2017.08.024.
- Wang, M., Y. Wang, X. Gao, and C. Sweetapple. 2019. “Combination and Placement of Sustainable Drainage System Devices Based on Zero-One Integer Programming and Schemes Sampling.” Journal of Environmental Management 238: 59–63. doi:10.1016/j.jenvman.2019.02.129.
- Yeh, C., and J. W. Labadie. 1997. “Multiobjective Watershed-Level Planning of Storm Water Detention Systems.” Journal of Water Resources Planning and Management 123 (6): 336–343.