
 ?Mathematical formulae have been encoded as MathML and are displayed in this HTML version using MathJax in order to improve their display. Uncheck the box to turn MathJax off. This feature requires Javascript. Click on a formula to zoom.
ABSTRACT
This paper describes the development and application of a simulation tool to assess the impact of water-efficient appliances and greywater recycling strategies on the domestic water consumption and wastewater generation profiles. Two time-series datasets of domestic water consumption in UK households – each consisting of more than 20,000 observations – were used to deduce water use appliance usage patterns as a function of water consumption per use for each water-use appliance and household characteristic (e.g. occupancy). The deduced trends were then used to develop a simulation tool that can generate water consumption and wastewater generation profiles reflecting user input for water use appliances and household characteristics. The inbuilt flexibility in the tool allows investigation of each water use appliance both individually and collectively, and facilitates informed decision-making for devising targeted retrofitting programmes. This research has application for water service provision and policy making globally, with potential impact on both water supply and wastewater management.
1. Introduction
Rapid urbanisation, population growth and economic development have overstretched existing urban infrastructure. This includes water and wastewater-related provisions as well as water supplies (Amit and Ramachandran Citation2013; Beck and Bernauer Citation2011; Fielding et al. Citation2013). Growing water consumption coupled with uncertainties associated with climate change (e.g. wetter winters and drier summers) particularly in water-stressed areas have triggered a shift in the way water is being managed (Gao et al. Citation2014; Miranda et al. Citation2011; Pachauri et al. Citation2014). More emphasis is now being placed on managing the demand rather than developing new reservoirs (as representing water supply) or water infrastructure expansion, which are inherently unsustainable and capital-intensive (Amit and Ramachandran Citation2013; Butler and Memon Citation2005; Manouseli, Kayaga, and Kalawsky Citation2017).
In many parts of the world, policies are being formulated to reduce per capita consumption and encourage water efficiency by different means, such as introducing water-saving devices. This is due to the fact that no policy will be successful if it is not implemented at the household level (Patwardhan and Vishwanath Citation2017). The World Bank reviewed water pricing policies in over 20 countries around the world and reported that domestic water consumption has an inverse relation with higher water pricing (Dinar and Subramanian Citation1997). Yang, Zhang, and Zehnder (Citation2003) assessed the effectiveness of water pricing in northern China and reported that pricing alone is not effective for water conservation unless a group of clearly defined and purposeful policies are integrated and implemented. A study with a focus on water pricing in Spain reported that people in areas which are considered as ‘water scarce’ pay more for their water bills. This, however, might be due to the fact that in some regions, desalination technologies, which are more expensive than the common treatment technologies, are applied for water treatment (Calatrava et al. Citation2015). Another study assessed household water consumption in Pune, India and suggested that water pricing (in addition to metering) could be effective but ‘it needs the companionship of awareness regarding water use’ (Patwardhan and Vishwanath Citation2017). Policies that promote Water Saving Appliances (WSAs) have a greater chance of being politically acceptable compared to pricing changes or water restrictions (Millock and Nauges Citation2010). Another project focused on a portal to provide online feedback to customers in Australia and reported that the active users of the online portal attained significant water-savings (Liu et al. Citation2017).
Some countries have implemented more comprehensive policies to rate and certify sustainable buildings across the country. In the United States and many other industrialised countries, policies are focused on public educational campaigns, use of utility water prices to incentivize conservation, investments in more efficient distribution infrastructure, and regulations on new residential development (Barnett et al. Citation2020; Liang, Henderson, and Kee Citation2018). In the UK, there is an effort to promote efficiency through regulation and intervention from water companies (Manouseli, Kayaga, and Kalawsky Citation2019). The UK aims to reduce domestic consumption of potable water through the installation and use of water-efficient appliances and fittings and water recycling, such as Greywater Recycling (GWR) systems (DCLG Citation2010). GWR is acknowledged as greatly beneficial for water resource efficiency and economic savings for households (Mandal et al. Citation2011), and is gaining attention around the world (Juan, Chen, and Lin Citation2016; Oron et al. Citation2014). Water efficiency measures have become a requirement for the majority of the UK water companies and are promoted by the water regulators such as Ofwat and the Environment Agency (Manouseli, Kayaga, and Kalawsky Citation2019, Citation2017). The reduction of domestic water consumption can also be achieved to a certain extent through users’ behaviour change (Meireles et al. Citation2018; Sadr et al. Citation2016). In other words, domestic water consumption and its patterns very much depend on the characteristics of the household, fixtures, appliances and equipment, and on the factors related to the user (Meireles et al. Citation2018; Sadr et al. Citation2016). However, effective policies and practical strategies require detailed data on how and where household water is used (Makki et al. Citation2013; Stewart et al. Citation2009).
Mass installation of water-efficient devices (i.e. WSAs) will alter existing hydraulic profiles of the potable distribution and wastewater collection networks. Such devices include duel-flush toilets, low-flow taps, efficient bathtubs, shower restrictors and efficient washing machines and dishwashers. Across 10 OECD (Organisation for Economic Cooperation and Development) countries in 2008, 52% of households had a water-efficient washing machine, 51% had low volume or duel-flush toilets, 54% had water flow restrictor taps/showerheads, and 17% had a water tank to collect rainwater (Millock and Nauges Citation2010). Wide variance is shown across countries, and only 8% of the sample owns all four of these WSAs.
Studying the use of such appliances can provide information to better manage urban water supply and network operations. It could also inform water companies and customers where and when domestic peak demand is, where water-saving efforts could be more effective, which water appliances would result in better water conservation, and which alternative water supply systems (e.g. GWR and rainwater harvesting) would be more effective for water conservation (Meireles et al. Citation2018; Morrison and Friedler Citation2015). Moreover, an efficient design of alternative water supply systems (onsite or decentralised) can be achieved when detailed information on household water use patterns and profiles are available (Campisano and Modica Citation2010; Morrison and Friedler Citation2015; Penn, Hadari, and Friedler Citation2012).
To the best of the authors’ knowledge, a limited number of models and tools have been developed to measure water use profiles of a large number of households using WSAs. According to Manouseli, Kayaga, and Kalawsky (Citation2017), these models are mainly reported in the Australian and the US literature, e.g. Makki et al. (Citation2013) and Willis et al. (Citation2013). As reported by Kofinas, Spyropoulou, and Laspidou (Citation2018), some existing models focused on whether domestic water consumption time series can be simulated in multiple temporal and spatial scales (Buchberger and Wu (Citation1995); Alvisi, Franchini, and Marinelli (Citation2003); Blokker, Vreeburg, and Van Dijk (Citation2010); Cominola et al. (Citation2016)).
This paper investigates the impact of water demand management measures (WSAs and GWR) on hydraulic profiles; this is achieved through the development and application of a simulation tool that uses water consumption data from two case studies in the UK. The key attributes of the database, the deduced consumption trends and the development, architecture, and application of the tool are described in the following sections. Section 2 outlines the simulation tool development. Section 3 describes the data used in this study along with the data source. Section 3 presents the results from different simulation runs using the tool and discusses the findings. Section 4 outlines the implications for this study on water management in the practitioner and policy context, and Section 5 summarises the main findings and contribution of this piece of research.
2. Methodology for the simulation tool development
2.1. Tool description
The aim of the simulation tool is to facilitate the generation of water consumption and wastewater discharge profiles and simulate the influence of water demand management measures for a range of development scales and compositions. The tool is capable of the following (i.e. objectives):
Evaluating potential water savings,
Estimating the impacts of particular water-efficient appliances for a given type of household on:
The total water consumption and wastewater discharge,
The diurnal variations of water consumption and wastewater discharge,
The make-up of water consumption.
Quantifying the production of greywater,
Assessing the modifications brought by GWR for a given type of household on:
The total water consumption and wastewater discharge,
The diurnal variations of water consumption and wastewater discharge,
The make-up of water consumption.
In order to achieve these objectives, the simulation tool relies on data of ‘typical’ water consumption and wastewater discharge in different types of households analysed in the study. The tool also applies the features of the household groups studied and assesses the different features of water consumption and wastewater discharge (e.g. total volumes, potential savings and their impact on diurnal variations).
2.2. Tool architecture
From the user point of view, such tools must be interactive, simple, and flexible (Porter Citation2018). The proposed tool is designed in a way that data entering (via the user interface) does not require any computing skills or previous knowledge on water demand management measures. In addition, the user is provided with examples of water-efficient appliances’ characteristics. The interface also enables the user to change various parameters describing the households and to run numerous simulations.
shows different components of the simulation tool and illustrates how results are obtained with the tool. Three different scenarios (namely, I. Scenario ‘Standard’; II. Scenario ‘Efficient’; and III. Scenario ‘Very Efficient’) have been defined and assessed in this study; the definition of each is provided in Section 2.2.3. As can be seen in , the results for Scenario ‘Standard’ rely only on information from the database (presented below) and the group of households, but the information for Scenario ‘Efficient’ come from the data from the small-scale database, the data from the group of households and information on water-efficient appliances. The results for Scenario ‘Very efficient’ are obtained using the same information as for Scenario ‘Efficient’ and the information on GWR systems.
Figure 1. Components and principle of the simulation tool
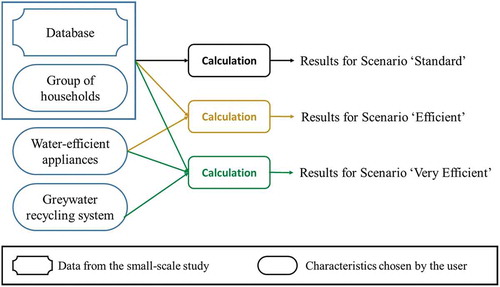
The tool consists of two Excel files: ‘WaterSaving.xls’ and ‘WaterRef.xls’. In the former, the user starts the simulation by filling in a form in the spreadsheet, called ‘Features’. They enter the characteristics of the households group studied. For each type of household, users should indicate the features of water-use appliances, bathing frequencies of the occupants and the size of a potential storage tank for water recycling. Calculations are then carried out automatically in the second Excel file. Results on water consumption, wastewater discharge and water recycling potentials appear on the first Excel file for the whole group of households and for each type of household. The tool architecture can be characterised by i. user interface (see the Supporting Information (SI), Section S10.1); ii. database (see Section S10.2 in the SI); and iii. calculation and simulation engine Section 2.2.1).
2.2.1. Calculation and simulation engine
This component contains the method used in the tool to calculate different features of water consumption and wastewater discharge listed in Table S7 in the SI. In order to assess the potential water savings from a group of households, we first introduced three different scenarios:
Scenario ‘Standard’: Characteristics of water consumption from appliances are exactly the same as in the small-scale survey. This case could also be called ‘business-as-usual’ and is considered as a reference (i.e. no consideration of water-saving appliances (WSAs) nor measures).
Scenario ‘Efficient’: Characteristics of water-efficient appliances are employed in the calculations.
Scenario ‘Very efficient’: Characteristics of water-efficient appliances are employed in the calculations and some wastewater is assumed to be recycled if a storage tank for wastewater is installed.
Different equations and calculation terms and functions are used for each scenario:
2.2.1.1. Standard scenario (baseline)
First, water consumption and wastewater discharge in Scenario ‘Standard’ are calculated for each appliance and occupancy level. Calculations for Scenario ‘Standard’ consist of multiplying the diurnal variations of water consumption and wastewater discharge from a given appliance ( expressed in l/10 min.household), extracted from the database, with the number of households in the group (n).
where denotes water consumption of the appliance i. The database of the simulation tool contains the variations of water consumption and wastewater discharge in l/10 min.household, for washing machines, dishwashers and taps. For toilets, showers and baths, these variations are in uses/10 min.household. To obtain the variations in l/10 min.household, the variations in uses/10 min.household (
) were multiplied by the average water consumption of the appliance use (
) e.g. 9.7 l for a toilet flush and 68 l for a bath.
The diurnal variations of total water consumption and wastewater discharge (f_T) are obtained by summing up the corresponding variations from all the appliances (EquationEquation 3(3)
(3) ).
2.2.1.2. Efficient scenario
Calculations for toilets and baths in Scenario ‘Efficient’ rely on the same principle as in Scenario ‘Standard’. These calculations consist of multiplying the diurnal variations of water consumption and wastewater discharge from the appliances (expressed in uses/10 min.household), extracted from the database, with the number of households in the group and the efficient water consumption of the appliance use provided by the user (in l/use). For showers, since information on water-efficient showers are given for flow rates (in l/min), an efficiency coefficient is defined as (EquationEquation 4(4)
(4) ):
This efficiency coefficient is then multiplied by the standard water consumption per use for a shower and the result is the efficient water consumption per use of a shower (in l/use). Then, the calculations of water consumption and wastewater discharge for showers consist of multiplying the diurnal variations of water consumption and wastewater discharge from showers (expressed in uses/10 min.household), extracted from the database, with the number of households in the group and the efficient water consumption of the appliance use.
Washing machines and dishwashers present a relationship between use and water consumption/wastewater discharge different from that of toilets and baths. A use of washing machine and dishwasher results in water consumption and wastewater discharge over a period that is much longer than 10 minutes. Then, water consumption and wastewater discharge from washing machines and dishwashers do not happen in a single 10-minute slot, contrary to water consumption and wastewater discharge from toilets and baths. Therefore, variations in volumes of water consumption and wastewater discharge from washing machines and dishwashers are not proportional to those in uses (See the SI, Section S3, Figures S6 to S9).
The variations of water consumption and wastewater discharge from washing machines and dishwashers in Scenario ‘Efficient’ were then considered based on the variations in volumes of water consumption and wastewater discharge, derived from the small-scale study (expressed in L/10 min.household). A proportionality coefficient, called efficiency coefficient, was defined to link variations of water consumption and wastewater discharge from the appliances of the small-scale survey and in Scenario ‘Efficient’. This coefficient is based on the efficient water consumption per use (in l/use) provided by the user and on the standard water consumption per use (in l/use) derived from the small-scale survey. For example, if water-efficient washing machines consume 42 l per use, the corresponding efficiency coefficient is 42/57.7 ≈ 0.73, since washing machines in the small-scale survey consumed 57.7 l per use on average.
In Scenario ‘Efficient’, the calculations for washing machines and dishwashers then consist of multiplying the diurnal variations of water consumption and wastewater discharge from these appliances (expressed in l/10 min.household), extracted from the database, with the number of households in the group and the efficiency coefficient (in l/l), similar to those of the Efficient Scenario. Contrary to toilet, shower and bath uses, those of taps present significant variations in volumes per use for a given person. For example, a wash-up generally requires more water than a quick hand wash. Therefore, variations in volumes of water consumption and wastewater discharge from taps are not proportional to those from toilet, shower and bath.
The variations of water consumption and wastewater discharge from taps in Scenario ‘Efficient’ were calculated following the same principle as for those concerning washing machines and dishwashers. For taps, the efficiency coefficient was defined based on the efficient flow rate (in l/min) provided by the user and on the standard flow rate (in l/min) derived from the small-scale survey (see EquationEquation 4(4)
(4) ). In this scenario, the calculations for taps consist of multiplying the diurnal variations of water consumption and wastewater discharge from these appliances (expressed in l/10 min.household), extracted from the database, with the number of households in the group and the efficiency coefficient, again similar to those described for the Standard Scenario.
2.2.1.3. Very efficient scenario
In Scenario ‘Very efficient’, both WSAs (similar to the appliances in Scenario ‘Efficient’) and GWR were considered. Wastewater from showers, baths and hand basins contributes towards greywater. Therefore, the diurnal variations of wastewater discharge from toilets, sinks, washing machines, and dishwashers, in this scenario, are the same as in Scenario ‘Efficient’ (see Table S5, in the SI). In this study, four sizes of greywater storage were chosen (with capacities of 10, 50, 100 and 150 litres). It is important to determine when the chosen storage tank is full. This situation leads to wastewater discharge from showers, baths and/or hand basins and could be considered as a wastewater discharge from ‘overflow’. The diurnal variations of wastewater discharge are then obtained by adding those from toilets, sinks, washing machines, and dishwashers and those from tank overflowing.
In Scenario ‘Very efficient’, greywater is considered to flush toilets whenever possible, leading to a reduction in mains water consumption from toilets. From the results on water consumption in the scenarios ‘Standard’ and ‘Efficient’, volumes of greywater production are determined. If the user has provided storage capacity for water recycling, the impacts of greywater use on water consumption and wastewater discharge are estimated, from the results on water consumption in Scenario ‘Efficient’. Recycling greywater implies that wastewater from showers, baths and hand basins is stored in a tank, as long as it is not full, instead of flowing into the sewer. This has therefore an effect on the diurnal variations of wastewater discharge.
Most of the diurnal variations of water consumption and wastewater discharge for each appliance in Scenario ‘Very efficient’ were already estimated, since they are the same as in Scenario ‘Efficient’ (see Table S5, in the SI). For example, the diurnal variations of water consumption from the appliances are the same, except for toilets. Mains water could be consumed by toilets when there is a shortage of greywater. The diurnal variations of this water consumption for ‘top-up are then added with those from the appliances (but toilets) to determine the diurnal variations of water consumption in Scenario ‘Very efficient’. The determination of the ‘different terms’ shown in requires dynamic calculations as described below:
Table 1. Calculation of greywater stored in the storage tank, the flow of water consumption and wastewater discharge
In order to determine water consumption and wastewater discharge in Scenario ‘Very efficient’, three elements should be considered: (i) number of times toilets are uses throughout the day; (ii) variations of wastewater discharge from hand basins, showers and baths; and (iii) the capacity of the greywater storage tank. The diurnal variations of water consumption from toilets obtained from the small-scale survey are averages from the whole group of the households and the survey duration. For example, these variations may encompass 0.15 uses/10 min.person between 10:00 and 10:10 hours. The variations do not show directly when uses of toilets happened throughout the day. Summing up frequencies of toilets uses for consecutive 10-minute slots enabled to determine during which time interval an average toilet use is likely to happen. The variations of wastewater discharge from hand basins, showers and baths are derived from the small-scale survey. The capacity of the greywater storage tank is provided by the user.
The amount of greywater stored in the tank is determined based on the following assumptions: (i) the amount of greywater decreases if toilets are used (if the tank is not empty) or remains constant (if the tank is empty); (ii) it increases if hand basins, showers or/and baths are used (if the tank is not full) or remains constant (if the tank is full).
The data derived from the small-scale study are given for 10-minute periods. The calculation method proposed is iterative and requires considering uses of hand basins, showers and baths and uses of toilets successively. Therefore, 10-minute slots are virtually divided into 2 sub-periods: (I) wastewater discharge from hand basins, showers and baths is assumed to occur during the first sub-period; and (II) water consumption from toilets is assumed to take place during the second sub-period.
Here, we have defined a number of variables to describe the amount of water consumption and wastewater discharge flows involved in the dynamic calculations specific to Scenario ‘Very efficient’ (See for the definition/description of each variable) during the 10-minute slot number n).
summarises the rules and equations defined to calculate the amount of greywater stored in the tank and the flows of water consumption and wastewater discharge specific to Scenario ‘Very efficient’ during the period n. For calculation purposes, the amount of greywater stored at the beginning of the day was fixed to 0. If the amount of greywater stored and the wastewater discharged from hand basins, showers and baths is less than the maximal amount of greywater that can be stored in the storage tank, the overflow is null; and then the amount of greywater stored is increased by the amount of wastewater discharged from hand basins, showers and baths. However, if part of the wastewater (discharged from hand basins, showers and baths) goes to the sewer, and if the overflow amount corresponds to the amount of maximal capacity of the storage tank subtracted from the amount of greywater stored (increased by the amount of wastewater discharged from hand basins, showers and baths), the amount of greywater stored is the maximal capacity of the storage tank (see ).
3. Water consumption data
The data used in this study were obtained from a large-scale survey conducted by the Water Research centre (WRc) that was designed to investigate water consumption trends in different parts of the UK. The data collection procedure involved installation of a water consumption monitoring system outside each participating household in the survey. The system comprises a flow meter and data logger capable of recording every 10 ml of water used at 1 s intervals for periods up to 2 weeks.
The consumption data collected in loggers was processed using a WRc software called Identiflow® (WRc, Citation2005). Identiflow® is a cost-effective program for identifying and measuring the domestic water consumption components from water consumption time series data (Nguyen, Zhang, and Stewart Citation2013). It identifies flow characteristics and classifies water-use events, which can be the use of toilets, showers, baths, internal and external taps, washing machines, dishwashers, and water softeners. Interactive facilities are provided for the experienced user to review and refine the analysis. This piece of software is based on a decision tree approach taking into account a number factors such as flow rate and duration of appliance recognition process (Kowalski and Marshallsay Citation2003; Vitter and Webber Citation2018). A number of sanity tests have shown that Identiflow® can identify up to 90% of events correctly. Nguyen, Zhang, and Stewart (Citation2013) undertook a test on 3870 events and reported around 75% accuracy in terms of the correctly classified volume. The output then can be used to investigate consumption variation as a function of household type, occupancy and time/date. The information on the data characteristics is provided in the SI, Section S11.
4. Results and discussion
In order to assess the potential water saving from a group of households, we have proposed three scenarios in the simulation tool: (I) Scenario ‘Standard’; (II) Scenario ‘Efficient’; and (III) Scenario ‘Very efficient’ (see Section 2.2.3 for the description of each scenario). The tool allows the assessment of potential water savings in an unlimited number of households’ distribution. It also helps investigate the reduction in water consumption, resulting from the installation of a given type of water use/saving appliances (or the combination of several appliances) and grey water recycling systems. In this study, the influence of installation of WSAs and/or GWR systems (when using different sizes of GWR storage tanks) is investigated:
4.1. Influence of water-saving appliances on water consumption
A theoretical case study has been used as an example for illustrating how the tool could be applied for estimating potential water savings. The impact of the replacement of each appliance by a water-efficient appliance was investigated in 400 households (100 households for each occupancy level). The following standard values of water consumption (or flow rate) per water use appliance were used in this section: toilets (9.7 litres per use), baths (76.7 litres), washing machines (57.7 litres per cycle), and dishwashers (16.8 litres per cycle), showers (4.2 litres per minute) and taps (7.4 litres per minute). In this section, for Scenario ‘Very efficient’, the capacity of the greywater storage tank is assumed to be 50 litres (i.e. medium tanks). The influence of installing different WSAs on household water consumption is discussed below. shows water savings as a result of the installation of different water use (saving) appliances.
Table 2. Water savings resulting from the installation of different water use (saving) appliances in the Scenario ‘Efficient’
4.1.1. Dual-flush toilets
These toilets (see the details on this appliance in the SI, Section S1.1) consume 3.6 l/use on average. The other appliances in the households are kept the same as in the small-scale study. presents the savings pertaining to the installation of dual-flush toilets. In the whole group (i.e. including 1-occupant, 2-occupant, 3-occupant and 4-occupant households), 28.3 m3/day could be saved, which corresponds to 28.3 l/person.day. 4-occupant households present the highest water savings, with 9.6 m3/day, followed by the 2-occupant household group, with 8.0 m3/day. Therefore, these two groups should be targeted first for toilet retrofitting (see also Figure S18 in the SI). The other types of households also present a significant water reduction (above 20%), showing that the installation of dual-flush toilets has a strong impact on water consumption.
shows the diurnal of water consumption for the whole group according to 3 scenarios for the installation of different appliances. ) illustrates the water consumption for the whole group when dual-flush toilets are installed. In this figure, it is shown that water consumption in Scenario ‘Efficient’ is always lower than that in Scenario ‘Standard’, and water consumption in Scenario ‘very efficient’ is (almost) always the lowest, as it is the only scenario with GWR systems. It is also shown that the peak morning shown in Scenario ‘Standard’ is fairly reduced in the other two scenarios.
Figure 2. Diurnal variations of water consumption for the whole group when the following WSAs are installed: (a) dual-flush toilets; (b) low-flow taps; (c) water-efficient baths; (d) shower restrictors; (e) water-efficient washing machines; and (f) water-efficient dishwashers
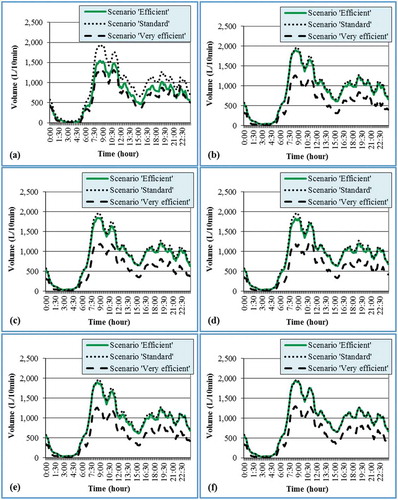
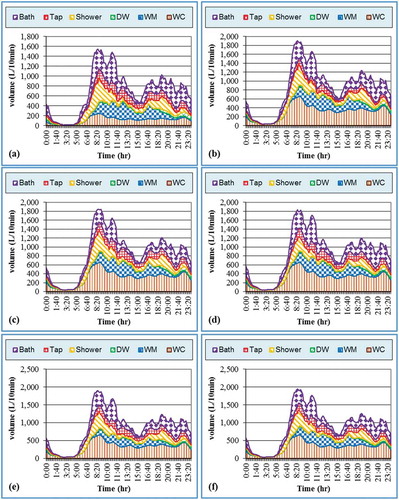
illustrates household water consumption breakdown based on different water use appliances in Scenario ‘Efficient’ for the whole group. It is noteworthy that very similar patterns of water use can be seen in this study even when different WSAs are installed (see both ). The dissimilarities in the water profiles (i.e. volume of consumed water in different times throughout the day) shown in emanates from the type of fittings installed in each household.
Figure 3. Water consumption breakdown based on different water use appliances in Scenario ‘Efficient’ for the whole group when the following WSAs are installed: (a) dual-flush toilets; (b) low-flow taps; (c) water-efficient baths; (d) shower restrictors; (e) water-efficient washing machines; and (f) water-efficient dishwashers
4.1.2. Installation of low-flow taps
Low-flow taps can reduce flow rates up to 60–70% compared to conventional taps, from 9.6 l/min down to 3.6 l/min (EA Citation1999). To quantify water savings resulting from the installation of low-flow taps, all the other appliances present the same characteristics as in the small-scale survey. The taps installed in the households of this study, also presented a flow rate of 3.6 l/min. As shown in , installation of low-flow taps led to save 5.2 m3/d of water across the 400 households. This measure has a much smaller impact than the installation of dual-flush toilets, and the diurnal variations of water consumption in the scenarios ‘Standard’ and ‘Efficient’ are similar (see ) and Figure S7 in the SI). This can also be seen in the results showing the diurnal variations of wastewater discharge when low-flow taps were installed (see Figure S13). The best rates of water reduction are achieved in the 4-occupant household group, followed by the 3-occupant household group (see also Figure S19 in the SI). These two groups also achieved the highest water reduction compared to that in the other occupancy groups. Therefore, they should be first targeted for the installation of low-flow taps. Comparing ), illustrating the water consumption breakdown when water-efficient taps are applied, with the other parts of , it can be seen that the area in red (representing water consumption in hand wash basin) in ) is much smaller than those in (ac–f),).
4.1.3. Water-efficient baths
Bath volumes were found to be around 80 litres on average in the small-scale survey. The assumption made in this section is that the volume of water-efficient bathtubs is 60 litres and no other water-efficient appliance installed in the households studied. and Figure S20 show the results of the simulations with these parameters. Water savings from the whole group are broadly comparable with those resulting from the installation of low-flow taps, representing 5% of the total water consumption. 1-occupant households present the highest rate of reduction, with about 8% and the highest water savings, with 1.7 m3/day.
As mentioned earlier, 4-occupant households present the highest water savings (see ). Therefore, the groups of 1-occupant and 4-occupant households should be first targeted for the installation of water-efficient bathtubs. ) show how the installation of water-efficient bathtubs influences the diurnal variations of water consumption in the whole group. The diurnal variations of water consumption in the groups of 1 occupant, 2 occupants, 3 occupants and 4 occupants are illustrated in the SI, Figure S8. The results also show that peaks of wastewater discharge are slightly lower in Scenario ‘Efficient’ when water-efficient bathtubs are installed and, as expected, it is significantly lower in Scenario ‘Very Efficient’ due to the installation of grey water recycling systems (see Figure S14).
4.1.4. Installation of shower restrictors
Shower restrictors and/or water-efficient showerheads can halve the volume of water used per shower by reducing flow rates (EA Citation2007). Fyfe et al. (Citation2009) and Turner et al. (Citation2010), in Australian case studies, reported that water-efficient showerheads can result in water savings ranging from (approximately) 8.0 to 12.5 m3/household/year. In this study it is assumed that shower restrictors/water-efficient showerheads, installed in the households studied, reduced the flow rate from 4.2 l/min down to 3 l/min. Any further reduction may negatively influence showering experience (Alkhaddar et al. Citation2007; Critchley and Phipps Citation2007). The characteristics of the other appliances remain the same as in the small-scale study. Results of this simulation are summarised in . The total water savings resulting from the installation of shower restrictors/water-efficient showerheads in the Scenario ‘Efficient’ are very close to those resulting from the installation of low-flow taps, which is about 4% of the total water consumption. The 3-occupant household group, with 1.9 m3/day and a reduction of 5.6% in water consumption, achieved the highest reduction in water consumption; therefore, this group can potentially benefit more from any shower retrofitting programmes. (see also Figure S21, in the SI).
The peaks of water consumption and wastewater discharge are similar (to a certain extent) in Scenarios ‘Standard’ and ‘Efficient’ when shower restrictors were installed, but, again both water consumption and wastewater discharge in Scenario ‘Very Efficient’ were considerably lower compared to those in the other two scenarios (see ) and Figures S9 and S15 in the SI).
4.1.5. Water-efficient washing machines
Water-efficient washing machines, consuming 42 litres per use, are assumed to replace the standard ones (consuming about 60 l/use). The other appliances remain the same as in the small-scale survey. The results showed that 4.8 m3/day could be saved if water-efficient washing machines are installed (). This corresponds to 3.7% of the total water consumption. The 1-occupant household group achieves the highest rate of water reduction, and the 4-occupant household group presents the highest water savings. This also can be seen in the results shown in Figures S10 and S16. Given the results on water savings, it can be recommended to first target households of higher occupancy for the installation of water-efficient washing machines. This is also consistent with the results shown in Figure S22, which illustrates the water consumption break-down based on different water use appliances in Scenario ‘Efficient’ when water-efficient washing machines (only) are installed in households of different numbers of occupants.
) and Figure S16 in the SI illustrated the diurnal variations of water consumption and wastewater discharge, respectively, for the whole group when water-efficient washing machines are installed. Both figures showed that the water consumption and wastewater discharge in Scenario ‘Standard’ is slightly higher than that in Scenario ‘Efficient’.
4.1.6. Water-efficient dishwashers
In the small-scale survey, none of the 1-occupant households owned a dishwasher, therefore, the impact of the installation of water-efficient dishwashers (13 l/use) will therefore be investigated in households with more than 2 occupants. For the large-scale survey, the water savings from the installation of dishwashers are the lowest compared to those resulting from the installation of the other water-efficient appliances (see ). This accords with the results shown in and Figures S17 and S23 in the SI. For each occupancy level, the reduction in water consumption is 0.7%, and the total reduction in water consumption is 0.6%, since no reduction is achieved in 1-occupant households. The household groups owning dishwashers present broadly comparable water savings.
4.2. Influence of WSAs and GWR on household water consumption
GWR has proven to be a suitable and viable alternative to the mains water for non-potable applications e.g. toilet flushing (Ghisi and Ferreira Citation2007; Leong, Chong, and Poh Citation2018; Oh et al. Citation2018; Penn, Hadari, and Friedler Citation2012). Greywater can even represent as high as 70% of the total household wastewater volume (Oh et al. Citation2018). In this study, the impact of application of GWR on household water consumption was assessed by carrying out simulations for different sizes of GWR storage tanks and with/without WSAs: (I) only GWR (tank capacity: 10 l); (II) only GWR (tank capacity: 50 l); (III) only GWR (tank capacity: 100 l); (IV) only GWR (tank capacity: 150 l); and (V) GWR (tank capacity: 100 l) and all WSAs. The information on the WSAs for assumptions I, II, III and IV are the same as those in the small-scale study. However, for Assumption V, it is assumed that all water use appliances are replaced with WSAs, and GWR systems are installed, each with a tank with a capacity of 100 litres. The results for all the 5 simulations are presented in and .
Table 3. Water savings resulting from the installation of GWR systems with different sizes of storage tanks
Figure 4. Diurnal variations of water consumption for the whole group with: (a) no GWR nor WSDs; (b) only GWR (tank capacity: 10 l); (c) only GWR (tank capacity: 50 l); (d) only GWR (tank capacity: 100 l); (e) only GWR (tank capacity: 150 l); and (f) GWR (tank capacity: 100 l and all WSAs)
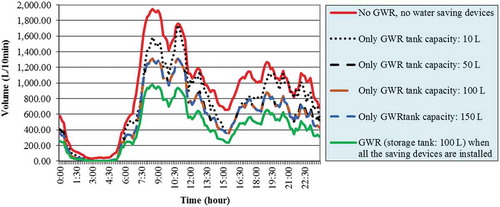
The capacity of 10 litres is very small, but it corresponds to greywater storage for one flush of standard toilets. As expected, the installation of 10-litre greywater storage tank yields less water savings. However, the water savings are quite significant, since they represent about 20–25% of the total water consumption. This result could also be explained by the specific pattern of toilet usage in the small-scale study. The results from the installation of greywater storage tanks of 100 litres and 150 litres yielded the same water savings. and show the results concerning water savings in households with 1 to 4 occupants; since the average water consumption in our study is between 120 and 130 litres/person-day. Storage tanks of 100 L will never be full. Therefore, the installation of storage tanks with a capacity of 150 litres is unnecessary, unless the number of occupants and/or the per capita consumption were to increase.
The water saving of greywater storage tanks of 100 litres and 150 litres were marginally higher than water savings when a storage tank of 50 litres was installed for each occupancy level. This supports the findings reported by Dixon, Butler, and Fewkes (Citation1999) indicating that greywater storage tank of 50 litres could achieve substantial water savings. The result from the simulations is quite surprising and may be specific to the pattern of toilet usage throughout the day, derived from the small-scale study. Toilet uses are spread over the day, and greywater storage tank can re-fill with wastewater from taps, baths, and showers between toilet uses. The results also showed that 2-occupant households present the highest rate of water reduction of about 31% when a 50-litre greywater storage tank is installed (see Figures S24, S25, S26, and S27 in the SI).
5. Implications/discussions
The greater understanding from this study of the application of WSAs and GWR in households is timely considering the fact that over four billion people face severe water scarcity at least one month per year (Mekonnen and Hoekstra Citation2016). There is increasing pressure for society to move towards more sustainable and efficient consumption, in particular household water consumption (Lowe, Lynch, and Lowe Citation2015). WSAs and alternative water supply systems such as GWR included in this study are key for effective urban water demand management which can reduce the threat posed by water scarcity on human health and the environment (Lee, Tansel, and Balbin Citation2013; Mekonnen and Hoekstra Citation2016; Rahim et al. Citation2019; Sadr et al. Citation2016; Sauri Citation2019; Shan et al. Citation2015). The tool presented here, and associated data analysis, has general global applicability across different settings. The profile of water use appliances and numbers of occupancy does not vary drastically between countries. The study therefore has global relevance, perhaps particularly in countries experiencing more acute need for water demand management. For instance, Australia is the world leader in non-pricing household water efficiency programs due to its water scarcity situation (Lindsay, Dean, and Supski Citation2017). Furthermore, accurate and precise water use measurements of individual household appliances are becoming more common across the world, as seen with the onset of smart metering. This will allow for a more honed understanding of water-saving potential from different WSAs and GWR technologies, and be able to add empirical, disaggregated findings to the predictive model presented here.
A major research focus has been on water quality of greywater (Oteng-Peprah, Acheampong, and deVries Citation2018), and so the present study’s focus on water efficiency and reuse helps build a broader understanding of its implementation. An enhanced understanding of potential water saving using this tool will allow planners to reduce risks associated with the implementation and operation of GWR technologies (particularly technological, construction, design and demand risks), which in turn and over time could aid reduction in social, political and regulator risk. Additionally alternative water supply systems such as GWR and Rainwater Harvesting (RWH) are widely accepted management interventions across the world for flood mitigation and long term management of the integrated urban wastewater system (Casal-Campos et al. Citation2018, Citation2015; Sadr et al. Citation2020; Warner, Lewis, and Tzilivakis Citation2019), meaning the tool developed could find further application for integration with flood planning. RWH has high potential for reducing the frequency and volume of run-off into streams (Burns et al. Citation2015). Rainwater harvesting is cheaper than larger-scale stormwater harvesting, where the costs are distributed amongst households, however it can only harvest rainfall from rooftops rather than larger urban catchments (Philip et al. Citation2008). Rainwater harvesting can therefore supplement WSAs and GWR in both the management of demand and drainage. One study of a larger-scale rainwater harvesting system in an office building in the UK measured average an water-saving efficiency of 87% across an 8-month period (Ward et al. Citation2012). In England where the risk of flooding is increasing, such wastewater management is of great importance. Combining this with supply management in a systemic sense would lead to more effective outcomes.
The greatest potential for reduced demand is across the demand peak in the morning, as shown in . Peak water use puts the greatest demand on supply and on wastewater infrastructure. Therefore, a combination of all of the above measures that can reduce water consumption in households would benefit water management regarding both supply and drainage. Millock and Nauges (Citation2010) showed a positive effect of household income (and household ownership) against the probability of WSA installation. If this trend is general, then this tool could be used in conjunction with analysis based on income for more targeted planning of WSA installation. Dieu-Hang et al. (Citation2017) and Millock and Nauges (Citation2010) demonstrated across OECD countries that pricing policies (i.e. volumetric pricing) and labelling campaigns on products are linked to an increase in probability of households investing in certain WSAs. Additionally, shifting social norms and greater environmental awareness amongst users is associated with investing in WSAs. This suggests that as attitudes change in coming years (e.g. Dean, Fielding, and Newton (Citation2016)), the application of this study for planning for water-saving increases in relevance. However, another study has found elsewhere that environmental concern plays a smaller role (e.g. Pérez-Urdiales and García-Valiñas (Citation2016)). These researchers find that household’s concern varies between type of WSA, and those with specifically electrical WSA (such as efficient dishwashers) are more likely to practice water conservation habits compared to households with non-electrical WSA (such as flow control taps).
In conjunction with such attitudinal shifts, it is important to aim to achieve behavioural changes alongside hardware changes. Linear, technical initiatives are unlikely to have lasting impact alone. Inskeep and Attari (Citation2014) ascribed efficient devices/technologies as having the greatest potential for water reduction (45.1%), while water conservation habits have a slightly lower potential (30.2%). The two combined would minimise the risk of rebound effects (sometimes referred to as the Jevons paradox) where households would increase their overall use of water after WSA installation because users perceive water use be categorically more efficient (Pérez-Urdiales and García-Valiñas Citation2016). Messaging campaigns from water providers or regulators could complement WSA roll-out. The UK’s Department for Environment, Food and Rural Affair’s (DEFRA) Water Efficiency and Behaviour Change Rapid Evidence Assessment (Orr et al. Citation2018) found that WSAs, information provision, and a two-way engagement with households lead to household water use reductions when used together, but concluded that more research is needed on behaviour change. Research has started to show that behavioural intervention ‘green nudges’ can have significant impact on household water use behaviours (Carlsson et al. Citation2019), without the need to resort to economic incentives. Ferraro, Miranda, and Price (Citation2011) report that normative appeals to households particularly using social comparisons (i.e. use against neighbours or the local area) can result in significant, lasting reductions in household water use, and are more effective than simple technical advice or information on their own.
Findings from this tool regarding, for instance, morning peak use could direct specific messaging to consumers and provide evidence for social comparisons. For instance, messaging first thing in the morning may be more effective than in the afternoon. Combination of physical water-saving hardware such as WSAs with ‘softer’ behavioural interventions could help ‘lock in’ the positive impact from WSA uptake.
6. Conclusions and recommendations
In this study, we proposed a simulation tool that measures domestic water use profiles and evaluates potential water savings in different households. The tool also analyses the impact of water-efficient appliances and greywater recycling strategies on domestic water consumption and wastewater generation profiles. The key findings from employing this tool in this study are summarised below:
Diurnal variations of water consumption and wastewater discharge both show a major morning peak followed by consistent activity and minor evening peaks, and these morning peaks can be reduced considerably with GWR.
Diurnal variations of water consumption and wastewater discharge for each appliance present a specific pattern.
The occupancy and dwelling type are the most important factors of household water consumption and wastewater discharge.
Installing water-efficient appliances such as low-flush toilets, tap restrictors and efficient washing machines and dishwashers significantly reduces per capita domestic water consumption. Dual-flush toilets yield the highest water savings.
Recycling treated wastewater from certain appliances (hand basins, baths and showers) significantly reduces domestic water consumption. Capacity of the storage tank for the greywater system, and occupancy levels, are the most important factors.
Installation of greywater storage tanks of 100 litres and 150 litres yielded almost the same water savings, and these were only marginally higher than water savings from 50-litre storage tanks, at each occupancy level. Therefore, cheaper 50-litre storage tanks present the most optimal GWR solution.
The assumptions used to build the simulation tool lead to some limitations:
Water and wastewater hydraulic profiles have been derived from a study that did not encompass exceptional large-scale events. For instance, the COVID-19 pandemic and associated population lockdowns impacted water consumption and wastewater discharge at household level. Household water use may be permanently changed with more people working from home;
Electric water appliances (washing machines and dishwashers) are becoming more and more water efficient. Therefore, water consumption from those appliances should be regularly updated in the simulation tool to reflect the average and best water consumption performances, as occupants renew their equipment; and
The current version of the tool does not account for leakages in the system.
Pursuant to the results and the conclusions discussed, and the limitations of the current model mentioned above, the following recommendations are made for future projects:
The built-in flexibility of the simulation tool could be further increased to account for more scenarios and provide results at a higher granularity, by adding new parameters or making currently fixed values configurable. For example, parameters influencing the timing of water consumption and wastewater discharge could help cover more scenarios. For this purpose, the impact COVID-19 lockdowns on water consumption and wastewater discharge could be derived from measurements by individual smart water meters, provided information is made available and at a frequency compatible with the simulation tool.
Levels of water consumption and wastewater discharge of each water appliance could also be made configurable to assess the impact of asset renewal on water consumption. A mobile app to help raise awareness about water conservation issues at household level and the promotion of greywater recycling could also be based on the simulation tool. This app could help individuals have a better understanding of what water-saving measures have the most impact on their budget and on the environment.
Including wastewater qualities inside the simulation tool could help better assess and model chemical and biological wastewater quality in collection pipes. As the use of water-saving appliances results in a higher concentration of pollutants inside the wastewater and lower volumes, this could adversely impact downstream sewer pipes that were designed to handle a different effluent. Assessing the quality of the wastewater discharge could then help better design remedial measures to protect wastewater workers and wastewater assets.
The simulation tool could have several applications with different types of users. Housing developers could use it when designing new housing developments to assess potential water savings and include greywater recycling options. Water savings could be part of the added value of their buildings. The tool could also help them better design downstream wastewater facilities, especially wastewater pumping stations, to limit hydrogen sulphide production, hence reducing risks to the wastewater workers, odour formation, and pipe corrosion. As water networks include fire hydrants that require a minimum pipe diameter, the impact on the design of water pipes is less obvious.
In countries where water is very scarce, it could help water authorities take more informed decisions related to greywater retrofitting and identify the right levels of incentives for promoting this measure.
A partnership with water authorities could also lead to the co-construction of a mobile app that would increase public outreach based on a mix of fixed water consumption values and values derived from individuals (via smart meters, or individual’s observations) to initiate change in behavioural impact, and promote water-saving appliances.
In short, the simulation tool proposed in this study is a novel contribution with further potential for demonstrating cost-effectiveness of water demand management measures, raising public awareness around water consumption, and planning water demand management programmes.
Supplemental Material
Download PDF (3.3 MB)Acknowledgements
The water consumption dataset used in this study was provided by WRc and is thankfully acknowledged.
Disclosure statement
No potential conflict of interest was reported by the author(s).
Supplementary material
Supplemental data for this article can be accessed https://doi.org/10.1080/1573062X.2021.1893031.
References
- Alkhaddar, R. A., D. Phipps, R. Morgan, B. Karci, and J. Hordesseux. 2007. “Saving Water in Showers.” Journal of Physics: Conference Series 76: 012064. doi:10.1088/1742-6596/76/1/012064.
- Alvisi, S., M. Franchini, and A. Marinelli. 2003. “A Stochastic Model for Representing Drinking Water Demand at Residential Level.” Water Resources Management 17 (3): 197–222. doi:10.1023/A:1024100518186.
- Amit, R. K., and P. Ramachandran. 2013. “A Relational Contract for Water Demand Management.” Urban Water Journal 10 (3): 209–215. doi:10.1080/1573062X.2012.724076.
- Barnett, M. J., D. Jackson-Smith, J. Endter-Wada, and M. Haeffner. 2020. “A Multilevel Analysis of the Drivers of Household Water Consumption in A Semi-arid Region.” Science of the Total Environment 712: 136489. doi:10.1016/j.scitotenv.2019.136489.
- Beck, L., and T. Bernauer. 2011. “How Will Combined Changes in Water Demand and Climate Affect Water Availability in the Zambezi River Basin?” Global Environmental Change, Symposium on Social Theory and the Environment in the New World (Dis)order 21: 1061–1072. doi:10.1016/j.gloenvcha.2011.04.001.
- Blokker, E. J. M., J. H. G. Vreeburg, and J. C. Van Dijk. 2010. “Simulating Residential Water Demand with a Stochastic End-use Model.” Journal of Water Resources Planning and Management 136 (1): 19–26. doi:10.1061/(ASCE)WR.1943-5452.0000002.
- Buchberger, S. G., and L. Wu. 1995. “Model for Instantaneous Residential Water Demands.” Journal of Hydraulic Engineering 121 (3): 232–246. doi:10.1061/(ASCE)0733-9429(1995)121:3(232).
- Burns, M. J., T. D. Fletcher, H. P. Duncan, B. E. Hatt, A. R. Ladson, and C. J. Walsh. 2015. “The Performance of Rainwater Tanks for Stormwater Retention and Water Supply at the Household Scale: An Empirical Study.” Hydrological Processes 29 (1): 152–160. doi:10.1002/hyp.10142.
- Butler, D., and F. A. Memon. 2005. Water Demand Management. London, UK: IWA Publishing.
- Calatrava, J., M. García-Valiñas, A. Garrido, and F. González-Gómez. 2015. “Water Pricing in Spain: Following the Footsteps of Somber Climate Change Projections.” In Water Pricing Experiences and Innovations, Global Issues in Water Policy, edited by A. Dinar, V. Pochat, and J. Albiac-Murillo, 313–340. Cham: Springer International Publishing. doi:10.1007/978-3-319-16465-6_16.
- Campisano, A., and C. Modica. 2010. “Experimental Investigation on Water Saving by the Reuse of Washbasin Grey Water for Toilet Flushing.” Urban Water Journal 7 (1): 17–24. doi:10.1080/15730621003596739.
- Carlsson, F., C. Gravert, O. Johansson-Stenman, and V. Kurz. 2019. Nudging as an Environmental Policy Instrument Working Paper in Economics No. 756. Gothenburg, Sweden: University of Gothenburg.
- Casal-Campos, A., G. Fu, D. Butler, and A. Moore. 2015. “An Integrated Environmental Assessment of Green and Gray Infrastructure Strategies for Robust Decision Making.” Environmental Science & Technology 49 (14): 8307–8314. doi:10.1021/es506144f.
- Casal-Campos, A., S. M. K. Sadr, G. Fu, and D. Butler. 2018. “Reliable, Resilient and Sustainable Urban Drainage Systems: An Analysis of Robustness under Deep Uncertainty.” Environmental Science & Technology 52 (16): 9008–9021. doi:10.1021/acs.est.8b01193.
- Cominola, A., M. Giuliani, A. Castelleti, A. M. Abdallah, and D. E. Rosenberg. 2016. Developing a Stochastic Simulation Model for the Generation of Residential Water End-use Demand Time Series. 8th International Congress on Environmental Modelling and Software, Toulouse, France, July 2016.
- Critchley, R., and D. Phipps. 2007. Water and Energy Efficient Showers: Project Repor. Liverpool, UK: United Utilities and Liverpool John Moores University.
- DCLG. 2010. Code for Sustainable Homes; Technical Guide (No. ISBN: 978 1 85946 331 4). London, UK: Department for Communities and Local Government (DCLG).
- Dean, A. J., K. S. Fielding, and F. J. Newton. 2016. “Community Knowledge about Water: Who Has Better Knowledge and Is This Associated with Water-Related Behaviors and Support for Water-Related Policies?” PLoS ONE 11 (7): e0159063. doi:10.1371/journal.pone.0159063.
- Dieu-Hang, T., R. Q. Grafton, R. Martínez-Espiñeira, and M. Garcia-Valiñas. 2017. “Household Adoption of Energy and Water-efficient Appliances: An Analysis of Attitudes, Labelling and Complementary Green Behaviours in Selected OECD Countries.” Journal of Environmental Management 197: 140–150. doi:10.1016/j.jenvman.2017.03.070.
- Dinar, A., and A. Subramanian. 1997. Water Pricing Experiences : An International Perspective (No. WTP386). Washington, DC: World Bank.
- Dixon, A., D. Butler, and A. Fewkes. 1999. “Water Saving Potential of Domestic Water Reuse Systems Using Greywater and Rainwater in Combination.” Water Science and Technology 39 (5): 25–32. doi:10.1016/S0273-1223(99)00083-9.
- EA. 1999. Water Consumption and Conservation in Buildings - Review of Water Conservation Measures. Worthing: Environment Agency (EA).
- EA. 2007. Assessing the Cost of Compliance with the Code for Sustainable Homes (No. ISBN: 9781844326195). London, UK: Environment Agency (EA)
- Ferraro, P. J., J. J. Miranda, and M. K. Price. 2011. “The Persistence of Treatment Effects with Norm-based Policy Instruments: Evidence from a Randomized Environmental Policy Experiment.” American Economic Review 101 (3): 318–322. doi:10.1257/aer.101.3.318.
- Fielding, K. S., A. Spinks, S. Russell, R. McCrea, R. Stewart, and J. Gardner. 2013. “An Experimental Test of Voluntary Strategies to Promote Urban Water Demand Management.” Journal of Environmental Management 114: 343–351. doi:10.1016/j.jenvman.2012.10.027.
- Fyfe, J., D. May, J. Glassmire, T. McEwan, and R. Plant. 2009. Evaluation of Water Savings from the 37 South East Water Showerhead Exchange Program. Sydney, Australia: South East Water.
- Gao, H., T. Wei, I. Lou, Z. Yang, Z. Shen, and Y. Li. 2014. “Water Saving Effect on Integrated Water Resource Management.” Resources, Conservation and Recycling 93: 50–58. doi:10.1016/j.resconrec.2014.09.009.
- Ghisi, E., and D. F. Ferreira. 2007. “Potential for Potable Water Savings by Using Rainwater and Greywater in a Multi-storey Residential Building in Southern Brazil.” Building and Environment 42 (7): 2512–2522. doi:10.1016/j.buildenv.2006.07.019.
- Inskeep, B. D., and S. Z. Attari. 2014. “The Water Short List: The Most Effective Actions U.S. Households Can Take to Curb Water Use.” Environment: Science and Policy for Sustainable Development 56 (4): 4–15. doi:10.1080/00139157.2014.922375.
- Juan, Y.-K., Y. Chen, and J.-M. Lin. 2016. “Greywater Reuse System Design and Economic Analysis for Residential Buildings in Taiwan.” Water 8 (11): 546. doi:10.3390/w8110546.
- Kofinas, D. T., A. Spyropoulou, and C. S. Laspidou. 2018. “A Methodology for Synthetic Household Water Consumption Data Generation.” Environmental Modelling and Software 100: 48–66. doi:10.1016/j.envsoft.2017.11.021.
- Kowalski, M., and D. Marshallsay. 2003. A System for Improved Assessment of Domestic Water Use Components. Technical Report. Swindon, UK: Water Research Centre.
- Lee, M., B. Tansel, and M. Balbin. 2013. “Urban Sustainability Incentives for Residential Water Conservation: Adoption of Multiple High Efficiency Appliances.” Water Resources Management 27 (7): 2531–2540. doi:10.1007/s11269-013-0301-8.
- Leong, J. Y. C., M. N. Chong, and P. E. Poh. 2018. “Assessment of Greywater Quality and Performance of a Pilot-scale Decentralised Hybrid Rainwater-greywater System.” Journal of Cleaner Production 172: 81–91. doi:10.1016/j.jclepro.2017.10.172.
- Liang, Y., L. K. Henderson, and K. F. Kee. 2018. “Running Out of Water! Developing a Message Typology and Evaluating Message Effects on Attitude toward Water Conservation.” Environmental Communication 12 (4): 541–557. doi:10.1080/17524032.2017.1288648.
- Lindsay, J., A. J. Dean, and S. Supski. 2017. “Responding to the Millennium Drought: Comparing Domestic Water Cultures in Three Australian Cities.” Regional Environmental Change 17 (2): 565–577. doi:10.1007/s10113-016-1048-6.
- Liu, A., D. Giurco, P. Mukheibir, S. Mohr, G. Watkins, and S. White. 2017. “Online Water-use Feedback: Household User Interest, Savings and Implications.” Urban Water Journal 14 (9): 900–907. doi:10.1080/1573062X.2017.1279194.
- Lowe, B., D. Lynch, and J. Lowe. 2015. “Reducing Household Water Consumption: A Social Marketing Approach.” Journal of Marketing Management 31 (3–4): 378–408. doi:10.1080/0267257X.2014.971044.
- Makki, A. A., R. A. Stewart, K. Panuwatwanich, and C. Beal. 2013. “Revealing the Determinants of Shower Water End Use Consumption: Enabling Better Targeted Urban Water Conservation Strategies.” Journal of Cleaner Production, Special Volume: Water, Women, Waste, Wisdom and Wealth 60: 129–146. doi:10.1016/j.jclepro.2011.08.007.
- Mandal, D., P. Labhasetwar, S. Dhone, A. S. Dubey, G. Shinde, and S. Wate. 2011. “Water Conservation Due to Greywater Treatment and Reuse in Urban Setting with Specific Context to Developing Countries.” Resources, Conservation and Recycling 55 (3): 356–361. doi:10.1016/j.resconrec.2010.11.001.
- Manouseli, D., S. M. Kayaga, and R. Kalawsky. 2017. “Evaluation of Water Efficiency Programs in Single-family Households in the UK: A Case Study.” Water Science & Technology: Water Supply 17 (6): 1785–1792. doi:10.2166/ws.2017.071.
- Manouseli, D., S. M. Kayaga, and R. Kalawsky. 2019. “Evaluating the Effectiveness of Residential Water Efficiency Initiatives in England: Influencing Factors and Policy Implications.” Water Resources Management 33 (7): 2219–2238. doi:10.1007/s11269-018-2176-1.
- Meireles, I., V. Sousa, K. Adeyeye, and A. Silva-Afonso. 2018. “User Preferences and Water Use Savings Owing to Washbasin Taps Retrofit: A Case Study of the DECivil Building of the University of Aveiro.” Environmental Science and Pollution Research 25 (20): 19217–19227. doi:10.1007/s11356-017-8897-5.
- Mekonnen, M. M., and A. Y. Hoekstra. 2016. “Four Billion People Facing Severe Water Scarcity.” Science Advances 2 (2): e1500323. doi:10.1126/sciadv.1500323.
- Millock, K., and C. Nauges. 2010. “Household Adoption of Water-Efficient Equipment: The Role of Socio-Economic Factors, Environmental Attitudes and Policy.” Environmental and Resource Economics 46 (4): 539–565. doi:10.1007/s10640-010-9360-y.
- Miranda, J. D., C. Armas, F. M. Padilla, and F. I. Pugnaire. 2011. “Climatic Change and Rainfall Patterns: Effects on Semi-arid Plant Communities of the Iberian Southeast.” Journal of Arid Environments 75 (12): 1302–1309. doi:10.1016/j.jaridenv.2011.04.022.
- Morrison, J., and E. Friedler. 2015. “A Critical Review of Methods Used to Obtain Flow Patterns and Volumes of Individual Domestic Water Using Appliances.” Urban Water Journal 12 (4): 328–343. doi:10.1080/1573062X.2014.900090.
- Nguyen, K. A., H. Zhang, and R. A. Stewart. 2013. “Development of an Intelligent Model to Categorise Residential Water End Use Events.” Journal of Hydro-environment Research 7 (3): 182–201. doi:10.1016/j.jher.2013.02.004.
- Oh, K. S., J. Y. C. Leong, P. E. Poh, M. N. Chong, and E. V. Lau. 2018. “A Review of Greywater Recycling Related Issues: Challenges and Future Prospects in Malaysia.” Journal of Cleaner Production 171: 17–29. doi:10.1016/j.jclepro.2017.09.267.
- Oron, G., M. Adel, V. Agmon, E. Friedler, R. Halperin, E. Leshem, and D. Weinberg. 2014. “Greywater Use in Israel and Worldwide: Standards and Prospects.” Water Research 58: 92–101. doi:10.1016/j.watres.2014.03.032.
- Orr, P., L. Papadopoulou, C. Twigger-Ross, N. House, and S. London. 2018. Water Efficiency and Behaviour Change Rapid Evidence Assessment (REA). Joint Water Evidence Programme. London, UK: Department for Environment, Food and Rural Affairs.
- Oteng-Peprah, M., M. A. Acheampong, and N. K. deVries. 2018. “Greywater Characteristics, Treatment Systems, Reuse Strategies and User Perception—a Review.” Water, Air, & Soil Pollution 229 (8): 255. doi:10.1007/s11270-018-3909-8.
- Pachauri, R. K., M. R. Allen, V. R. Barros, J. Broome, W. Cramer, R. Christ, J. A. Church, et al. 2014. Climate Change 2014: Synthesis Report. Contribution of Working Groups I, II and III to the Fifth Assessment Report of the Intergovernmental Panel on Climate Change. Geneva, Switzerland: IPCC.
- Patwardhan, S., and V. Vishwanath. 2017. “Assessment of Water Consumption at Urban Household Level: A Case Study of Pune, Maharashtra.” In Sustainable Smart Cities in India: Challenges and Future Perspectives, The Urban Book Series, edited by P. Sharma, & S. Rajput, 475–491. Cham: Springer International Publishing. doi:10.1007/978-3-319-47145-7_30.
- Penn, R., M. Hadari, and E. Friedler. 2012. “Evaluation of the Effects of Greywater Reuse on Domestic Wastewater Quality and Quantity.” Urban Water Journal 9 (3): 137–148. doi:10.1080/1573062X.2011.652132.
- Pérez-Urdiales, M., and M. Á. García-Valiñas. 2016. “Efficient Water-using Technologies and Habits: A Disaggregated Analysis in the Water Sector.” Ecological Economics 128: 117–129. doi:10.1016/j.ecolecon.2016.04.011.
- Philip, M., J. McMahon, S. Heyenga, O. Marinoni, G. Jenkins, S. Maheepala, and M. Greenway. 2008. Review of Stormwater Harvesting Practices (No. Urban Water Security Research Alliance Technical Report No. 9). Australia: Griffith University.
- Porter, J. 2018. “Principles of User Interface Design [WWW Document].” Bokardo. Accessed 23 October 2018. http://bokardo.com/principles-of-user-interface-design/
- Rahim, M. S., K. Anh Nguyen, R. A. Stewart, D. Giurco, and M. Blumenstein. 2019. “Predicting Household Water Consumption Events: Towards a Personalised Recommender System to Encourage Water-conscious Behaviour.” In 2019 International Joint Conference on Neural Networks (IJCNN). Presented at the 2019 International Joint Conference on Neural Networks (IJCNN), Budapest, Hungary, 1–8. doi:10.1109/IJCNN.2019.8851868.
- Sadr, S. M. K., A. Casal-Campos, G. Fu, R. Farmani, S. Ward, and D. Butler. 2020. “Strategic Planning of the Integrated Urban Wastewater System Using Adaptation Pathways.” Water Research 182: 116013. doi:10.1016/j.watres.2020.116013.
- Sadr, S. M. K., F. A. Memon, A. Jain, S. Gulati, A. P. Duncan, W. Hussein, D. A. Savic, and D. Butler. 2016. “An Analysis of Domestic Water Consumption in Jaipur, India.” British Journal of Environment and Climate Change 6: 97–115.
- Sauri, D. 2019. “The Decline of Water Consumption in Spanish Cities: Structural and Contingent Factors.” International Journal of Water Resources Development 1–17. doi:10.1080/07900627.2019.1634999.
- Shan, Y., L. Yang, K. Perren, and Y. Zhang. 2015. “Household Water Consumption: Insight from a Survey in Greece and Poland.” Procedia Engineering, Computing and Control for the Water Industry (CCWI2015) Sharing the Best Practice in Water Management 119: 1409–1418. doi:10.1016/j.proeng.2015.08.1001.
- Stewart, R. A., D. Giurco, K. Panuwatwanich, B. Capati, and R. Willis. 2009. “Gold Coast Domestic Water End Use Study.” Water Journal of Australian Water Association 36: 84.
- Turner, A. J., J. R. Willetts, S. A. Fane, D. Giurco, J. Chong, A. Kazaglis, and S. White. 2010. Guide to Demand Management and Integrated Resource Planning (Update on Original 2008 Guide) (Report). Sydney, Australia: Institute for Sustainable Futures, University of Technology Sydney.
- Vitter, J. S., and M. E. Webber. 2018. “A Non-intrusive Approach for Classifying Residential Water Events Using Coincident Electricity Data.” Environmental Modelling & Software 100: 302–313. doi:10.1016/j.envsoft.2017.11.029.
- Ward, S., R. Farmani, S. Atkinsoon, D. Butler, A. Hargreaves, V. Cheng, S. Denman, and M. Echenique. 2012. “Towards an Integrated Modelling Framework for Sustainable Urban Development.” In Presented at the 9th International Conference on Urban Drainage Modelling, 1–12. Belgrade, Serbia.
- Warner, D., K. Lewis, and J. Tzilivakis. 2019. “Stormwater Harvesting and Flood Mitigation: A UK Perspective.” In Urban Stormwater and Flood Management: Enhancing the Liveability of Cities, Applied Environmental Science and Engineering for a Sustainable Future, edited by V. Jegatheesan, A. Goonetilleke, J. van Leeuwen, J. Kandasamy, D. Warner, B. Myers, M. Bhuiyan, K. Spence, and G. Parker, 29–47. Cham: Springer International Publishing. doi:10.1007/978-3-030-11818-1_2.
- Willis, R. M., R. A. Stewart, D. P. Giurco, M. R. Talebpour, and A. Mousavinejad. 2013. “End Use Water Consumption in Households: Impact of Socio-demographic Factors and Efficient Devices.” Journal of Cleaner Production, Special Volume: Water, Women, Waste, Wisdom and Wealth 60: 107–115. doi:10.1016/j.jclepro.2011.08.006.
- WRc. 2005. Domestic Microcomponent Water Use Data (No. WRc report P6832). London, UK: WRc
- Yang, H., X. Zhang, and A. J. B. Zehnder. 2003. “Water Scarcity, Pricing Mechanism and Institutional Reform in Northern China Irrigated Agriculture.” Agricultural Water Management 61 (2): 143–161. doi:10.1016/S0378-3774(02)00164-6.