
 ?Mathematical formulae have been encoded as MathML and are displayed in this HTML version using MathJax in order to improve their display. Uncheck the box to turn MathJax off. This feature requires Javascript. Click on a formula to zoom.
ABSTRACT
To evaluate the performance of Real Time Control (RTC) of urban drainage systems (UDS) a comparison is made with the pre-RTC situation, making the RTC performance dependent on the functioning of the UDS prior to implementation. To standardise things, a generalised baseline is formulated here as the operation with optimal static settings of the UDS. Two maximum theoretical potential performances are then calculated, one including and one excluding system limitations. These are combined with the generalised baseline to form Realised Potential Indicators (RPIs), objective values which indicate the proximity of the RTC strategy to its maximum potential. The proposed methodology was demonstrated on the case study of Eindhoven, the Netherlands. The results obtained show that using RPIs allows for a more objective assessment and improved understanding of the efficacy of different RTC procedures. Additionally, the RPIs can provide an indication if RTC is sufficient to achieve the desired UDS performance.
1. Introduction
Awareness of the anthropogenic impact on natural waters has resulted in increasingly stringent regulations, aiming to reduce pollution loads to natural water bodies and other recipients. Combined sewer systems, through combined sewer overflows (CSOs) and overloading of the wastewater treatment plant (WWTP), can contribute significantly to the degradation of these recipients (Wang Citation2014; Quijano et al. Citation2017; Soriano and Rubió Citation2019). Increased urbanisation and climate change are projected to exacerbate these impacts (Semadeni-Davies et al. Citation2008; Astaraie-Imani, Kapelan, and Butler Citation2013). These negative effects can be reduced or mitigated through the construction of additional in-sewer storage, expanding WWTP facilities, disconnecting the stormwater runoff and reducing the impervious fraction of land cover (Frehmann et al. Citation2002; Thomas and Crawford Citation2011). However, such investments are costly and often impractical in highly urbanised areas due to spatial constraints. Utilising the existing infrastructure in the most optimal way has therefore become a key strategy to mitigate above adverse effects in the urban environment.
This has given rise to the use of Real Time Control (RTC), whereby the urban drainage system (UDS) is dynamically controlled based on real-time information of the system state (Schütze et al. Citation2002). The control objective varies based on the UDS characteristic and preferences of the operator and can take the form of CSO volume reduction (Schilling et al. Citation1996), pollution load reduction (Ly et al. Citation2019; Sun et al. Citation2020), environmental impact minimization (Langeveld et al. Citation2013; Vezzaro et al. Citation2014) or energy use optimisation (Kroll et al. Citation2018). Multi-objective control, where several objectives are formalised together, have also been reported (Ocampo-Martinez et al. Citation2008). Furthermore, control objectives can either be direct, such that the objective function is formulated as the desired outcome, or indirect, where the objective function is a mechanism resulting in the desired outcome and is more closely representative of the system dynamics. Ensuring that throughout the entire UDS there is an equal filling degree is a popularly implemented example of an indirect objective function (Kroll Citation2019). The decision of objective function, actuator location or inclusion of actuators and form the RTC strategy (Schütze et al. Citation2002).
A plethora of different RTC approaches have been designed and the computation of the control actions can broadly be separated in heuristic and optimisation-based procedures (García et al. Citation2015), whereby the formulation of the actions are considered the RTC procedure (Schütze et al. Citation2002). Heuristic strategies, commonly found in the form of if-then rules, are more widespread due to relative ease and instinctive nature of implementation. However these strategies have been reported in the literature to be inferior with respect to the ability to reach the set objective(s) compared to optimisation-based algorithms where an objective function is optimised in real time (Mollerup et al. Citation2013; Vezzaro and Grum Citation2014) potentially with a predictive component (Lund et al. Citation2018). It has been argued that this difference in efficacy between heuristic and optimisation-based procedures is not significant enough to warrant the additional efforts required for optimisation-based procedures (Mollerup, Mikkelsen, and Sin Citation2016; Kroll Citation2019). Additional efforts, such a data gathering, modelling of the UDS and actuator installation, are needed for any RTC system (Beeneken et al. Citation2013) and can be costly. To screen if an UDS is susceptive to improvements through RTC, the PASST tool was developed (Schütze et al. Citation2008), attempting to relate the potential of RTC to key characteristic of the UDS but the generalisation of system characteristics to the RTC potential is limited as acknowledged in their work. More accurate understanding of the potential of further optimisation of the infrastructure is therefore desired.
To assert the efficacy of an RTC strategy or procedure, a comparison is made between the UDS operation before and after the implementation of the RTC strategy considering a predefined evaluation parameter (van Daal-Rombouts et al. Citation2017). Such comparison are done at the design stage to establish if the control strategy improves the UDS or additional measures are necessary (Dirckx et al. Citation2011) and to address regulatory adherence (Meng, Fu, and Butler Citation2020). The evaluation can be materialised by comparing the relative gains with the cost of infrastructural solutions with the same outcome (Colas et al. Citation2004; Beeneken et al. Citation2013). A model- or data-driven approach can be chosen to postulate the benefit of the proposed RTC strategy, with their respective benefits and drawbacks previously discussed (van Daal-Rombouts et al. Citation2017). The model-driven approach can be used to estimate the efficacy of the proposed RTC strategy and is therefore commonly used.
The comparison between the performance of the UDS prior to and after implementation is not guaranteed to show the true potential of an RTC strategy, as the efficacy is highly dependent on the functioning of the UDS before implementation. Garbani-Marcantini et al. (Citation2017) developed a rating algorithm to assess the performance increase for UDS with and without RTC. Although this provides a more transferable evaluation, it is hampered by the same biases as previously stated. Similarly, to compare the potential of different RTC procedures, a benchmark UDS was suggest (Schütze et al. Citation2018). However, limiting research to a singular UDS is not beneficial as unique characteristics within UDS can lead to new insights for RTC potential. The aim of the paper is to develop a new methodology to objectively assess the true potential of an RTC procedure circumventing the inherent bias present in the current standard evaluation methods.
Here we propose an evaluation methodology based on a generalised baseline and the proximity of the procedure to the theoretical maximum performance. The methodology is further expanded on in Section 2. In Section 3, the UDS used to test the methodology is introduced. Section 4 shows and discusses the results and the conclusion are presented in Section 5.
2. Methodology
The proposed methodology, similar to the current practice, estimates the expected performance of an RTC procedure for a set of rainfall events using a simulation model of the analysed UDS. This model is used to calculate the Realised Potential Indicators (RPIs) which are then used to identify the proximity of the RTC procedure to what could have been achieved (). The calculation of RPIs is based on the concepts of generalised baseline (section 2.1) and the maximum theoretical performance (section 2.2). These two concepts are combined to form the RPIs, detailed in section 2.3.
Figure 1. Overview of proposed methodology
2.1. Generalised baseline performance
The generalised baseline performance is the performance of the analysed UDS based on predefined optimal fixed set points for all system actuators given a predefined RTC objective for a set of rainfall events. If the objective is to reduce the total CSO volume, the generalised baseline performance is the minimum CSO volume over all rainfall events achievable by having a single, fixed set point for each actuator, for example a single flow rate for a moveable gate. Any performance improvement above this static optimum performance is therefore the true potential of an RTC procedure. If actuators are added as part of the RTC strategy, these settings should be applied to these actuators as well as the baseline is applied to any new configuration. This will allow for a more objective insight in the benefits of the RTC procedure part of the strategy versus static optimisation methods.
The optimal static set points are defined here as settings under which the optimal performance of the UDS can be achieved. The static optimal settings are limited to a singular if-then rule, where a threshold is established above and below which the settings for each actuator are different. The optimal static settings are determined by solving the following optimisation problem:
where J represents the relevant objective function chosen for the RTC strategy (e.g. total CSO volume), N is the number of rainfall events used, Y is the sequence of system states at each time instance t, W is the sequence of disturbances at each time instance t and are the settings of n system actuators defined as follows:
where s1 and s2 are the optimal set points, hn is the variable of interest for the activation of nth actuator and threshold is the triggering threshold (e.g. the allowed flow rate through a moveable gate dependent on the upstream water level). The optimisation decision variables are settings . The optimisation problem defined in EquationEquation (2.1)
(2.1)
(2.1) is subject to explicit constraints (lower and higher search limits for each decision variable) and implicit constraints (flow and energy balance equations implemented in the simulation model of the analysed UDS). The rainfall events used should be representative of the typical climate, and include events that cause a change in the objective function outcome (e.g. cause a CSO event if this is the objective function). It is assumed that the actuators are able to maintain the set points throughout the event, without considering practical and physical limitations.
To solve the optimisation problem defined above, some optimisation method has to be used. Here, a standard Genetic Algorithm is used (Goldberg Citation1989) as it has widespread applications in water systems optimisation (Montserrat et al. Citation2017). As the optimisation can be done off-line (i.e. prior to online RTC), computational limitations arising from optimisation are not important when compared to the RTC, where optimisation is used online, meaning that model accuracy does not have to be compromised.
Once the optimal static settings for the control stations are determined, the RTC of the analysed UDS is simulated separately for each rainfall event by using these settings. The results from these simulations are then used to define the generalised baseline performance, and are used to assess the performance per the steps set out in section 2.3.
2.2. Maximum theoretical performance
Along with the generalised baseline, the Maximum Theoretical Performance (MTP) is calculated for each rainfall event. Two methods are proposed here to define the MTP, namely the absolute MTP and the system MTP. Both of these methods are conceptualised for volume-based RTC only as pollution- or impact-based RTC strategy are considered outside the scope of this paper. Having said this, if necessary and desired, it is straightforward to expand the MTP concept to these cases as well.
The estimation of absolute MTP is based on using a simplified model of the analysed UDS. This simplified model is a single linear reservoir model per pumped UDS which fill homogenously throughout the event with relevant pumping capacity always available (see ). The linear reservoir model is a mass-balance model of a section of an UDS (Gelormino and Ricker Citation1994). This assumes that the filling degree of the UDS is equal throughout, using all the available storage capacity, which is the maximum potential performance for a volume-based RTC strategy. The total storage of the UDS, both static and dynamic, can be estimated through simulations of the full-hydrodynamic model (van Daal-Rombouts et al. Citation2016). The total CSO volume for each event used in the evaluation can be computed by solving the mass-balance equation for the simplified model The UDS loading is the combination of the dry weather flow and urban runoff. The former is the total dry weather flow generated while the latter is computed by using linear superposition of the inflows for each sub-catchment in the UDS, calculated through the Rational Method (Butler et al. Citation2018).
When there are parts in the UDS which are connected through pumps to the main sewer or a downstream section, then these parts of the UDS are modelled separately with their pump output considered as another component of the system loading. The most upstream part is modelled first, and if a CSO event occurs, this value is set as the minimum CSO volume for that part of the system. The part is then combined with the downstream or main section, as per the central basin approach (Einfalt and Stölting Citation2002) and the CSO volume is computed for the combined sections. If this volume is lower than the upstream result, the upstream result is kept. This takes into consideration pumping capacities, which can influence the RTC potential if not included. If the stored volume is equal to the available storage capacity, the loss through CSO is equivalent to the difference between the system loading and the outflow to the WWTP (). This model considers CSO volume and flooding volume as the same and might therefore overestimate CSO volumes for event where flooding will occur. Events of this magnitude can therefore not reliably be assessed with this method. As RTC for CSO reduction has the greatest potential for relatively small events (e.g. Meneses et al. Citation2018), this is not deemed inhibitory for its application.
Figure 2. Absolute maximum theoretical performance mass balance
Note that absolute MTP assumes the potential of the RTC system to distribute the stored water homogenously in the UDS without causing local CSOs. The system MTP, however, uses the model used for the RTC design or operation to compute, over the entire event horizon the optimal trajectory of settings for each actuator in the system following EquationEquation (2.1)(2.1)
(2.1) without the constraints imposed by EquationEquation (2.2)
(2.2)
(2.2) , thus acting as an MPC algorithm with an horizon of the event duration. It is therefore not assumed that all the storage in the system can be activated at any given time step, an assumption on which the absolute MTP is based. A large difference between the absolute and system MTP indicates that the effectiveness of the RTC to use the UDS optimally is limited with the current actuator configuration.
2.3. RTC potential
To allow for the comparison of RTC procedures for different UDS, two normalised realised potential indicators (RPI) are proposed based on the absolute and system MTPs respectively:
where Jso,n is the objective function outcome for the nth rain event in the set using the static optimal settings (the generalised baseline performance, Section 2.1), JRTC,n the objective function outcome for the proposed RTC procedure for the nth rain event, JMTPa and JMTPs are the objective function outcomes for the absolute and system maximum theoretical performance settings for the nth rain event respectively, and N are the total number of events used. An RPI of 1 indicates that the RTC procedure has reached its maximal potential, where a 0 means no improvement to the performance compared to the baseline and a negative value signifies that the static optimal functions better compared to the RTC procedure. The distribution of the absolute RPI is computed using EquationEquation (2.3)(2.3)
(2.3) and the system RPI using EquationEquation (2.4)
(2.4)
(2.4) . The actual RPIs are defined as the RPI for the sum of the objective function outcome, as opposed to using the mean of the set of RPIs.
To assert the RPI values with confidence, sufficiently representative rainfall events should be included in the analysis. van Daal-Rombouts et al. (Citation2017) showed the sensitivity of RTC performance if limited rainfall events are used. Kroll et al. (Citation2018) used 24 rain events, varying from 0.1–3 year return periods as a representative sample. Schütze et al. (Citation2018), however, used 10 continuous years of radar rainfall data. Both can be used, but a larger dataset remains preferable. If accurate radar data is available, capturing spatial heterogeneity of the rainfall, this data should be used.
3. Case study
3.1. System description
The wastewater treatment plant (WWTP) Eindhoven and its connected urban catchments have been widely reported in the literature (Schilperoort Citation2011; van Daal-Rombouts Citation2017; Moreno Rodenas Citation2019) and its potential for the implementation of RTC has been previously assessed (Weijers et al. Citation2012; Langeveld et al. Citation2013). The WWTP has three independent inlets, Eindhoven City, Riool Zuid (Southern Sewer, RZ) and Neuen-Son. The RZ branch consists of a large transport sewer, extending 30 km to collect wastewater and urban runoff of municipalities to the east and south of Eindhoven. Halfway, a large pumping station (PS Aalst, design capacity of 12,000 m3/h) was installed to ensure the conveyance of waste- and stormwater. Upstream of PS Aalst there are two control stations, CS De Meeren directly upstream of PS Aalst and CS Valkenswaard upstream of CS De Meeren, which can regulate the flow by diverting the water through a bypass equipped with moveable gates and therefore divide this section of the UDS into three controllable sections (). Continuous water level measurements are available for the use in RTC strategies up- and downstream of both control stations.
Figure 3. Layout of the UDS upstream of the pumping station
Two CSOs, CSO Krooshek and CSO Loonderweg, are connected to the transport line downstream of the control stations in sections 1 and 2 respectively. These two CSOs are used as representatives for the total CSO volumes occurring in the municipalities connected to the respective sections. Section 3 discharges through smaller CSOs in the municipalities, here indicated by CSO Bergeijk. The CSOs discharge into the river De Dommel, which is, due to its relative small size, highly susceptible to oxygen depletion in the event of CSOs. The main control objective for this part of the UDS is to reduce the total CSO volume through the equal-filling degree principle achieved through the activation of the control stations. No preference for CSO location has been used in this study, although it might be beneficial to mainly discharge through CSO Krooshek, as this is the furthest downstream in the UDS.
Although the main pump station Aalst was designed to deliver 12,000 m3/h, unidentified practical problems caused this target to not be met. A delivery target of 10,000 m3/h was thereafter assumed, but this capacity is not consistently delivered either. In many cases, either the flow rate only reaches 8,000 m3/h, or a decline in the capacity during the event is seen (). Based on validated data of 34 rainfall events over the time period 2018–2020, a flow rate of 10,000 m3/h was achieved for 9 of these events, with the capacity reducing during the event for 3 of those. The CSO upstream of the pumping station has overflowed during some of these events (), corroborating earlier observations about CSOs caused by a system failing its design requirements (Korving and Clemens Citation2005).
Figure 4. Example of reduced pumping capacity leading to a CSO upstream
3.2. Rainfall data
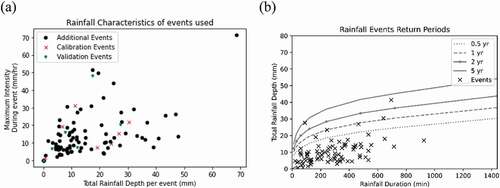
Given the large area covered by the UDS, radar rainfall data was used as rainfall input to the system as spatial heterogeneity of the rainfall is an important factor influencing system response (Cristiano et al. Citation2019). The rain gauge adjusted radar data with a 1 km x 1 km resolution at a five minute interval from the Royal Dutch Meteorological Institute was used (Overeem, Holleman, and Buishand Citation2009). For the simplified model, a weighted mean rainfall was used for runoff generating catchments which spanned beyond a single pixel size. 103 Rainfall events were identified for the period of 2014–2020. Seven of the rain events were used for the calibration of the model and the development of the RTC rules, and another 6 were used for the validation of the model performance and combined with the rest for the validation of the RTC results (). The events were selected randomly based on the return period, ensuring that a 0.5–1 yr return period was at least included in both validation and calibration.
Figure 5. Rainfall characteristics of a single pixel for the events used in the assessment of the RTC procedure. (a) distribution of total depth and intensity and (b) comparison to rainfall return periods
3.3. Real time control
The minimisation of the total CSO volume in the UDS was used as the objective function for the RTC strategy. Several heuristic based RTC procedures were developed to test the use of the RPIs for a real UDS (). All RTC procedures focussed on the use of the control stations to regulate the flow and relied on various level of information integration.
Table 1. Overview of tested RTC procedure
The principle of RTC Procedure 1 is to identify the flow phases () in which the sections upstream and downstream of the control stations are, and adjust the flow according to a predefined matrix per control station, where for every combination of phases an optimal set flow rate was calculated. The matrices are determined through the use of a Genetic Algorithm with search boundaries set to limit the computational time: 3000–7000 m3/h and 1750–3500 m3/h for CS De Meeren and CS Valkenswaard respectively. Each generation has a population of 15, with 3 parents used for mutation, selected based on the lowest total CSO across the used rainfall events. The phases are determined through the water level measurements upstream and downstream of each control station following set definitions (). This allows the UDS to dynamically adjust to differences in the system while ensuring that the emptying of the UDS is not unnecessarily hindered by reducing the downstream flow (during the emptying of the system). The final set points can be found in the Supplementary Data.
Table 2. Flow phases used for RTC procedures 1 and 2
RTC Procedure 2 follows the same phase-based strategy as RTC Procedure 1, but adjusts the setpoints in the matrices depending on the measured pump rates of PS Aalst. For this, as opposed to a single predefined matrix per control station, three matrices were defined applicable for the range 7000–8000, 8000–9000 and 9000–10000 m3/h delivered by PS Aalst. The computation of these values followed the same procedure as RTC Procedure 1. The final values can be found in the Supplementary Data.
RTC Procedure 3 takes the static optimum as a baseline, and adjusts the flow rate for the control stations based on an estimation of the filling degree in the upstream and downstream sections. The filling degree is estimated by calculating the filling degree of the manholes up- and downstream of the control stations, upstream of PS Aalst and upstream of CSO Bergeijk. This gives two filling degree estimates per section. the mean of these is used to estimate the overall filling degree in the sections. If there is a difference in the estimated filling degree, the flow rate is adjusted depending on the magnitude of the difference as follows:
where Qcs(t) is the target flowrate for the control station at time t, Qcs_so is the static optimal setpoint for that control station, FDups(t-1) and FDdws(t-1) are the upstream and downstream filling degree at the previous time interval respectively and wa is the correction severity constant.
3.4. System model and calibration results
A conceptual model of the UDS upstream of the pumping stations has been derived from a detailed hydrodynamics model and was built in EPA SWMM 5 (Rossman Citation2010). For the conceptual model, the main transport line was kept as is, as the dynamics within this pipe are key to the overall system dynamics. The municipal sewers where replaced by storage units, in a similar approach taken in (van Daal-Rombouts et al. Citation2016). This conceptual model was calibrated against the validated data from the sensors in the UDS, using the predicted CSOs as a binary classifier combined with the Nash-Sutcliffe efficiency coefficient (NSE, Nash and Sutcliffe Citation1970) of the level measurements monitored downstream and upstream of CS De Meeren and upstream of CS Valkenswaard and the flow rate through PS Aalst, as the NSE is deemed to be a reliable measure for conceptual model calibration (McCuen, Knight, and Cutter Citation2006). The parameters that were adjusted for the model were the initial loss term for each catchment, the Manning’s n value for the conduit in the transport sewer, runoff width for each catchment, and internal routing. The search space for the initial loss was 0–4 mm, for Manning’s n 0.005–0.015 m−1/3s, width of the catchment 100–1000 m and internal routing 100–1000 m. The calibration was done automatically using a Genetic Algorithm with a population size of 50, crossover rate of 0.4, mutation rate of 0.06 over 250 generation, with the maximisation of the mean NSE value from the four monitoring locations as the objective function.
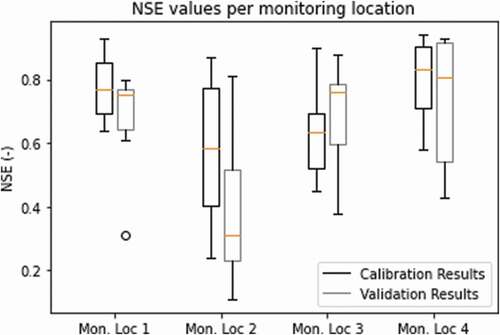
The focus of the calibration was to ensure that the dynamics in the transport sewer and the connected CSOs represented the UDS as per the monitoring data. Resulting from the calibration, the mean NSE value for the calibration events for the four monitoring locations varied from 0.57–0.78, with the validation events ranging from 0.32–0.73 (). The overall best performance was for the flow rate at PS Aalst, indicating that the flows through the systems culminate to approximately the right values at the most downstream part. The lowest performance was of the water level upstream of CSO Krooshek. This monitoring location is set between two actuators and is highly sensitive to the behaviour of these actuators. With minor differences in the throughput of the actuators during WWF, large changes are expected. The relatively low NSE for the validation of monitoring location two is therefore acceptable as it relates to physical phenomena known in the system.
Figure 6. NSE performance of the monitoring locations
The occurrence of CSO events was another important calibration parameter. No false positives or negative events were found in either the calibration and validation stage, indicating that the model can correctly predict the occurrence of a CSO event at the various CSO locations. The timing of the increasing and decreasing limbs of the hydrographs predicted by the model are also found to be matching well with the data (–d)).
Figure 7. (a-d) Validation results for single event during calibration process for Monitoring Loc 1 (a), 2(b), 3 (c) and 4 (d)
4. Results and discussion
In this section the results of the RTC Procedures and the application of the RPIs are presented and discussed.
The three RTC Procedures described in section 3.3 were optimised using the same rainfall events used for the calibration of the model, implemented for all 103 events described in section 3.2 and their respective CSO volumes were computed and compared. The pre-RTC operation of the UDS was to never restrict the flow through CS Valkenswaard and restrict, during wet weather conditions, the flow through CS De Meeren to 4,000 m3/h. As shown in , significant system performance increase compared to the Pre-RTC performance was observed for all three RTC procedures tested in the study () in terms of total CSO volume reduction.
Table 3. Performance overview of RTC procedures
The generalised baseline was obtained, where the static optimal settings were found to be 5,000 m3/h and 2,500 m3/h for CS De Meeren and Valkenswaard respectively. These static settings were used for the 103 rainfall events and the CSO values computed. As it can be seen from , in the pre-RTC situation, most of the overflow occurred through CSO Loonderweg (pipe section 2). This was alleviated in the generalised baseline by allowing more flow downstream and restricting flow upstream, resulting in increases in both other CSOs but compensated by the decrease in CSO Loonderweg, totalling 110.7∙103 m3, a decrease of 81.3%. Given this as the baseline to which the RTC Procedures are compared, the apparent performance improvements as per the conventional evaluation drops significantly (). The Pre-RTC system characteristics can therefore lead to overestimations of the potential of RTC if, given that static optimisation can already significantly decrease the CSO volume emitted by the UDS.
Figure 8. Objective comparison of RTC procedures to pre-RTC and generalised baseline
When the absolute maximum theoretical potential for the UDS was calculated for the 103 events, CSO events occurred during six rainfall events over the assessed events in the main part of the sewer system, totalling 16.8∙103 m3, or an 84.8% decrease in CSO volume compared to the generalised baseline. Given this large discrepancy between the MTP volume and occurrence of CSOs compared to the generalised baseline, significant improvements to the system performance are theoretically achievable using RTC. For the system maximum theoretical potential, the total number of events went up to 10, with a total CSO volume of 37.2∙103 m3.
The absolute and system RPIs were computed for the three RTC procedures for each event. Event where the generalised baseline did not experience any overflow (n = 26) were excluded from this analysis, as none of the RTC procedures caused any overflow during these events. As shown in , the absolute RPIs are 0.21, 0.27 and 0.54 for the three procedures respectively. For the system RPI, the resulting values were 0.26, 0.34 and 0.68 for the three procedures. As expected, the system RPI are higher compared to the absolute RPI, as the absolute MTP overestimated the RTC potential given the current actuator layout. All RPIs are in the range between −1.38 to 1, indicating that for some events the additional measures have decreased the system’s CSO performance. However, the mean and overall improvements offset these occasional decreases in performance.
Figure 9. Distribution of RPIs for the RTC strategies. Whiskers are the 95 CIs
Using the RPIs it has shown that there is room for improvement of the RTC procedures in this case. Such improvements might be achieved through Model Predictive Control or other optimisation based procedures, which were not included in this study. Given the relatively small difference between the system and absolute RPIs, this indicates that the current actuators are adequately able to achieve the theoretical optimal performance of the system. In the case where large discrepancy between the MTPs is obtained, this would suggest the inclusion of additional actuators might be beneficial from a system performance point of view, to activate the under-utilised storage. Optimisation of actuators placement, as presented in Eulogi et al. (Citation2021), can then be of interest. The use of both RPIs during the RTC evaluation process therefore gives additional information which can aid system operators in future investment decisions, through an increase in static storage potential or by aiming to reduce the gap between the system and absolute RPIs.
A decrease in the absolute RPI with an increasing mean total rainfall was observed when averaging the absolute RPI over 5 mm intervals (). This is consistent with the findings in literature that reported increased potential of RTC to mitigate against small to medium size rain events (Vezzaro and Grum Citation2014). Although the rain events in this study did not include sufficient rainfall events in the 35 mm −70 mm range to quantify this relation fully, the downward trend is significant.
Figure 10. Relation between mean total rainfall of an event and RPIa
5. Conclusion
This study proposed a new methodology for the more objective, cross-study comparison of Real Time Control (RTC) procedures applied to urban drainage systems. A Realised Potential Indicator (RPI) was formulated, combining transferable definitions of the baseline and the maximal potential of RTC for an urban drainage system. The new methodology was applied and demonstrated on the case study of the southern sewer system of the Eindhoven wastewater treatment plant. Based on the results obtained the following can be concluded:
Assessing the efficiency of some RTC strategy by comparing the urban drainage system’s performance with that strategy to pre-RTC performance is not reliable and can lead to significant RTC efficacy overestimations. As such, this approach does now allow for cross-study comparisons of different RTC procedures;
Using a generalised baseline approach in combination with a maximum potential threshold to calculate the RPI values suggested in this paper enables a more objective comparison of different RTC procedures and provides the means to assess the true potential of each RTC procedure given the analysed urban drainage system;
Using the RPI-based methodology proposed here, additional insights can be gained into the performance of an urban drainage system and can be used to inform operators about future investment needs.
The results shown in this study show how the objective quantification of the efficacy of RTC of urban drainage systems can allow for better comparison of RTC procedure performances as well as gain a better understanding on how to improve the system in the future.
In future work the RPI concept should be extended to include a formalisation for multi-objective functions and quality- and impact-based real time control strategies. Testing of the RPI concept on different UDS using different control types, including model predictive control, should also be done to ensure the transferability of the concept. Explicit integration of uncertainty analysis in the methodology should be examined in future works.
Author contributions
JvdW carried out the modelling and conceptualisation for the research and wrote the manuscript. The research was carried out under the active supervision of ZK and JG. JG acquired the funding for the research. All authors co-edited the document.
Supplemental Material
Download PDF (175.5 KB)Acknowledgements
The authors would like to thank Waterboard De Dommel for the access to their monitoring data. This research was carried out through funding of the Kennisprogramma Urban Drainage (Urban Drainage Knowledge Programme), sponsored through: ARCADIS, Deltares, Evides, Gemeente Almere, Gemeente Arnhem, Gemeente Breda, Gemeente ‘s-Gravenhage, Gemeentewerken Rotterdam, Gemeente Utrecht, GMB Rioleringstechniek, Grontmij, KWR Watercycle Research Institute, Royal HaskoningDHV, Stichting RIONED, STOWA, Tauw, vandervalk°root, Waterboard De Dommel, Waternet and Witteveen&Bos.
Data for this project is available on request.
Disclosure statement
The authors declare that they have no known competing financial interests or personal relationships that could have appeared to influence the work reported in this paper.
Supplementary material
Supplemental data for this article can be accessed https://doi.org/10.1080/1573062X.2021.1943460
Related Research Data
References
- Astaraie-Imani, M., Z. Kapelan, and D. Butler. 2013. “Improving the Performance of an Integrated Urban Wastewater System under Future Climate Change and Urbanisation Scenarios.” Journal of Water and Climate Change 4 (3): 232–243. doi:https://doi.org/10.2166/wcc.2013.078.
- Beeneken, T., V. Erbe, A. Messmer, C. Reder, R. Rohlfing, M. Scheer, … M. Weyand. 2013. “Real Time Control (Rtc) of Urban Drainage Systems–a Discussion of the Additional Efforts Compared to Conventionally Operated Systems.” Urban Water Journal 10 (5): 293–299. doi:https://doi.org/10.1080/1573062X.2013.790980.
- Butler, D., C. J. Digman, C. Makropoulos, and J. W. Davies. 2018. Urban Drainage, 230–232. London: CRC Press.
- Colas, H., M. Pleau, J. Lamarre, G. Pelletier, and P. Lavallée. 2004. “Practical Perspective on Real-time Control.” Water Quality Research Journal 39 (4): 466–478. doi:https://doi.org/10.2166/wqrj.2004.058.
- Cristiano, E., M. C. Ten Veldhuis, D. B. Wright, J. A. Smith, and N. van de Giesen. 2019. “The Influence of Rainfall and Catchment Critical Scales on Urban Hydrological Response Sensitivity.” Water Resources Research 55 (4): 3375–3390. doi:https://doi.org/10.1029/2018WR024143.
- Dirckx, G., M. Schütze, S. Kroll, C. Thoeye, G. de Gueldre, and B. van de Steene. 2011. “Cost-efficiency of RTC for CSO Impact Mitigation.” Urban Water Journal 8 (6): 367–377. doi:https://doi.org/10.1080/1573062X.2011.630092.
- Einfalt, T., and B. Stölting. 2002. “Real-Time Control for Two Communities — Technical and Administrational Aspects, In: Proceedings of the 9th International Conference on Urban Drainage.” In Presented at the 9th International Conference on Urban Drainage, 320–331. Portland, OR. doi:https://doi.org/10.1061/40644(2002)320.
- Eulogi, M., S. Ostojin, P. Skipworth, J. D. Shucksmith, and A. Schellart. 2021. “Hydraulic Optimisation of Multiple Flow Control Locations for the Design of Local Real Time Control Systems.” Urban Water Journal 18 (2): 91–100. doi:https://doi.org/10.1080/1573062X.2020.1860238.
- Frehmann, T., I. Nafo, A. Niemann, and W. F. Geiger. 2002. “Storm Water Management in an Urban Catchment: Effects of Source Control and Real-time Management of Sewer Systems on Receiving Water Quality.” Water Science and Technology 46 (6–7): 19–26. doi:https://doi.org/10.2166/wst.2002.0658.
- Garbani-Marcantini, L., G. Cereghetti, D. Muschalla, M. Regneri, S. Schegg, and J. Rieckermann. 2017. “Playing the Rain: A Chess-based Rating Algorithm for the Performance Assessment of Real-time Control in Urban Drainage Networks.” In Presented at the 14th IWA/IAHR International Conference on Urban Drainage (ICUD). CZWA; CTU.
- García, L., J. Barreiro-Gomez, E. Escobar, D. Téllez, N. Quijano, and C. Ocampo-Martínez. 2015. “Modeling and Real-time Control of Urban Drainage Systems: A Review.” Advances in Water Resources 85: 120–132. doi:https://doi.org/10.1016/j.advwatres.2015.08.007.
- Gelormino, M. S., and N. L. Ricker. 1994. “Model-predictive Control of a Combined Sewer System.” International Journal of Control 59 (3): 793–816. doi:https://doi.org/10.1080/00207179408923105.
- Goldberg, D. E. 1989. Genetic Algorithms in Search, Optimization and Machine Learning. Reading, MA:Addison-Wesley.
- Korving, H., and F. H. L. R. Clemens. 2005. “Impact of Dimension Uncertainty and Model Calibration on Sewer System Assessment.” Water Science and Technology 52 (5): 35–42. doi:https://doi.org/10.2166/wst.2005.0103.
- Kroll, S. 2019. “Design of Real-Time Control Strategies for Combined Sewer Networks.” PhD diss., Katholieke Universiteit Leuven.
- Kroll, S., M. Weemaes, J. Van Impe, and P. Willems. 2018. “A Methodology for the Design of RTC Strategies for Combined Sewer Networks.” Water 10 (11): 1675. doi:https://doi.org/10.3390/w10111675.
- Langeveld, J. G., L. Benedetti, J. J. M. de Klein, I. Nopens, Y. Amerlinck, A. van Nieuwenhuijzen, … S. Weijers. 2013. “Impact-based Integrated Real-time Control for Improvement of the Dommel River Water Quality.” Urban Water Journal 10 (5): 312–329. doi:https://doi.org/10.1080/1573062X.2013.820332.
- Lund, N. S. V., A. K. V. Falk, M. Borup, H. Madsen, and P. Steen Mikkelsen. 2018. “Model Predictive Control of Urban Drainage Systems: A Review and Perspective Towards Smart Real-time Water Management.” Critical Reviews in Environmental Science and Technology 48 (3): 279–339. doi:https://doi.org/10.1080/10643389.2018.1455484.
- Ly, D. K., T. Maruéjouls, G. Binet, and J. L. Bertrand-Krajewski. 2019. “Application of Stormwater Mass–volume Curve Prediction for Water Quality-based Real-time Control in Sewer Systems.” Urban Water Journal 16 (1): 11–20. doi:https://doi.org/10.1080/1573062X.2019.1611885.
- McCuen, R. H., Z. Knight, and A. G. Cutter. 2006. “Evaluation of the Nash–Sutcliffe Efficiency Index.” Journal of Hydrologic Engineering 11 (6): 597–602. doi:https://doi.org/10.1061/(ASCE)1084-0699(2006)11:6(597).
- Meneses, E.J., M. Gaussens, C. Jakobsen, P.S. Mikkelsen, M. Grum, and L. Vezzaro. 2018. “Coordinating Rule-Based and System-Wide Model Predictive Control Strategies to Reduce Storage Expansion of Combined Urban Drainage Systems: The Case Study of Lundtofte, Denmark.” Water 10 (1): 76. doi:https://doi.org/10.3390/w10010076.
- Meng, F., G. Fu, and D. Butler. 2020. “Regulatory Implications of Integrated Real-Time Control Technology under Environmental Uncertainty.” Environmental Science & Technology 54 (3): 1314–1325. doi:https://doi.org/10.1021/acs.est.9b05106.
- Mollerup, A. L., P. S. Mikkelsen, and G. Sin. 2016. “A Methodological Approach to the Design of Optimising Control Strategies for Sewer Systems.” Environmental Modelling & Software 83: 103–115. doi:https://doi.org/10.1016/j.envsoft.2016.05.004.
- Mollerup, A.L., D. Thornberg, P.S. Mikkelsen, N.B. Johansen, and G. Sin. 2013. “16 Years of Experience with Rule Based Control of Copenhagen’s Sewer System.” In Proceedings of the 11th International Conference on Instrumentation, Control and Automation (ICA), 4. Narbonne, France.
- Montserrat, A., T. Hofer, M. Poch, D. Muschalla, and L. Corominas. 2017. “Using the Duration of Combined Sewer Overflow Events for the Calibration of Sewer Hydrodynamic Models.” Urban Water Journal 14 (8): 782–788. doi:https://doi.org/10.1080/1573062X.2016.1254255.
- Moreno Rodenas, A. 2019. “Uncertainty Analysis in Integrated Catchment Modelling.” PhD diss., Delft University of Technology.
- Nash, J. E., and J. V. Sutcliffe. 1970. “River Flow Forecasting through Conceptual Models Part I—A Discussion of Principles.” Journal of Hydrology 10 (3): 282–290. doi:https://doi.org/10.1016/0022-1694(70)90255-6.
- Ocampo-Martinez, C., A. Ingimundarson, V. Puig, and J. Quevedo. 2008. “Objective Prioritization Using Lexicographic Minimizers for MPC of Sewer Networks.” IEEE Transactions on Control Systems Technology 16 (1): 113–121. doi:https://doi.org/10.1109/TCST.2007.899741.
- Overeem, Aart, Iwan Holleman, and Adri Buishand. 2009. “Derivation of a 10-year Radar-based Climatology of Rainfall.” Journal of Applied Meteorology and Climatology 48 (7): 1448–1463. doi:https://doi.org/10.1175/2009JAMC1954.1.
- Quijano, J.C., Z. Zhu, V. Morales, B.J. Landry, and M.H. Garcia. 2017. “Three-dimensional Model to Capture the Fate and Transport of Combined Sewer Overflow Discharges: A Case Study in the Chicago Area Waterway System.” Science of the Total Environment 576: 362–373. doi:https://doi.org/10.1016/j.scitotenv.2016.08.191.
- Rossman, L.A. 2010. Storm Water Management Model User’s Manual, Version 5.0. Cincinnati: National Risk Management Research Laboratory, Office of Research and Development, US Environmental Protection Agency.
- Schilling, W., B. Andersson, U. Nyberg, H. Aspegren, W. Rauch, and P. Harremoës. 1996. “Real Time Control of Wastewater Systems.” Journal of Hydraulic Research 34 (6): 785–797. doi:https://doi.org/10.1080/00221689609498450.
- Schilperoort, R. P. S. 2011. “Monitoring as a Tool for the Assessment of Wastewater Quality Dynamics.” PhD diss., Delft University of Technology.
- Schütze, M., A. Campisano, H. Colas, W. Schilling, and P. A. Vanrolleghem. 2002. “Real-time Control of Urban Wastewater Systems-where Do We Stand Today?” Journal of Hydrology 299 (1–2): 335–348. doi:https://doi.org/10.1016/j.jhydrol.2004.08.010.
- Schütze, M., M. Lange, M. Pabst, and U. Haas. 2018. “Astlingen–a Benchmark for Real Time Control (RTC).” Water Science and Technology 2017 (2): 552–560. doi:https://doi.org/10.2166/wst.2018.172.
- Schütze, M., V. Erbe, U. Haas, M. Scheer, and M. Weyand. 2008. “Sewer System Real-time Control Supported by the M180 Guideline Document.” Urban Water Journal 5 (1): 69–78. doi:https://doi.org/10.1080/15730620701754376.
- Semadeni-Davies, A., C. Hernebring, G. Svensson, and L.G. Gustafsson. 2008. “The Impacts of Climate Change and Urbanisation on Drainage in Helsingborg, Sweden: Combined Sewer System.” Journal of Hydrology 350 (1–2): 100–113. doi:https://doi.org/10.1016/j.jhydrol.2007.05.028.
- Soriano, L., and J. Rubió. 2019. “Impacts of Combined Sewer Overflows on Surface Water Bodies. The Case Study of the Ebro River in Zaragoza City.” Journal of Cleaner Production 226: 1–5. doi:https://doi.org/10.1016/j.jclepro.2019.04.033.
- Sun, C., L. Romero, B. Joseph-Duran, J. Meseguer, E. Muñoz, R. Guasch, and G. Cembrano. 2020. “Integrated Pollution-based Real-time Control of Sanitation Systems.” Journal of Environmental Management 269: 269. doi:https://doi.org/10.1016/j.jenvman.2020.110798.
- Thomas, G. B., and D. Crawford. 2011. “London Tideway Tunnels: Tackling London’s Victorian Legacy of Combined Sewer Overflows.” Water Science and Technology 63 (1): 80–87. doi:https://doi.org/10.2166/wst.2011.012.
- van Daal-Rombouts, P., G. Gruber, J. Langeveld, D. Muschalla, and F. Clemens. 2017. “Performance Evaluation of Real Time Control in Urban Wastewater Systems in Practice: Review and Perspective.” Environmental Modelling & Software 95: 90–101. doi:https://doi.org/10.1016/j.envsoft.2017.06.015.
- van Daal-Rombouts, P., S. Sun, J. Langeveld, J. L. Bertrand-Krajewski, and F. Clemens. 2016. “Design and Performance Evaluation of a Simplified Dynamic Model for Combined Sewer Overflows in Pumped Sewer Systems.” Journal of Hydrology 538: 609–624. doi:https://doi.org/10.1016/j.jhydrol.2016.04.056.
- van Daal-Rombouts, P. M. M. 2017. “Performance Evaluation of Real Time Control in Urban Wastewater Systems.” PhD diss., Delft University of Technology.
- Vezzaro, L., and M. Grum. 2014. “A Generalised Dynamic Overflow Risk Assessment (Dora) for Real Time Control of Urban Drainage Systems.” Journal of Hydrology 515: 292–303. doi:https://doi.org/10.1016/j.jhydrol.2014.05.019.
- Vezzaro, L., M. L. Christensen, C. Thirsing, M. Grum, and P. S. Mikkelsen. 2014. “Water Quality-based Real Time Control of Integrated Urban Drainage Systems: A Preliminary Study from Copenhagen, Denmark.” Procedia Engineering 70: 1707–1716. doi:https://doi.org/10.1016/j.proeng.2014.02.188.
- Wang, J. 2014. “Combined Sewer Overflows (Csos) Impact on Water Quality and Environmental Ecosystem in the Harlem River.” Journal of Environmental Protection 5 (13): 1373–1389. doi:https://doi.org/10.4236/jep.2014.513131.
- Weijers, S. R., J. De Jonge, O. Van Zanten, L. Benedetti, J. Langeveld, H. W. Menkveld, and A. F. Van Nieuwenhuijzen. 2012. “KALLISTO: Cost Effective and Integrated Optimization of the Urban Wastewater System Eindhoven.” Water Practice and Technology 7 (2). doi:https://doi.org/10.2166/wpt.2012.036.