
 ?Mathematical formulae have been encoded as MathML and are displayed in this HTML version using MathJax in order to improve their display. Uncheck the box to turn MathJax off. This feature requires Javascript. Click on a formula to zoom.
ABSTRACT
Planning the conversion from intermittent to continuous water supply (CWS) is rife with uncertainties. Although scenarios can be used to incorporate uncertainties in planning processes, their development and application to intermittent water supply systems are uncommon. Using drivers of water demand in water supply systems, this study developed four scenarios (business-as-usual, consumption demand management, non-revenue water (NRW) management, and holistic) for water supply systems. The scenarios were applied to the Lusaka water supply network in Zambia. The results showed that the NRW management scenario, which used the projections in the water supply investment master plan for Lusaka, is unsustainable because of insufficient water as the 15% NRW target is practically unattainable by 2035. The holistic scenario is the most sustainable, but the commitment to ensure its occurrence in Zambia is currently lacking. Possibly, donors’ directives can instil the commitment needed to attain the holistic scenario and the conversion to CWS.
Introduction
Conversion of intermittent water supply systems (IWSSs) to continuous water supply systems (CWSSs) is key to solving all problems of IWSSs include problems faced by consumers, society and utilities (Simukonda, Farmani, and Butler Citation2018a). Converting to continuous water supply (CWS) results in increased cost recovery by the utilities, reduced coping costs at household level, improved water quality and availability to consumers and reduced losses in the network as well as wastage at the consumer end (Hastak et al. Citation2017). These present major economic benefits to the concerned society because of the reduced burden and increased time for other activities other than fetching water. Therefore, CWS mode should be the aim by stakeholders of IWSSs because it is a necessary prerequisite for sustainable and technically safe operation of water distribution systems (Klingel and Nestmann Citation2014).
Even though, conversion to CWS) has many benefits, it is not easy to achieve. It is rife with uncertainties due to the complex nature of long planning horizons of water supply systems (WSSs) during which many changes may occur to the WSS’s operating environment (Kang and Lansey Citation2011) and because of the complex nature of IWSSs which are caused and sustained by many interconnected factors (Simukonda, Farmani, and Butler Citation2018a). The main approach to incorporating these uncertainties in the planning process is scenarios (Lansey and Kang Citation2012). Scenarios provide insight into what the future might rather than what the future will be (Butler Citation2004). They provide a means of focusing on possible interactions of the key drivers of change in WSSs at present and in the future. They enable the setting of benchmarks which when met can trigger actions to steer development towards the desired future (Kosow and Gaßner Citation2008). This is premised on the understanding that people’s choices and actions at present and in the future can influence the future (Gallopín et al. Citation1997; Butler Citation2004; Kosow and Gaßner Citation2008).
Scenarios have been developed for many water resource-related problems. For their development, the identification of drivers of change is critical. summarises key drivers that have been used by different authors for scenario development. Gallopín and Rijsberman (Citation2000) developed three global scenarios from which they found that important changes in lifestyles were required to solve the world water problems. Dong, Schoups, and Van De Giesen (Citation2013) reviewed projects that developed water-related scenarios. They showed that the climate system and socio-economic system are the main drivers of change in water systems. Ercin and Hoekstra (Citation2014) developed four global water footprint scenarios using the two axes method. They found that humanity’s water footprint can be reduced to sustainable levels if consumption patterns change. Hunt et al. (Citation2012) used the two axes method to develop four scenarios which helped to understand the technology only policy approach on water consumption management for a regeneration site in the United Citation2014 Kingdom. None of these studies and others in the literature developed scenarios that are applicable to IWSSs. This study developed scenarios that are based on the direct drivers for water demand in WSSs hence applicable to any WSS. The scenarios provide a means for water supply – demand analysis under different demand management strategies which is critical to the evaluation of the adequacy of the water resources. Through this evaluation, scenarios provided a broader view of the extent to which conversion to CWS is feasible and they provide the basis for evaluating the sustainability of strategies for water supply improvement in IWSSs including their conversion to CWS. The scenarios were used to evaluate the sustainability of the water supply improvement plan for the Lusaka water supply network (LWSN) in Zambia.
Table 1. Major water resources drivers of change
Background
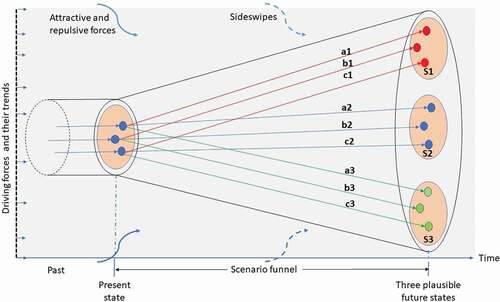
Due to the limited knowledge of the future, scenarios are developed based on assumptions of what direction the trends might take and how these trends might change the state of the system. These assumptions entail many possible future WSS states which increase with the increasing planning horizon resulting in the scenario funnel (). However, for scenarios to be tractable, Godet (Citation2000) limited their number to between four and six. Schwartz (Citation1991) and Hunt et al. (Citation2012) recommended two to four scenarios. For easy explanation here, three scenarios S1, S2 and S3 represent the plausible futures which are arrived at by possible paths a1, b1, c1 for scenario S1, a2, b2, c2 for scenario S2 and a3, b3, c3 for scenario S3 respectively ().
When planning and implementing projects with long planning horizons, there are surprises (sideswipes) such as major natural disasters or global epidemics (Raskin et al. Citation1996) like the Coronavirus disease 2019 that may suddenly change drivers’ trends into the future. It is difficult to imagine the likelihood of the occurrence of sideswipes and to describe them beforehand (Raskin et al. Citation1996). Consequently, the effect of sideswipes on all scenarios is complex and the resilience of the system may provide some mitigation. As shown in , there are also attractive or repulsive forces (attractors), such as consistency with sustainable development principles, which can substantially redirect beliefs, behaviours, policies and institutions towards some futures and away from others (Raskin et al. Citation1996). Showing demonstrable commitments to poverty reduction by the heavily indebted poor countries (HIPC) to qualify for debt relief (United Nations General Assembly Citation2000) was also an attractor. This shows donors’ ability to develop attractors that can direct efforts towards attaining CWS in developing countries where water is in abundance. If the attractors are weak, such that they have no effects on the current drivers, the present scenario continues (Raskin et al. Citation1996; Gallopín et al. Citation1997) as indicated by scenario S2 in .
Figure 1. The interaction of drivers, attractors and sideswipes in the development of the scenario funnel (Adapted from: Raskin et al. Citation1996; Kosow and Gaßner Citation2008).
Scenario development process
The major steps for scenario development are (Schwartz Citation1991; Gallopín Citation2012) (i) characterisation of the current situation, (ii) identification of drivers including predetermined elements and critical uncertainties, (ii) Formulation of the scenario plot, and (iv) construction of the future images.
Characterisation of the current situation requires the knowledge of the past and the current state of the system (WSS) together with the drivers of change and their trends which develop and change the system’s state (Schwartz Citation1991; Gallopín et al. Citation1997; Raskin et al. Citation2002).
The major drivers in (Schwartz Citation1991; Hunt et al. Citation2012) are comprehensive. These drivers encompass the root causes of IWS (Simukonda, Farmani, and Butler Citation2018b). The analysis of the drivers with their predetermined elements and critical uncertainties lead to the building of coherent scenarios. Predetermined elements are drivers’ aspects that are certainly going to take place no matter which scenario occurs, and critical uncertainties are aspects whose evolution is not known with certainty (Schwartz Citation1991). Thus, the backbone of scenarios constitutes the current state, drivers and critical uncertainties (Gallopín et al. Citation1997). From , the major drivers whose critical uncertainties must be considered when planning to convert from IWS to CWS are governance, demographics, economics, social issues (including culture), technology and the environment.
Scenarios plotting starts from the current WSS state. Then, the relevant drivers for the problem being investigated, predetermined elements and critical uncertainties are identified (Gallopín Citation2012). The critical uncertainties form the basis for developing scenario differentiation narratives. To determine the narratives, first, direct and indirect drivers are identified (Cosgrove and Cosgrove Citation2012; Gallopín Citation2012). Regarding water demand, the two direct drivers are consumption water demand and NRW (leakage) (Butler Citation2004). The indirect drivers of water demand are all factors that affect either consumption water demand or NRW or both. These factors include social, demographic, technological, economic and environmental all of which being influenced by governance and politics (Cosgrove and Cosgrove Citation2012; Gallopín Citation2012). The scenario narratives are developed from the key direct drivers’ uncertainties because these provide the basis for defining the multidimensional space within which scenarios are constructed. Each dimension provides the most important attributes of the images of the future (Gallopín Citation2012). If two uncertainties (dimensions) are used, they form two axes that cross to form four quadrants corresponding to four scenarios (Lindgren and Bandhold Citation2003) which include the business-as-usual or baseline scenario (Dong, Schoups, and Van De Giesen Citation2013). This is the two axes scenario development method that has been used by several authors (Lindgren and Bandhold Citation2003; Burdett et al. Citation2006; Hunt et al. Citation2012; Hunt, Jefferson, and Rogers Citation2013; Ercin and Hoekstra Citation2014). For sustainable development, the four scenarios developed from the two axes method can be linked to the four Global Scenario Group (GSG) scenarios (). The scenarios’ future images are constructed from the scenario narratives.
Table 2. Selected global scenarios characteristics (Adapted from: Raskin et al. Citation2002; Rogers et al. Citation2012)
The Global Scenario Group (GSG) scenarios
For sustainable conversion to CWS, the GSG scenarios are important. These are archetype scenarios that apply to the evaluation of project strategies for sustainable development at any scale. The summarised narratives for the four GSG scenarios () enables the identification of the current state of the national or state policies and their implications regarding future planned water supply improvement strategies.
Methodology for scenarios development
Sustainable conversion to CWS requires new relationships and mindsets among all water sector stakeholders (Anand Citation2017). Thus, the development of scenarios for the conversion to CWS, demands that the whole range of relevant drivers and their plausible trends are considered. These could be from the global level through national to the system being analysed level (Lindgren and Bandhold Citation2003). For scenario development, sustainability focuses on the utility’s financial position (prosperity), the environmental impact of the utility operations (planet) and consumer satisfaction (people) which can be assessed using the water supply-demand balance and the WSS pressure conditions.
Predetermined elements and critical uncertainties
For conversion to CWS, water supply increases from the sources are predetermined elements because they follow planned projects usually supported by government entities or donors. Population increase and urbanisation are also predetermined because they are likely to take place in the same way in all scenarios unless drastic developments take place. The critical uncertainties are with the variation of consumption water demand (due to per capita water consumption and per unit area industrial water variations) and NRW levels.
The two axes scenario development method
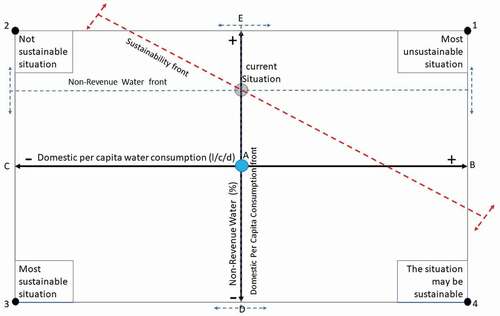
The two axes method was used in this study due to its wide use and ease of replication. The horizontal axis is represented by domestic per capita water consumption (l/c/d), without considering commercial, public and industrial components, because it is the major component of consumption water demand. NRW (%) represents the vertical axis (). Since per capita water consumption and NRW determine the sustainability of water supply, the two axes result in the water supply sustainability quadrilateral ().
Figure 2. The water supply sustainability quadrilateral.
The water supply sustainability quadrilateral
The two axes intersect at point A () which is the reference point and represents the domestic per capita water consumption and NRW values set by the regulator, either through benchmarking or through government directives. The present state of the WSS is at the intersection of the NRW front and the domestic per capita water consumption front. At that point, the sustainability of the WSS can be described and the line passing through the point (parallel to a virtual line joining 2 and 4) is the sustainability front.
Vertex 1 represents the most unsustainable situation because of the highest per capita consumption demand and NRW values. High water consumption when water is inadequate may deprive some consumers of water. It may be a sign of poor tariffs leading to inadequate water sales revenues. High NRW has negative environmental consequences, deprives consumers and water utility of the needed water and revenue respectively. Vertex 2 represents an unsustainable situation because of the negative environmental, social and financial implications of high NRW. Vertex 3 represents the most sustainable situation because low consumption water demand means efficiency in water usage. The low NRW means minimised negative environmental effects, improved utility revenue and water availability to consumers. For vertex 4, the situation may be sustainable because of the low NRW level provided there is adequate water for all consumers and the environment and revenues from water sales ensure the sustainability of the WSS. If the water is inadequate, then it is unsustainable.
In , the reduction of the domestic per capita water consumption or NRW is represented by (−) and an increase is represented by (+). Reduction or increase in the domestic per capita water consumption shifts the domestic per capita water consumption front towards C or B respectively. There is no maximum limit for the domestic per capita water consumption, but there are minimum acceptable limits for basic needs or social wellbeing that determine point C. Reduction or increase of NRW shifts the non-revenue water front towards D or E respectively. Again, there is no set maximum level of NRW, but, the minimum level (point D) is when the Unavoidable Annual Real Losses and Unavoidable Annual Apparent Losses are reached (Mutikanga Citation2012).
helps to qualitatively visualise the implications of water demand management targets set in a bid to improve the water supply situation and its quadrants correspond to the four developed scenarios of water demand management situations. The scenarios are the business-as-usual, consumption demand reduction, NRW management, and the holistic scenario.
The business-as-usual scenario
This scenario is represented by quadrant BEA1 () and corresponds to the MF scenario of the GSG scenarios (). Under this scenario, per capita water consumption (especially among the affluent) and NRW are high. Both consumption demand and NRW are not managed. There are no strict government policies to set water consumption and NRW levels. Utility companies try to reduce NRW for the sake of improving their revenues but are not successful. This makes it possible for NRW (leakage) to worsen to levels determined by the state of the WSS. Connecting water supply to new consumers is a challenge because of urban sprawl ().
The consumption demand management scenario
This scenario is represented by quadrant CAE2 and corresponds to the FW scenario of the GSG scenarios. For this scenario, government policies do not promote sustainability because they do not support intrageneration equity in the use of resources. The few affluent consume more water than the poor masses who leave in poor residential areas. However, because the affluent have private pumping, treatment and water storage facilities, they do not care about the poor state of the WSS. Water demand for the poor masses is reduced by the reduced water supply durations. NRW management is not a priority and it is high in the high-class residential areas. In poor residential areas, NRW (leakage) may be low because of the highly constrained water supply hours, but in general, leakage is high due to the poor state of WSS. Hence, under this scenario, consumption demand is managed while NRW is unmanaged.
The NRW management scenario
This scenario is represented by quadrant BAD4 and corresponds to the PR scenario in developing countries. Government policies are directed towards achieving equitable water distribution, but enforcement is poor. In this regard, the government encourages the extension of WSSs, but water consumption behaviour remains poor. Regulation of consumption water demand is not emphasised such that the affluent use potable water without much care including for watering gardens simply because it is cheap. The reduction of NRW to set levels is emphasised by governments or regulators. Thus, consumption water demand is unmanaged will NRW is managed.
Holistic scenario
This scenario is represented by quadrant DAC3 and corresponds to the NSP scenario of the GSG scenarios. In this scenario, governments are committed to developing and effectively enforcing policies and laws. Consumers adopt water-saving technologies and attitudes. The water utility staff are also motivated and improve their work culture. The occurrence of this scenario depends on the extent to which awareness is raised among the masses and the participation of all stakeholders is encouraged. Under this scenario, both consumption demand and NRW are managed.
Quantification of consumption demand and leakage for the scenarios
For each scenario sc, the district metered area (DMA) consumption demand for a given year (365 days) within the planning horizon is:
Where ,
,
and
are populations in high cost, medium cost, low cost and informal housing respectively,
,
,
and
are high cost, medium cost, low cost and informal housing domestic per capita water consumption per day respectively;
is the per capita public water consumption,
is the public facilities’ population,
is the per capita commercial water consumption,
is commercial facilities’ population,
is per unit area industrial water consumption,
is the DMA total industrial area.
The DMA population in the various housing categories is:
Where is the DMA total population;
is the population of people living in housing type k in the DMA; k represents
,
,
and
housing types.
EquationEquation (1)(1)
(1) is developed for cases where domestic per capita water consumption is assumed to be dependent on the status of the water consumers which is reflected by their occupied housing types. Where such segregation is not practiced, the appropriate domestic per capita water consumption can be used for the entire DMA population.
Assuming that NRW is predominantly leakage hence represented as leakage, projections of DMA NRW () for each scenario are calculated as percentages of the DMA system input volume in a year (
).
The total DMA water demand () is:
The WSS total water demand () is:
The developed methodology is generic and can be applied to any WSS. The total water supply from the sources (system input volume) and the population of consumers each year are the same for all scenarios. For any plan to convert to CWS (including any water supply improvement) will have an aspect of demand management. For consumption demand, there are two sets of values of per capita water demand. The current and the desired future set of values. Using these values in EquationEquation (1)(1)
(1) , gives the managed (reduced) and unmanaged (increased) consumption demand. Similarly, for NRW (leakage), there are two values. The current and the desired future level of NRW. These values are used in EquationEquation (3)
(3)
(3) to determine the level of leakage. The setting of the future desired values are guided by regulator set values, design standards or benchmarking. The exact values to use depends on what the planners feel plausible.
Case study network description
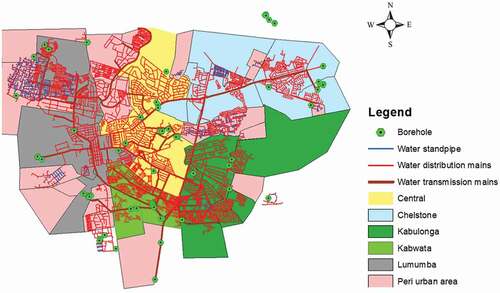
The LWSN has five zones and three peri-urban area agglomerations (). The zones are Lusaka Central, Chelstone, Kabulonga, Kabwata, and Lumumba including Matero. The three peri-urban area agglomerations are peri-urban Eastern, Southern and Western (Simukonda, Farmani, and Butler Citation2018b). Water is supplied intermittently to the zones and peri-urban area agglomerations from the distribution reservoirs and more than 116 boreholes. The zones and peri-urban area agglomerations ration the water between DMAs connected to different sources, through pump and valve operations to balance supply durations (Simukonda, Farmani, and Butler Citation2018a).
Figure 3. Lusaka water supply network.
The LWSN has inadequate water to meet the demands due to three factors: increasing consumption water demand, high non-revenue water (NRW) and the low water treatment plant (WTP) capacity. Over the years, population growth, urbanisation and industrial development have rapidly increased consumption water demand beyond the capacity of the unexpanded water supply and distribution infrastructure.
NWR reduction for all the utilities in Zambia is a problem for which workable solutions are sought (NWASCO Citation2018). For the LWSC, NRW levels are consistently above 40% of the system input volume (Simukonda, Farmani, and Butler Citation2018a). These NRW levels are not only far above the upper acceptable limit of 25% (NWASCO Citation2018) but are also off the target for achieving the intended results of implementing the Water Supply Investment Master Plan for Lusaka city in which the targeted levels of NRW by 2020 and 2035 are 20% and 15% respectively (Republic of Zambia Citation2011).
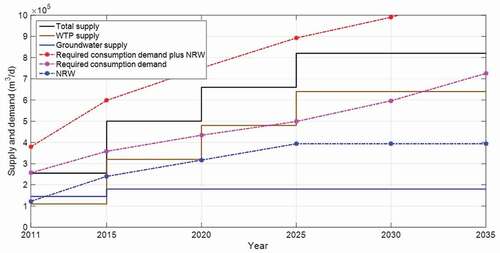
Two factors contribute to the low WTP capacity. The first is its below design capacity operation because of the poor performance of various components that need repairs (Republic of Zambia Citation2011). This aspect is being resolved through the Millennium Challenge Corporation project (Millennium Challenge Account - Zambia Limited Citation2013). The second aspect is that consumption water demand has increased far beyond the WTP design capacity. This will be resolved if plans to build two new WTPs before 2035 materialise. However, the realisation of these plans depends on the investment by the donors or cooperating partners. shows the master plan’s current and projected water production from groundwater and WTPs. With these projected water supplies, international consultants target continuous water supply for LWSN by 2035. However, that target does not exist amongst the local Zambian stakeholders (Republic of Zambia Citation2011; Millennium Challenge Account - Zambia Limited Citation2013).
Table 3. Current and projected total water production (Republic of Zambia Citation2011)
The determination of water demand for all the years shown in was done using EquationEquations (1(1)
(1) )–(Equation5
(5)
(5) ). provide the per capita water consumption data for the various housing types in Lusaka city and their descriptions respectively. The summary of the population in the various housing types in Lusaka City and the Greater Lusaka in 2010 and projected population in 2035 are shown in . The full population details for all the years shown in are provided in Republic of Zambia (Citation2011).
Table 4. Domestic per capita water demands (Republic of Zambia Citation2011)
Table 5. Definition of the housing types (Republic of Zambia Citation2011)
Table 6. Lusaka city and the greater Lusaka 2010 and projected 2035 population (Adapted from: Republic of Zambia Citation2011)
Application of the developed scenarios to the LWSN in Zambia
The four developed scenarios were applied to the LWSN to assess the adequacy of water for water supply improvement from 2011 to 2035. Since the increase in water supply is a predetermined element, the projected phased water supply increases () are the same in the four scenarios. Population increases from 2010 to 2035 and the proportions of people in HC, MC, LC and InfC housing types are also assumed as predetermined elements. For these, the master plan projections (Republic of Zambia Citation2011) are followed. Moreover, public and commercial per capita water consumptions are predetermined and for each scenario, values in the master plan are used. The critical uncertainties are per capita domestic water consumption, NRW levels and the industrial water consumption per unit area (ha). For the consumption demand management and NRW management scenario, industrial water consumption values follow those in the master plan. In what follows, the discussed predetermined elements and critical uncertainties for the LWSN are applied to the individual scenarios.
Business-as-usual scenario
Under this scenario, little or no effort is made to control the water consumption habits of consumers. Thus, domestic per capita water consumption is high. In Zambia, there are no set levels of water consumption or clearly defined policies for efficient water use or consumption water demand management (Republic of Zambia Citation2008). Thus, domestic per capita water consumption values increase from the 2010 values to the ones for 2015–2035 (). Concerning industrial water consumption, the high per unit area consumption value for 2010 (80,000 l/ha/d) continues. Since NRW reduction is still a challenge, it is assumed that it will maintain the 2010 level of 48% (Republic of Zambia Citation2011). For this scenario, NRW can even increase beyond 48%.
The total water supply-demand balance for the planning horizon is shown in . As reflected in the Figure, total water demand exceeds water supply for the entire planning horizon. By 2035, the total water supply deficit is 299,080 m3/d. If the population of 475,313 people in the informal housing type () has individual connections (yard taps) like the low-cost housing as suggested by Ministry of Local Government and Housing, Lusaka City Council and Japan International Cooperation Agency (Citation2009) and envisaged in the Vision 2030 document which states that access to clean and safe water supply should be 100% by 2030 (Republic of Zambia Citation2006), an additional water volume of 28,519 m3/d would be needed thereby increasing the deficit to 327,599 m3/d.
Figure 4. The business-as-usual scenario projected water supply and demand.
The consumption demand management scenario
For this scenario, the per capita domestic water consumption for 2010 () is maintained. The industrial per unit area consumption is also maintained as the one obtained in 2010 (80,000 l/ha/d). There is no effective NWR reduction strategy and as a result, the NRW value of 48% for 2010 continues.
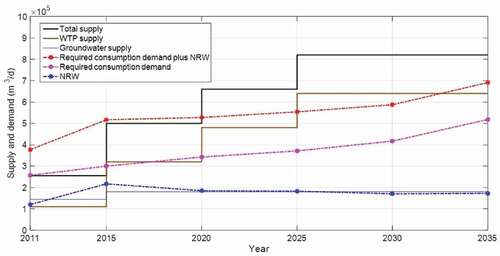
The total water supply-demand balance for this scenario is shown in . The Figure shows that this scenario will result in surplus water between 2025 and 2028. In 2035, there will be a water deficit of 129,190 m3/d. In this case, water demand management is outweighed by the high NRW levels. If the population of 475,313 people in the informal housing type () has individual connections (yard taps) like the low-cost housing, the additional water required would be 19,013 m3/d thereby increasing the deficit to 148,203 m3/d.
Figure 5. The consumption demand management scenario projected water supply and demand.
The NRW management scenario
This scenario corresponds to the approach in the water supply investment master plan for Lusaka city. For this scenario, the domestic per capita water consumptions for 2015–35 () are used. The same as the Zambian design standard per capita consumption. The industrial per unit area water consumption for 2015–2035 (60,000 l/ha/d) is used. The projected NRW percentages for 2011, 2015, 2020, 2025, 2030, and 2035 are 43, 25, 20, 20, 20 and 15 respectively (Republic of Zambia Citation2011)
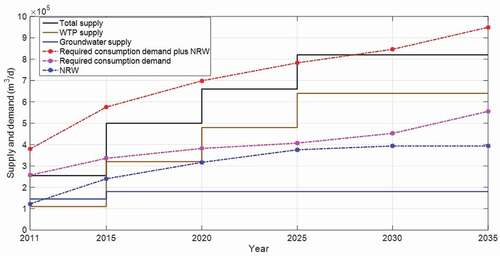
The water supply-demand balance for the NRW management scenario is shown in which shows that this scenario will result in water surplus between 2020 and 2035. The surplus in 2035 will be 10,688 m3/d. However, if the population of 475,313 people in the informal housing type () has individual connections (yard taps) like the low-cost housing, the additional water required would be 28,519 m3/d. This would result in a deficit of 17,831 m3/d. NRW reduction has proved to be a challenge so far. If efforts are made to attain the regulator’s acceptable level of NRW of 25% (NWASCO Citation2018) in 2035, there will be a water supply deficit of 72,915 m3/d. This translates to a deficit of 101,434 m3/d. These water supply-demand balance analyses show that the NRW management scenario is unsustainable as it will result in water deficits in 2035.
Figure 6. The NRW management scenario projected water supply and demand (Adapted from: Republic of Zambia).
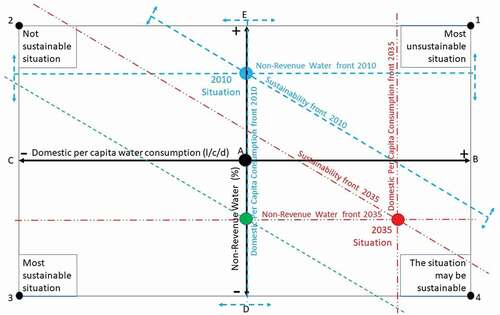
The consequence of this scenario can also be explained qualitatively using the sustainability quadrilateral . For the simplicity of explanations, only values for the High Cost Housing (other housing types are treated the same way) are used here to represent the 2010 and 2015–2035 domestic per capita consumption values ().
For the LWSN, point A () which is the reference point, can be defined by the 2010 per capita domestic water consumption (143 l/c/d) and the regulator acceptable level of NRW (25%). However, due to high NRW, the actual 2010 situation (blue circular spot) is defined by 143 l/c/d and the level of leakage for 2010 which is 48%. Since the 2010 situation domestic per capita water consumption is the same as the reference value, the domestic per capita consumption front coincides with the vertical axis. With respect to point A, the sustainability front passing through the 2010 situation point is in the direction of vertex 1 (). This shows that the 2010 situation is less sustainable than the reference point.
In 2035, the per capita domestic water consumption is 280 l/c/p (for the years 2015–2035 as shown in ). The domestic per capita front is moved towards B to the vertical dotted red line passing through the red spot representing the 2035 situation. Consequently, qualitatively, the 2035 per capita domestic water consumption is less sustainable than the 2010 value because the per capita domestic consumption front is moved towards vertex 1. This is not a good planning target in a world of increasing water scarcity and increasing requirements for consumption demand reducing solutions. Concerning NRW, the NRW front moves from the Non-Revenue Water front 2010 to Non-Revenue Water front 2035 which is passing through the 2035 situation red spot. This represents a huge movement towards vertex 3. This is a desirable move because low levels of NRW mean more social, financial and environmental sustainability. Thus, because of the huge, reduction of NRW, the overall movement of the sustainability front is from the Sustainability front 2010 to the Sustainability front 2035. With respect to the 2010 situation, this movement is towards vertex 3. However, with reference from point A, the Sustainability front 2035 is still in the direction of vertex 1.
If the domestic per capita water consumption was kept at 143 l/c/d, with the huge NRW reduction for the 2035 situation, the movement of the sustainability front was going to be huge also resulting in the green slant dotted line that is passing through the green circular spot. From reference point A, this would result in a huge movement of the Sustainability front towards vertex 3 signifying a more sustainable planning target. This demonstrates how the water supply sustainability quadrilateral can be used to qualitatively visualise the setting of realistic and sustainable targets for water demand management and it shows that the master plan target is not good.
Figure 7. Application of the water supply sustainability quadrilateral to NRW management scenario.
Holistic scenario
Under this scenario, efforts are made to ensure that both water consumption and leakage are controlled. Per capita domestic water consumption values for 2010 () are maintained rather than increasing to the 2015–2035 values. Industrial per unit area consumption is reduced from 80,000 to 60,000 l/ha/d which is the 2015–2035 assumed industrial water consumption. NRW is progressively reduced from 48% in 2010 to the regulator’s acceptable level of 25% in 2035 (NWASCO Citation2018).
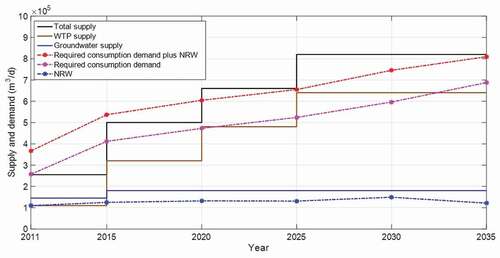
The total water supply-demand balance shows that this scenario will result in a water surplus of 129,300 m3/d in 2035 (). However, if the population of 475,313 people in the informal housing type is made to have yard connections like the low-cost housing, the additional water required would be 19,013 m3/d. This would reduce the water surplus to 110,287 m3/d. Consequently, if this scenario occurred, there would be adequate water to supply the entire population in the city of Lusaka continuously without leaving out some parts of the WSS and the poor. This is not the case with the other scenarios where conversion to CWS is only possible to some parts of the WSS while others remain under IWS mode.
Figure 8. The holistic scenario projected water supply and demand.
Conclusion
Comprehensive planning for the conversion from IWS to CWS depends on how thorough the drivers of change are considered. This is because of the long planning horizons involved during which, their evolution has several uncertainties caused by unpredictable attractors and sideswipes. Scenarios enable the incorporation of these uncertainties. They enable the setting of benchmarks which when met can trigger actions to steer development towards the desired future. This is because the future can be influenced by human choices and actions.
The development of scenarios requires knowledge of the current system state and drivers including their predetermined elements and critical uncertainties. After discussing the scenario making process based on the literature and presenting a summarised comprehensive narrative of the GSG scenarios, four scenarios (the business-as-usual, consumption demand management, NRW management and the holistic) that correspond to the GSG scenarios were developed using the two axes method. The two axes were defined by the two main WSSs’ direct drivers of water demand (domestic per capita water consumption and NRW).
Application of the developed scenarios to the LWSN showed that there is a need to aspire for a better-desired future because the NRW management scenario which represents the master plan desired future is not only unsustainable but also unrealistic. This is because reducing NRW to the set target of 15% is practically unattainable. Moreover, if NRW was to be reduced to 25% which is the regulator’s acceptable NRW level, there would still be a water supply deficit. The holistic scenario is the most sustainable. However, its occurrence is not only dependent on the development of clearly defined water demand management policies or guidelines, but also the commitment to their enforcement. This commitment is currently lacking. Possibly, the meaningful commitment by Zambian stakeholders to attaining the holistic scenario and to championing conversion to CWS can be instilled by donors developed attractors.
Acknowledgements
The authors would like to thank the Commonwealth Scholarship Commission (CSC) for sponsoring PhD studies for the first author (ZMCA- 2015-141). R. Farmani and D. Butler acknowledge support of the Engineering & Physical Sciences Research Council, UK (EPSRC) (EP/K006924/1). The authors are also thankful to the anonymous reviewers for their constructive critiques.
Disclosure statement
No potential conflict of interest was reported by the author(s).
Additional information
Funding
References
- Anand, N. 2017. Hydraulic City: Water and the Infrastructures of Citizenship in Mumbai. Durham: Duke University Press.
- Burdett, L., E. Cooksey, I. Christie, W. Wehrmmey, J. Chenoweth, and R. Clift. 2006. Using Science to Create a Better Place: Environment Agency Scenarios 2030. Bristol: Environment Agency.
- Butler, D. 2004. “Urban Water-Future Trends and Issues.” British Hydrological Society International Symposium on Hydrology: Science and Practice for the 21st Century. 2 vols., 233–242. London, July.
- Cosgrove, E. C., and J. W. Cosgrove. 2012. “The Dynamics of Global Water Futures Driving Forces 2011–2050.” Report on the Findings of Phase One of the UNESCO-WWAP Water Scenarios Project to 205. Paris: UNESCO.
- Dong, C., G. Schoups, and N. Van De Giesen. 2013. “Technological Forecasting and Social Change Scenario Development for Water Resource Planning and Management: A Review.” Technological Forecasting and Social Change 80 (4): 749–761. doi:https://doi.org/10.1016/j.techfore.2012.09.015.
- Ercin A. E., and Hoekstra A. Y. (2014). Water footprint scenarios for 2050: A global analysis. Environment International, 64: 71–82. doi:https://doi.org/10.1016/j.envint.2013.11.019
- Gallopín, G. C., and F. Rijsberman. 2000. “Three Global Water Scenarios.” International Journal of Water 1 (1): 16–40. doi:https://doi.org/10.1504/IJW.2000.002055.
- Gallopín, G. C. 2012. Five Stylized Scenarios. Global Water Futures 2050 Number 01. Paris: UNESCO.
- Gallopín, G., A. Hammond, P. Raskin, and R. Swart. 1997. “Branch Points: Global Scenarios and Human Choice.” PoleStar Series Report No. 7. Stockholm: Stockholm Environment Institute.
- Godet, M. 2000. “The Art of Scenarios and Strategic Planning.” Technological Forecasting and Social Change 65 (1): 3–22. doi:https://doi.org/10.1016/S0040-1625(99)00120-1.
- Hastak, S., P. Labhasetwar, P. Kundley, and R. Gupta. 2017. “Changing from Intermittent to Continuous Water Supply and Its Influence on Service Level Benchmarks: A Case Study in the Demonstration Zone of Nagpur, India.” Urban Water Journal 14 (7): 768–772. doi:https://doi.org/10.1080/1573062X.2016.1240808.
- Hunt, D. V. L., D. R. Lombardi, R. Farmani, I. Jefferson, F. A. Memon, D. Butler, and C. D. F. Rogers. 2012. “Urban Futures and the Code for Sustainable Homes.” Proceedings of the Institution of Civil Engineers - Engineering Sustainability 165 (1): 37–58. doi:https://doi.org/10.1680/ensu.2012.165.
- Hunt, D. V. L., I. Jefferson, and C. D. F. Rogers. 2013. “Scenarios Analysis through a Futures Performance Framework.” Engineering Sustainability 166 (ES5): 258–271. doi:https://doi.org/10.1680/ensu.12.00040.
- Kang, D., and K. Lansey. 2011. “A Scenario-based Optimization Model for Water Supply System Planning.” In World Environmental and Water Resources Congress 2011: Bearing Knowledge for Sustainability, 146–155. doi:https://doi.org/10.1061/41173(414)16.
- Klingel, P., and F. Nestmann. 2014. “From Intermittent to Continuous Water Distribution: A Proposed Conceptual Approach and A Case Study of Béni Abbès (Algeria).” Urban Water Journal 11 (3): 240–251. doi:https://doi.org/10.1080/1573062X.2013.765493.
- Kosow, H., and R. Gaßner. 2008. Methods of Future and Scenario Analysis - Overview, Assessment, and Selection Criteria. Bonn: German Development Institute (DIE).
- Lansey, K., and D. Kang. 2012. “Scenario-Based Multistage Construction of Water Supply Infrastructure.” In Proceedings of the World Environmental and Water Resources Congress 2012, 3265–3274. doi:https://doi.org/10.1061/9780784412312.328.
- Lindgren, M., and H. Bandhold. 2003. Scenario Planning: The Link between Future and Strategy. New York: Palgrave Macmillan.
- Millennium Challenge Account - Zambia Limited. 2013. Preparation of LWSC Sustainability Agreement Baseline Indicators and Annual Technical Audit. Lusaka: Millennium Challenge Account - Zambia Limited.
- Ministry of Local Government and Housing, Lusaka City Council and Japan International Cooperation Agency. 2009. The Study on Comprehensive Urban Development Plan for the City of Lusaka in the Republic of Zambia. vols. Lusaka, Zambia: Japan International Cooperation Agency.
- Mutikanga, H. E. 2012. “Water Loss Management Tools and Methods for Developing Countries.” Dissertation (PhD), Delft University of Technology.
- NWASCO (National Water Supply and Sanitation Council). 2018. Urban and Peri-Urban Water Supply and Sanitation Sector Report 2018. Lusaka: NWASCO.
- Raskin, P., M. Chadwick, T. Jackson, and G. Leach. 1996. The Sustainability Transition: Beyond Conventional Development. Stockholm: Stockholm Environment Institute.
- Raskin, P., T. Banuri, G. Gallopín, and P. Gutman. 2002. “Great Transition: The Promise and Lure of the Times Ahead.” A Report of the Global Scenario Group. Boston: Stockholm Environment Institute.
- Republic of Zambia. 2006. Vision 2030 - A Prosperous Middle-Income Nation by 2030. Lusaka, Zambia: Ministry of National Development Planning.
- Republic of Zambia. 2008. Integrated Water Resources Management and Water Efficiency Implementation Plan. Lusaka: MEWD.
- Republic of Zambia. 2011. Water Supply Investment Master Plan Lusaka. Lusaka: Zambia: Lusaka Water Supply and Sanitation Company (LWSC) Ltd.
- Rogers, C. D. F., D. R. Lombardi, J. M. Leach, and R. F. D. Cooper. 2012. “The Urban Futures Methodology Applied to Urban Regeneration.” Engineering Sustainability 165 (ES1): 5–20. doi:https://doi.org/10.1680/ensu.2012.165.1.5.
- Schwartz, P. 1991. The Art of Long View – Planning for the Future in Uncertain World. New York: Crown Publishing Group.
- Simukonda, K., R. Farmani, and D. Butler. 2018a. “Intermittent Water Supply Systems: Causal Factors, Problems and Solution Options.” Urban Water Journal 15 (5): 488–500. doi:https://doi.org/10.1080/1573062X.2018.1483522.
- Simukonda, K., R. Farmani, and D. Butler. 2018b. “Causes of Intermittent Water Supply in Lusaka City, Zambia.” Water Practice and Technology 13 (2): 335–345. doi:https://doi.org/10.2166/wpt.2018.046.
- United Nations General Assembly. 2000. United Nations Millennium Declaration A/RES/55/2. New York: United Nations. doi:https://doi.org/10.1093/law:epil/9780199231690/e565.