
ABSTRACT
The use of machine learning solutions has been rising recently, and the water domain is reaping several benefits from its application. However, there is still room in the literature regarding machine learning applied to sewer systems. In this article, we study applied solutions to the predictive problem of four factors in the sewer: pipe defects, sedimentation, and failure and blockage events. Even with the number of publications available to solve each problem, there is still a need for improvement. This article aims to identify existing literature gaps through a bibliometric analysis based on data extracted from Scopus and Web of Science. Results show an increasing trend in published papers studying the domain and identify different knowledge gaps within the literature related to the correct use of data, the need for models capable of generalization, and the identification of novel techniques to be studied in the future.
1. Introduction
Sewer systems collect domestic sewage, industrial wastewater, and rainwater from different points of origin to a treatment facility. Combined sewer systems (CSS) consist of pipelines with a wide diameter and carry a mixture of sewage and rainwater that go to wastewater treatment plants or large detention basins. Differently, sewer systems can be separated into sanitary sewers, only carrying domestic and industrial wastewater to a sewage treatment plant, and storm sewers, which carry surface runoff to near water bodies like a river or sea. Wastewater often carries solid sediments, and depending on the type, it can carry fat, oil, and grease (FOG) deposits. These sediments can accumulate in certain parts of the sewer reducing the passage of water and leading to high-risk blockages in the sewer (Ashley, Bertrand-Krajewski, and Hvitved-Jacobsen Citation2005). Moreover, the life-long deterioration of a pipeline can reach the point of failure. These events imply social, economic and environmental damages consequently paid by society itself (Del Mundo and Sutheerawattananonda Citation2017). Hence, their availability is essential to ensure the proper functioning of society.
Water utilities schedule maintenance routines to ensure the state of the sewer, but the cost of these sessions is high. (Tscheikner-Gratl et al. Citation2019) reports the reinvestment in some countries, ranging from 362 million € to 4 billion €, and specifically in the UK, £15 million were annually spent only on reactive blockage clearing (Mills Citation2010). Therefore, research and development of tools to optimize maintenance schedules are of great interest (Montserrat et al. Citation2015). In recent years, the development of machine learning (ML) models has made it possible to solve problems using information-driven algorithms to predict sewer related events. Machine learning algorithms learn from specifically processed data by using internal methods that understand the interrelations of the different variables. A machine learning model is built using specific data sets called ‘train set’ and its predictive behaviour is evaluated using a ‘test set’ or ‘validation set’, usually with no event correlation with the ‘train set’. This methodology implies the need for large historical records to produce the best possible models.
The recorded historical degradation of sewer pipes over time offers trend information that can be learned by an ML model to predict the next failure of a pipe. Most studies use historical inspection reports to identify if a pipe needs immediate attention (Salman and Salem Citation2012). Sediment accumulation in sewers causes flow disruption if no action is taken to clear it. The historical accumulation value, coupled with physical pipe data, can be used to forecast the sediment transport and accumulation, and identify risky zones in the network (Ribalta et al. Citation2021). Moreover, the addition of rainwater and pipe water level information can be used by the ML algorithms to forecast incoming blockages (Hassouna et al. Citation2019).
Although different studies exist on the application of machine learning algorithms, there is no clear future path in the research domain. That is why there is a need for a study that analyses the available publications and detects what future research is needed. A bibliometric analysis is a technique used to analyse statistically scientific articles. It studies the trend of research, authors on the subject, the used keywords, the location of the studies, and much more (Diem and Wolter Citation2013). Therefore, a bibliometric analysis aims to quantitatively evaluate academic articles and authors to identify literature gaps and find opportunities in the research domain. The methodology to attempt this technique is well established and widely used by researchers (Linnenluecke, Marrone, and Singh Citation2020; Moral-Muñoz et al. Citation2020; Donthu et al. Citation2021). To get enough details about scientific articles, data is downloaded from bibliographic databases that index articles from important journals, such as Web of Science or Scopus. Many sectors already have studies evaluating maturity in research and cover a good part of the domain. Durán-Sánchez et al. (Citation2020) analyse the publishing trend in wastewater management using articles from the Web of Science and Scopus, comparing the publications and journals of both engines. Dos Santos et al. (Citation2019) study machine learning applications in the health domain, focusing more on programming languages, ML algorithms, and interest in sub-fields. Tarragona, de Gracia, and Cabeza (Citation2020) gives better emphasis on keyword analysis and the identification of referent publications in the thermal energy storage domain. Bibliometric studies are used in a lot of well-known fields, directing research from a statistical point of view (Shen, Wei, and Sheng Citation2021; Chen et al. Citation2021; Armenta-Medina et al. Citation2020; Akintunde et al. Citation2021).
While there are bibliometric studies on the application of ML solutions in the wastewater sector (Zhao et al. Citation2020), they do not focus on the application in sewer systems. In this study, we analyse articles on the prediction of sewer blockages, failures, sedimentation, and the detection of pipe defects. The aim is to obtain the most used methods, the number of studies that use enough data to train a model and identify the gaps in the application of ML models. Moreover, we provide statistical details regarding authors and article quantity.
2. Methodology
While the bibliometric analysis developed in past scientific publications shows statistical conclusions in different case studies, it also displays a successful application of a methodology. In this study, we define a methodology to optimize our data gathering and statistical analysis processes, based on previous bibliometric studies (Van Eck And Waltman Citation2011; Durán-Sánchez, Álvarez García, and L. C. Del Río-Rama Citation2018; Mustafa et al. Citation2020; Tarragona, de Gracia, and Cabeza Citation2020). It comprises five steps shown in : The research definition, the data extraction process, the data definition, the data analysis and the conclusions.
Figure 1. Methodology diagram.
The research definition step consists in selecting the topic to analyse, defining the aim of our research and planning the steps of the methodology. Machine learning can be applied to a large variety of problems, but as explained by the no free lunch theorem (Wolpert Citation2002) there is probably no better machine learning algorithm to solve a problem. In this step, we select four predictive problems in sewer systems that partially share the data structure between them (Mashford et al. Citation2011; Bailey et al. Citation2016; Ribalta et al. Citation2021), so the advances made in one article within the topic can impact any of these predictive problems.
To extract the data of past articles, we select Web of Science and Scopus as searching tools, as they cover a great number of journals. Google Scholar was also considered, but it has lower quality control and therefore cannot be used as a bibliometric tool (Aguillo Citation2012). Using these engines, a query is refined through different iterations to maximize the number of articles on the desired topic. shows the final version of the query, including a version for each engine, since the syntax for formulating it differs, and a varying number of articles extracted from each database. The query focuses on retrieving articles talking about predictive problems in sewer systems. The keywords ‘fail*’, ‘sediment*’, ‘block*’, ‘defect’, ‘condition’, ‘inspection’, and ‘fault*’ indicate the type of prediction and their suffixes, and the keywords ‘predict*’, ‘detect*’, ‘evaluation’, ‘estimat*’, ‘assessment’, ‘automat*’ and ‘framework’ aim to get the maximum number of predictive articles, although the price to pay is to find articles that are not related to our topic. To ensure only predictive articles are found, we restrict the word distances between prediction and type of prediction keywords to no more than five words away. In earlier iterations, some extracted articles study river sedimentation, and while the river word can appear in our results, the query needs to ensure that the research is not related to river sedimentation prediction. The last constraint evades (to a certain level) the possibility of extracting this sort of research, restricting all articles with the word river and sediment near five words or less.
Table 1. Queries used to extract the publications from Web of Science and Scopus.
Both databases contain several studies that can be duplicated after the data is extracted, so a filtering script removes duplicate data. Moreover, the queries contain a lot of keywords that may combine into articles that are not from the topic, hence producing invalid results. Therefore, a manual review is done to filter these articles and label certain details for each one. While an automatic process could extract labels from each article, a manual review process brings better quality data, and given the number of articles available, we find it appropriate to perform both tasks concurrently. During the labelling process, the article title, abstract, keywords, and body are used. The acceptance criteria during the filtering step follow several points:
The study must propose a solution using machine learning algorithms.
The predictive objective needs to be related to failures, blockages, sedimentation, or defect identification. To specify, we consider failure prediction as any sort of prediction that anticipates the rupture of a pipe. Blockage prediction is considered when the prediction foresees a disruption in the flow of water through the pipe due to the accumulation of substances and objects. Sedimentation is the prediction of sediment accumulation in a pipe or sediment transport through it. Defect identification is related to the identification of abnormalities within the sewer, like cracks, tree roots, fat and oil accumulation, or other any uncommon object.
As for the labelling process, several attributes were gathered for each accepted article:
Sewer type: Sewers can be of the types combined, sanitary, or storm, but in some studies, an experimental pipe might be used, and in some cases, the type might not be indicated within the study. The labels are ‘Not Specified’, ‘Experimental’, ‘Combined’, ‘Sanitary’, ‘Storm’.
Country: The country of origin of the data. If the data being used is experimental and reused from other studies, the location of the corresponding author is used.
Data richness: The data set used to train a machine learning model. The article is labelled as ‘poor data set’ if the data set comes from experimental pipes, the number of registers is less than 1000 in the case of tabular data and less than 4000 images in the case of computer vision, the case study only uses a single sewer pipe, or the data is being created synthetically. Otherwise, the article is labelled as a ‘rich data set’.
Prediction type: The four predictive types selected for the research.
Algorithm: The algorithm used to generate the predictive model.
Boosting process: The methodology used to boost the algorithm predictions. It can range from hyper-parameters optimization techniques to data augmentation techniques.
After processing the extracted data, the bibliometric analysis is carried out, statistically evaluating the number of articles being published each year, which type of predictions are the most researched, the basic quality assessment of the data being used on each study, the location of the studies, the leading journals and publications in the topic and technical keyword evaluation. While most statistics are done using the python language and some reference packages, the technical keyword evaluation is done using the tool VOSviewer (van Eck and Waltman Citation2011). This tool offers a cluster visualization of keywords from the title and abstract of each article, being easier the evaluation of the frequency of appearance and relationship between each keyword visually. The frequency of appearance is represented by the size of the cluster, and the importance of the relationship is defined by the distance between keywords.
Finally, after the bibliometric results are analysed, and the trend of research along with the literature gaps are identified, a conclusion of the future trend in the topic is developed, discussing possible predictive algorithms that can impact future research.
3. Results
Section 3.1 shows the historical trend in predictive approaches for sewer systems and the influence of each type of prediction. The most influential geolocations, journals and individual articles are exposed in Section 3.2. The quality of data is one of the most important things in any machine learning problem since it decides which algorithm needs to be used. Section 3.3 shows the difference in popularity between articles with rich data versus articles with more restricted data, and analyses the use of features in different studies. Finally, the trend in predictive algorithms and their relationship with each type of prediction is shown in Section 3.4 by studying the technical keywords.
3.1. Trend of research in predictive approaches in sewer systems
As previously observed in , a query is defined through different iterations to extract the maximum number of publications related to the topic, with 2478 publications from the Web of Science and 719 from Scopus. After filtering out unrelated articles, only 102 remained, being low the number of publications related to this topic.
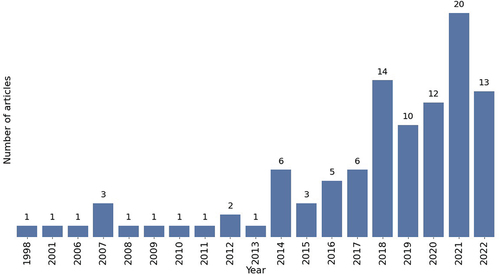
Predictive models for sewer systems have been researched historically since the 90s, and the number of articles published about the topic has increased during the last few years. In the publication trend is shown, and the increase in articles can be seen specifically during the last five years, with a peak of publications in 2021. It is worth saying that for this article, the gathered data are until the middle of 2022, and while this last year has not surpassed the previous one, the publishing trend favours a bigger number. This increasing interest in predictive modelling can be directly related to the machine learning boom, which is also being reflected in other domains (Zhou Citation2017; West et al. Citation2019; Marvin et al. Citation2022).
Figure 2. Number of publications per year.
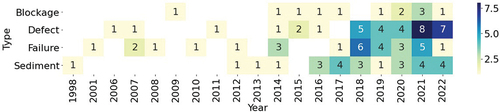
The trend can also be analysed according to the types of prediction. shows a heatmap of the yearly publications. The trending behaviour is shared by the four types, increasing as time goes by, and the peak of publications in 2014, seen in 2, corresponds to a sudden increase in failure prediction type. The biggest number of publications is held by defect detection, which had a large increase in publications between 2018 and 2022, joined by the number of failure studies, which has also increased in the last five years. It is worth mentioning that most computer vision studies focus on multiple defect detection, therefore the trend increment is directly related to the appearance of deep learning techniques in 2018, introduced by (Cheng and Wang Citation2018).
Figure 3. Number of publications by prediction type for each year.
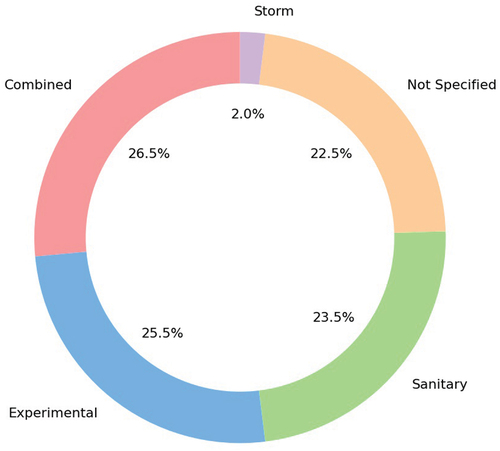
Although the creation of predictive models in sewer systems usually follows the same data pattern (Mashford et al. Citation2011; Bailey et al. Citation2016; Ribalta et al. Citation2021), it is important to mention which type of sewer is being researched in the articles, since physical properties and scenarios may vary between each kind. shows the percentage of sewer types studied in each article. Combined sewer systems are the ones with more articles, followed by experimental pipes and sanitary sewer systems. Storm sewer systems are the less studied, containing only 2% of the studies. Furthermore, 22.5% of the gathered articles do not specify which type of sewer is being studied, bringing uncertainty into assuming which sewer type is the most studied. However, these studies offer strategies and research that are still useful since the predictive objectives are defined and shared.
Figure 4. Percentage of sewer types involved in the studies collected.
3.2. Top researches
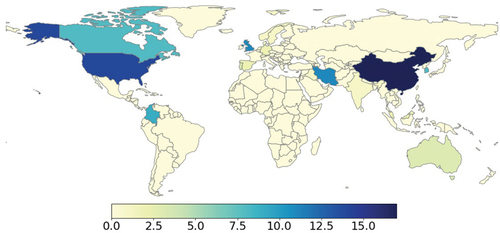
Wastewater treatment quality is different in each country (YCELP, Yale Center for Environmental Law Policy Citation2018) since there are numerous protocols to manage water infrastructures and the budget involved comes directly from the decided economic reinvestment (Tscheikner-Gratl et al. Citation2019). Therefore, the changing dynamics in the different sewer systems demand to study predictive modelling in several locations globally. shows a coloured world map of the countries and their number of publications on the topic. At a general level, the number of publications for countries in South America and Africa is close to none, but the number is high in North American, Asian and European countries, like the United States and China. Therefore, there are a lot of locations worldwide with different water infrastructures that do not research the topic, and it could be very beneficial for global improvement.
Figure 5. Number of publications by country.
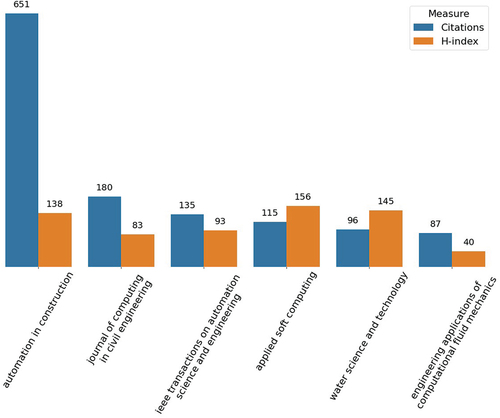
Despite the existence of many water technology journals, it is important to identify which journals have good research on the subject. shows the journals with a higher historical citation count and their h-index. These metrics are calculated using the gathered data, so it is a direct reference of the journal performance in the analysed sub-field. The first thing to notice is the difference between measures ranking. While the Automation in construction journal is ranked first in historical citations, is ranked third when comparing the h-index. It is also worth mentioning that journals have different ages, some of them with 40 years of experience and others, like the Applied Soft Computing Journal, with less than 20 years. Age directly increases the probability of publishing a relevant article and having more citations (De Araújo et al. Citation2012). Finally, the h-index indicates the present impact of publications in the journal, giving an indicator of journals with a higher interest in the scientific community. All the presented journals have relevant metrics and are a clear target for future publications related to the topic.
Figure 6. Most cited journals and their h-index.
To understand the interest of researchers and the possible needs of the topic, it is important to analyse the most impacting studies within the field. explains the objective, the novelty, and the conclusions of the top-cited articles gathered for the analysis. Out of the four types of predictive problems, defect detection appears in three of the five articles, and sediment prediction in the remaining two. This difference in citation number does not reflect a qualitative difference, but a greater interest by the scientific community in these types of predictive problems over the other two. The most famous articles introduce new algorithms and methodologies to the domain. The first study introduces a faster Region-Based Convolutional Neural Network (R-CNN) to detect sewer defects in Closed Circuit Television (CCTV) inspection data, becoming an exemplar of research on how to use deep learning solutions in CCTV problems (Cheng and Wang Citation2018). The second research introduces the Adaptive Neural Fuzzy Inference System (ANFIS) algorithm to predict sediment transport, serving as a starting point for any application of ANFIS within sewer predictive problems (Azamathulla, Ghani, and Fei Citation2012). Similarly, the third (Kumar et al. Citation2018) and fourth (Halfawy and Hengmeechai Citation2014) articles introduce custom CNNs and histograms of oriented gradients with Support Vector Machines (HOG-SVM) to perform defect detection using CCTV data, and the fifth study introduces Artificial Neural Networks (ANN) to predict sediment transport (Ebtehaj and Bonakdari Citation2013). Finally, while these articles present state-of-the-art solutions, the data used to train and calibrate the sediment transport models comes from experimental data, and therefore its application is not evaluated from an overall network perspective.
Table 2. Top five most cited papers.
3.3. Data set quality influence
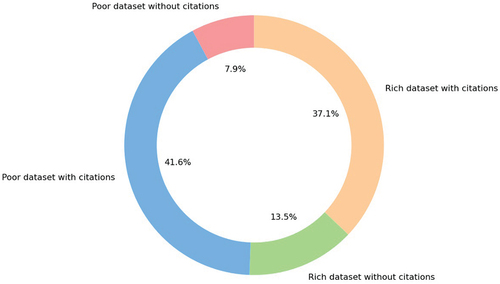
In the previous section, we comment the absence of evaluating models using data from a more real-case scenario. The gathered articles for this study have been tagged in two types, rich or poor data set, considering if the data being used demonstrates a deployment environment for the model or if it is extracted from close conditions like laboratory conditions or produced synthetically. With it, the scientific representation is analysed, counting the number of articles cited for each type of data set and how is it used in each kind of predictive approach. shows a pie chart where articles are shown in four groups: if they have been cited or not and the type of data set used. The figure gives a first indication that the quality of a data set does not guarantee a bigger number of citations for an article. There is a bigger percentage of articles with rich data set that are not being cited over the articles with a poor one. There can be several reasons behind this fact like article age or being the studies using restricted data the ones that show more improvements in data models and innovative algorithms.
Figure 7. Percentage of cited and not cited articles according to the type of the data set used.
The quality of data sets is also linked to the type of predictive approach. shows a Sankey diagram, which depicts the flow rate of data between different categories. In this case, the flow represents the number of articles and goes through three categories: type of sewer, predictive approach, and the type of data set. The aim is to identify how the flow behaves and which divergences should improve. Focusing on the sewer type, we can see that storm sewers lack a lot of research, combined sewers mainly focus on failure prediction, articles that do not specify the sewer type are defect detection and failure prediction studies, sanitary sewers mainly focus on defect detection, and experimental pipe studies focus on sediment prediction. Out of the four predictive approaches, most sediment prediction articles use poor data sets since they are mainly experimental pipe studies, joined by the majority of defect detection studies, which use deep learning algorithms in computer vision studies, but the amount of images being used is not representative enough to give high validity to the model trained. On the other hand, most failure articles use rich data sets, and blockage studies are almost evenly divided between poor and rich.
Figure 8. Relationship between the type of sewer system, the predictive approach, and the type of data set being used in a study.
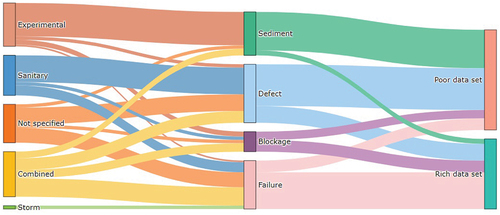
This gives a clear view of the lacking parts for each category. Storm sewers need much more attention, there are not enough blockage studies in comparison to the other predictive problems, and finally, sediment prediction studies are needed in sanitary, combined, and storm sewers. Right now, poor data sets are being used to generate models in the sub-domain of sedimentation, so there is a need for more real case scenarios with richer data sets.
The quality of data can also be considered when taking into account the variables being represented within the data set. The machine learning training process is not only based on the variety and quantity of events being represented within a data set but also which are the features being used to represent these different events. Therefore, analysing the current features being used might indicate some trends and gaps that can be considered from now on. shows the features (rows) being used in all the gathered tabular predictive problems (columns) from 2020 to the middle of 2022. Some studies are excluded from the table because the features used are not easy to replicate and are uncommon. For example, Shakya et al. (Citation2022) use the structural grade of the pipe to predict in their study, and they generate the features based on variables and rules from other studies. The most used features are the pipe diameter, pipe slope, pipe length, sediment properties, water level and flow. All of them are used in all types of predictive problems, except sediment properties, being used in sediment transport problems. Notable features with less representation are rainfall and social surroundings like hospitality impact, population density, and spatial properties (features of near pipes). It is also worth mentioning the initiative of (Okwori, Viklander, and Hedström Citation2021), which introduces labels extracted from CCTV data, merging tabular data with data usually used in computer vision problems.
Table 3. Features used in articles from the last three years.
3.4. Technologies trend
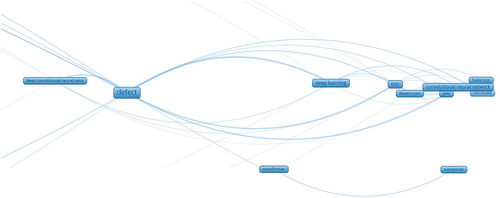
To study which algorithms and methodologies are being used in each predictive approach, a mapping of the technical keywords is shown in a keyword map divided in , generated using the VOSviewer tool and created by Ludo and Nees (Waltman and van Eck Citation2013). The distance between related keywords indicates how often they appear together. If two keywords appear together many times, the distance between them is smaller. The mapping indicates three different clusters, one for sediment prediction, another for defect detection, and a last one with failure and blockage prediction. Each contains the technologies used to predict in each case. While the technology can be related to more than one cluster, it is assigned the colour of the cluster that it has more relationship with.
Figure 9. Technical keywords relationships, left part of the plot.
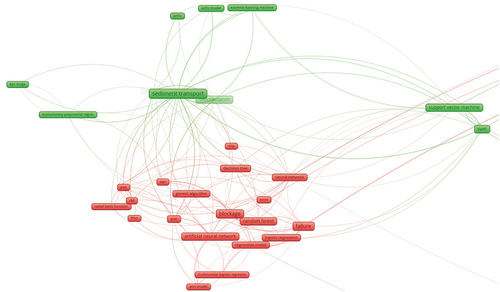
Figure 10. Technical keywords relationships, right part of the plot.
In research, various traditional machine learning techniques are being used, from simple linear models (Chughtai and Zayed Citation2008) to complex ensembled models such as Random Forest or Gradient Boosting (Harvey and McBean Citation2014). Moreover, deep learning architectures are also used, such as ANN, ANFIS, extreme learning machine (ELM) (Azamathulla, Ghani, and Fei Citation2012; Ebtehaj and Bonakdari Citation2013; Hassan et al. Citation2019), and computer vision solutions such as CNN, transformers, and pre-defined architectures such as YOLO, R-CNN, fusion CNN, and Transpcnet (Yin et al. Citation2020; Dang et al. Citation2022; Cheng and Wang Citation2018; Zhou, Ankang, and Zhang Citation2022).
By using the ‘algorithm’ and ‘boosting process’ labels defined at the very beginning of the study, we know which are the most used technologies to solve the predictive problems. Regarding algorithm usage, Random Forest is the most used algorithm with 13% articles using it, followed by CNN and ANN with 12% each, and SVM with 10%. Specific deep learning architectures are also used, specifically 13% well-known customized CNNs like the You Only Look Once algorithm (YOLO) and 6% customized ANNs, like the ANFIS algorithm. Furthermore, some algorithms do not appear in the figures due to their low appearance rate within the whole data, but it is worth mentioning that Extreme Gradient Boosting (XGBoost), Long-Short Term Memory (LSTM), and Gated Recurrent Units (GRU) are being used in one study each.
To enhance the training process of the algorithms, some studies present different methodologies to either synthetically modify data or unconventional model optimization techniques. Specifically, 12% studies present model optimization techniques, ranging from genetic algorithms used during the learning process to result in ensembles, and 11% articles present different data processing techniques for tabular and computer vision data. Therefore, 77% of the articles do not use custom techniques.
4. Future research directions
The studied topic has a long history and an increasing trend, but the number of publications tells us it is not popular compared with other topics (Goh and See Citation2021; Wang, Wei, and Brown Citation2017). The growth in interest would raise competitiveness in the creation of better data-driven models and bring us closer to fully applicable solutions. The bibliometric analysis finds several factors within the gathered articles that indicate current shortcomings within the domain. From the results obtained during the past sections, we identify the current limitations and propose an improvement path, pointing focal points for future research.
The selection of features within tabular data sets impacts the generation of ML models (Khalid, Khalil, and Nasreen Citation2014). Section 3.3 shows the features used in gathered articles of the last three years. As indicated, more than 70% of the studies use variables that indicate the physical characteristics of the sewer pipes, but other variables like social impact, rainfall, or specific information about past maintenance actions are used once or twice. Draude et al. (Citation2020) statistically demonstrate the impact of rain on blockage events, explaining that blockages are more likely to form given longer periods of dry weather, and Ashley et al. (Citation2000) partially work on the effect of rainfall on sediment transport and deposition models. Social impact and hospitality services like restaurants and hotels are sometimes forgotten, but their production of oil and grease residues has a huge impact on the sewer system ageing, sediment accumulation, and blockage risk (Stoll and Gupta Citation1997). Features indicating past actions on a pipe, like cleanings or reparations, give information on the last time a pipe status was updated, being useful to improve the predictions of the probability of events appearing in the future. To predict sewer problems, data on the status and ageing process of the pipe are vital to understanding the evolution of the structure. We recommend the inclusion of these features in future research studies.
Tabular and image data are different types of information, structured in completely different ways. These conditions give rise to two branches of algorithms and methodologies, each evolving in different directions. As previously indicated in Section 3.3, Okwori, Viklander, and Hedström (Citation2021) show the labelling and inclusion of CCTV data to fit their predictive algorithm. The article shows that even though their available information has different formats, it can be processed and used altogether. Following this rule of thought can enable future advances in parts of the literature where the information is currently limiting the possible outcomes of the generated models. Different solutions are being studied and implemented in other domains illustrating different methods to combine different information formats. Pölsterl, Nuno Wolf, and Wachinger (Citation2021) merge magnetic resonance images and low-dimensional tabular information (patient demographics and laboratory measurements) using their designed module named Dynamic Affine Feature Map Transform (DAFT), which can be merged into CNNs architecture to work with both types of data. Furthermore, their study is constantly evolving, and the module can now be merged with CNNs of other domains (Wolf, Pölsterl, and Wachinger Citation2022). This branch of study also focuses on mixing tabular information, images and text. Fathalla et al. (Citation2020) show a deep learning architecture that merges the three types using feed-forward, CNN and LSTM layers.
Deep learning algorithms to solve computer vision problems surged in 2018, as shown in . shows the deep learning architectures used until now, and in Section 3.4 results indicate that YOLO is the most used custom architecture. While these articles compare the final model with other different architectures, some are starting to be compared in the latest studies, like the R-CNN. While YOLO is being used in 6% studies, the algorithm is continuously evolving, and different versions of the architecture can be used, offering better predictions, time performance, or memory size. The gathered studies use YOLO versions 1 to 5, but new architectures still need to be researched. A popular and novel study is the introduction of YOLOX (Zheng et al. Citation2021), an extension that offers a simple design and sometimes better performance than YOLO5. A part of CNN and customized CNN architectures, Vision Transformers (ViT) are starting to enter the stage and can be used in object detection, segmentation, image classification, and action recognition. Popular architectures are VisualBERT (Liunian Harold et al. Citation2021) and VideoBERT (Sun et al. Citation2019), and many architectures are emerging daily (Khan et al. Citation2021).
As shown in Section 3.4, , traditional machine learning algorithms are mainly used in predictive problems related to sedimentation, blockage, and failure, which use tabular data to train the models. Popular algorithms like Random Forest, ANN, and SVM, are the most used in these problems, but the focus that this subset of algorithms receives can produce recurrence and stagnate the evolution of solutions. On the other hand, enhancing the variety of algorithms studied will continue boosting research towards better solutions. Famous algorithms like recurrent neural networks (RNN) (Connor, Martin, and Atlas Citation1994), GRU (Fu, Zhang, and Li Citation2016) and LSTM (Gers, Eck, and Schmidhuber Citation2001) are being used by 2% of the articles, and their use can be increased in future literature. These algorithms perform well in time series-oriented data since their architecture automatically learns time patterns between historical events. Furthermore, Transformers, originally only used in text data, are now starting to be used in images and tabular time series. In 2022, these custom architectures are continuously increasing (Wen et al. Citation2022), and the domain needs studies showing use cases.
The data model is one of the most important assets of a machine learning process (Jain et al. Citation2020), and specifying which conditions are represented is important for the sake of the re-usability of the study (AlShehhi and Wang Citation2020). In Section 3.3 we reflect the use of different data set quality across the predictive problems and sewer types, concluding that the domain is filled with poor quality data studies. This factor limits the training of machine learning models, producing solutions that in most cases are good for the case study presented, but the generalization ability is expected to be low (Doshi-Velez and Kim Citation2018; Jäkel and F Citation2008). This limitation can be addressed by increasing the data quality and quantity. In Section 3.4 the results show that some studies use boosting techniques to improve their model performance, but the majority do not. To be exact, 9 of the 102 synthetically create more data to train the algorithm using oversampling techniques like Random Oversampling, SMOTE, Hidden Markov Models, and computer vision techniques like mosaic data augmentation (and derivatives) or Generative Adversarial Networks (GAN). We suggest testing these techniques in future research where data from the case studies are scarce. Specifically, we would like to highlight the increasing trend of using GAN in data augmentation. The idea behind the methodology is to use two neural networks to contest each other. The generative network must create false information that cannot be identified by the discriminative network, and this second must discern whether the information received is true or false. The architecture was designed originally for computer vision problems but now is used in several domains (Yoon, Jarrett, and van der Schaar Citation2019; Gui et al. Citation2021).
A data model can have a different effect depending on the geographical location or type of the sewer (Brombach, Weiss, and Fuchs Citation2005). Developing countries lack optimized water infrastructures and proper management (Nansubuga et al. Citation2016), which directly increases the variability of the data model and affects the predictive objectives researched. In Section 3.2 the results indicate a higher trend in the research of predictive approaches in developed countries and the lack of publications in developing countries. The data models and algorithms obtained when studying developed countries might not be the perfect solution in locations where water management differs. However, the studied solutions are useful regardless of the country because the developments can be shared and partially reused in all locations. Transfer learning (Pan and Yang Citation2010) in this domain needs to be researched to improve the ability to share and re-use models. Furthermore, the methodology is also used to solve the problem of insufficient training data in deep learning, improving the training process of neural networks (Tan et al. Citation2018).
5. Conclusions
The use of predictive approaches to improve maintenance routines and risk prevention in sewer systems is becoming popular. This paper analyses the research in predicting sediments, blockages, defects or failure in sewers using bibliometric techniques and the data extracted from Scopus and Web of Science. We identify several limitations related to the quality of the data, the type of algorithms being used, and the trained models’ capability to generalize. We offer possible research directions for each limitation identified, such as the inclusion of not-so-used features, the study of tabular and image data altogether, the use of data augmentation techniques in low quantity data situations, the use of novel algorithms, and the needed study of transfer learning techniques to enable model share and re-use.
The data used in each predictive approach plays an important role in training a better model. While in this study the use of features has been analysed, which combination of features is better when training a model is a question that remains open, so analysis is needed to know the ones that combine better for each sewer type and predictive objective. Moreover, a clear division between the algorithms that work better when using rich versus poor data sets should be defined. It should also study which works better when using only rich data sets to have a clear path towards generalistic models.
Although studies of predictions can be shared and re-used among other sewer types, the algorithms proposed should be checked for the other types of predictive objectives and types of sewers, even though they are directly related.
Finally, the evaluation step is really important to score a machine learning model and project the possible impact of the solution. Therefore, it would be interesting to analyse which are the evaluation methods used in the studies and select the best ones for each predictive objective.
Disclosure statement
No potential conflict of interest was reported by the author(s).
Additional information
Funding
References
- Aguillo, I. F. 2012. “Is Google Scholar Useful for Bibliometrics? A Webometric Analysis.” Scientometrics 91 (2): 343–351. doi:10.1007/s11192-011-0582-8.
- Akintunde, T. Y., T. H. Musa, H. H. Musa, I. H. Musa, S. Chen, E. Ibrahim, A. E. Tassang, and M. S. E. D. M. Helmy. 2021. “Bibliometric Analysis of Global Scientific Literature on Effects of COVID-19 Pandemic on Mental Health.” Asian Journal of Psychiatry 63: 102753. doi:10.1016/j.ajp.2021.102753.
- AlShehhi, M., and D. Wang. 2020. “Machine Learning Pipeline for Reusing Pretrained Models.” In Proceedings of the 12th International Conference on Management of Digital EcoSystems, New York, NY, USA, 72–75. Association for Computing Machinery.
- Armenta-Medina, D., T. A. Ramirez-delReal, D. Villanueva-Vásquez, and C. Mejia-Aguirre. 2020. “Trends on Advanced Information and Communication Technologies for Improving Agricultural Productivities: A Bibliometric Analysis”. Agronomy 10(12):1989. 12. doi: 10.3390/agronomy10121989.
- Ashley, R., J.L. Bertrand-Krajewski, and T. Hvitved-Jacobsen. 2005. “Sewer Solids-20 Years of Investigation.” Water Science & Technology 52 (3): 73–84. doi:10.2166/wst.2005.0063.
- Ashley, Richard M, Alasdair Fraser, Richard Burrows, and John Blanksby. 2000. “The Management of Sediment in Combined Sewers.” Urban Water. Sewer Systems and Processes 2 4: 263–275. doi:10.1016/S1462-0758(01)00010-3.
- Atambo, Daniel Ogaro, Mohammad Najafi, and Vinayak Kaushal. 2022. “Development and Comparison of Prediction Models for Sanitary Sewer Pipes Condition Assessment Using Multinomial Logistic Regression and Artificial Neural Network.” Sustainability 14 (9): 5549. doi:10.3390/su14095549.
- Azamathulla, H. Md., A. Ab. Ghani, and S. Y. Fei. 2012. “ANFIS-based Approach for Predicting Sediment Transport in Clean Sewer.” Applied Soft Computing 12 (3): 1227–1230. doi:10.1016/j.asoc.2011.12.003.
- Bailey, J., E. Harris, E. Keedwell, S. Djordjevic, and Z. Kapelan. 2016. “Developing Decision Tree Models to Create a Predictive Blockage Likelihood Model for Real-World Wastewater Networks.” Procedia Engineering 154: 1209–1216. 12th International Conference on Hydroinformatics (HIC 2016) - Smart Water for the Future, Incheon, South Korea. https://www.sciencedirect.com/science/article/pii/S1877705816318227
- Brombach, H., G. Weiss, and S. Fuchs. 2005. “A New Database on Urban Runoff Pollution: Comparison of Separate and Combined Sewer Systems.” Water Science and Technology 51 (2): 119–128. doi:10.2166/wst.2005.0039.
- Chen, Y., L. Cheng, R. Lian, Z. Song, and J. Tian. 2021. “COVID-19 Vaccine Research Focusses on Safety, Efficacy, Immunoinformatics, and Vaccine Production and Delivery: A Bibliometric Analysis Based on VOSviewer.” BioScience Trends advpub: 2021.01061.
- Cheng, Jack C.P., and Mingzhu Wang. 2018. “Automated Detection of Sewer Pipe Defects in closed-circuit Television Images Using Deep Learning Techniques.” Automation in Construction 95: 155–171. doi:10.1016/j.autcon.2018.08.006.
- Chughtai, F., and T. Zayed. 2008. “Infrastructure Condition Prediction Models for Sustainable Sewer Pipelines.” Journal of Performance of Constructed Facilities 22 (5): 333–341. doi:10.1061/(ASCE)0887-3828(2008)22:5(333).
- Connor, J.T., R.D. Martin, and L.E. Atlas. 1994. “Recurrent Neural Networks and Robust Time Series Prediction.” IEEE Transactions on Neural Networks 5 (2): 240–254. doi:10.1109/72.279188.
- Dang, L. Minh, Hanxiang Wang, Li Yanfen, N. Nguyen Tan, and Hyeonjoon Moon. 2022. “DefectTR: End-to-end Defect Detection for Sewage Networks Using a Transformer.” Construction and Building Materials 325: 126584. doi:10.1016/j.conbuildmat.2022.126584.
- De Araújo, C. G. S., B. R. R. De Oliveirade Oliveira, L. V. De Oliveira Brito, T. T. Da Mattada Matta, B. F. Viana, C. P. de Souza, R. de Carvalho Guerreiro, F. A. Slama, and E. Da matta mello Portugal. 2012. “Two-year Citations of JAPPL Original Articles: Evidence of a Relative Age Effect.” Journal of Applied Physiology 112 (9): 1434–1436. doi:10.1152/japplphysiol.01491.2011.
- DEl Mundo, D.M.N., and M. Sutheerawattananonda. 2017. “Influence of Fat and Oil Type on the Yield, physio-chemical Properties, and Microstructure of Fat, Oil, and Grease (FOG) Deposits.” Water Research 124: 308–319. doi:10.1016/j.watres.2017.07.047.
- Diem, A., and S.C. Wolter. 2013. “The Use of Bibliometrics to Measure Research Performance in Education Sciences.” Research in Higher Education 54 (1): 86–114. doi:10.1007/s11162-012-9264-5.
- Donthu, N., S. Kumar, D. Mukherjee, N. Pandey, and W. M. Lim. 2021. “How to Conduct a Bibliometric Analysis: An Overview and guidelines.” Journal of Business Research 133: 285–296. doi:10.1016/j.jbusres.2021.04.070.
- Doshi-Velez, F., and B. Kim. 2018. Considerations for Evaluation and Generalization in Interpretable Machine Learning, 3–17. Cham: Springer International Publishing.
- Dos Santos, B. S., M. T. A. Steiner, A. T. Fenerich, and R. H. P. Lima. 2019. “Data Mining and Machine Learning Techniques Applied to Public Health Problems: A Bibliometric Analysis from 2009 to 2018.” Computers Industrial Engineering 138: 106120. doi:10.1016/j.cie.2019.106120.
- Draude, Sabrina, Edward Keedwell, Rebecca Hiscock, and Zoran Kapelan. 2020. “A Statistical Analysis on the Effect of Preceding Dry Weather on Sewer Blockages in South Wales.” Water Science and Technology 80 (12): 2381–2391. doi:10.2166/wst.2020.063.
- Durán-Sánchez, A., J. Álvarez García, E. González-Vázquez, and M. C. Del Río-Rama. 2020. “Wastewater Management: Bibliometric Analysis of Scientific Literature.” Water 12 (11): 2963. doi:10.3390/w12112963.
- Durán-Sánchez, A., J. Álvarez García, and M. D. L. C. Del Río-Rama. 2018. “Sustainable Water Resources Management: A Bibliometric Overview.” Water 10 (9): 1191. doi:10.3390/w10091191.
- Ebtehaj, I., and H. Bonakdari. 2013. “Evaluation of Sediment Transport in Sewer Using Artificial Neural Network.” Engineering Applications of Computational Fluid Mechanics 7 (3): 382–392. doi:10.1080/19942060.2013.11015479.
- Ebtehaj, Isa, Hossein Bonakdari, Amir Hossein Zaji, and Bahram Gharabaghi. 2021. “Evolutionary Optimization of Neural Network to Predict Sediment Transport without Sedimentation.” Complex Intelligent Systems 7 (1): 401–416. doi:10.1007/s40747-020-00213-9.
- Fathalla, Ahmed, Ahmad Salah, Li Kenli, Li Keqin, and Piccialli Francesco. 2020. “Deep end-to-end Learning for Price Prediction of second-hand Items.” Knowledge and Information Systems 62 (12): 4541–4568. doi:10.1007/s10115-020-01495-8.
- Fontecha, J. E., P. Agarwal, M. N. Torres, S. Mukherjee, J. L. Walteros, and J. P. Rodríguez. 2021. “A Two-Stage Data-Driven Spatiotemporal Analysis to Predict Failure Risk of Urban Sewer Systems Leveraging Machine Learning Algorithms.” Risk Analysis: an Official Publication of the Society for Risk Analysis 41 (12): 2356–2391. doi:10.1111/risa.13742.
- Fu, R., Z. Zhang, and L. Li. 2016. “Using LSTM and GRU Neural Network Methods for Traffic Flow Prediction.” In 2016 31st Youth Academic Annual Conference of Chinese Association of Automation (YAC), Wuhan, China, 324–328.
- Gers, F. A., D. Eck, and J. Schmidhuber. 2001. “Applying LSTM to Time Series Predictable through Time-Window Approaches.” In Artificial Neural Networks — ICANN 2001, edited by Georg Dorffner, Horst Bischof, and Kurt Hornik, 669–676. Berlin, Heidelberg: Springer Berlin Heidelberg.
- Goh, K. H., and K. F. See. 2021. “Twenty Years of Water Utility Benchmarking: A Bibliometric Analysis of Emerging Interest in Water Research and Collaboration.” Journal of Cleaner Production 284: 124711. doi:10.1016/j.jclepro.2020.124711.
- Gui, Jie, Zhenan Sun, Yonggang Wen, Dacheng Tao, and Ye. Jieping 2021. “A Review on Generative Adversarial Networks: Algorithms, Theory, and Applications.“ IEEE Transactions on Knowledge and Data Engineering 1: 1. doi:10.1109/TKDE.2021.3130191.
- Halfawy, Mahmoud R., and Jantira Hengmeechai. 2014. “Automated Defect Detection in Sewer Closed Circuit Television Images Using Histograms of Oriented Gradients and Support Vector Machine.” Automation in Construction 38: 1–13. doi:10.1016/j.autcon.2013.10.012.
- Harvey, R. R., and E. A. McBean. 2014. “Predicting the Structural Condition of Individual Sanitary Sewer Pipes with Random Forests.” Canadian Journal of Civil Engineering 41 (4): 294–303. doi:10.1139/cjce-2013-0431.
- Hassan, S. I., L. M. Dang, I. Mehmood, S. Im, C. Choi, J. Kang, Y. Park, and H. Moon. 2019. “Underground Sewer Pipe Condition Assessment Based on Convolutional Neural Networks.” Automation in Construction 106: 102849. doi:10.1016/j.autcon.2019.102849.
- Hassouna, M., M. Reis, M. Al Fairuz, and A. Tarhini. 2019. “Data-Driven Models for Sewer Blockage Prediction.” 2019 International Conference on Computing, Electronics Communications Engineering (iCCECE), London, United Kingdom, 68–72.
- Jain, A., H. Patel, L. Nagalapatti, N. Gupta, S. Mehta, S. Guttula, S. Mujumdar, S. Afzal, R. Sharma Mittal, and V. Munigala. 2020. “Overview and Importance of Data Quality for Machine Learning Tasks.” In Proceedings of the 26th ACM SIGKDD International Conference on Knowledge Discovery amp; Data Mining, New York, NY, USA, 3561–3562. Association for Computing Machinery.
- Jäkel, Schölkopf B. Wichmann, and F.A. F. 2008. “Generalization and Similarity in Exemplar Models of Categorization: Insights from Machine Learning.” Psychonomic Bulletin Review 15: 256–271. doi:10.3758/PBR.15.2.256.
- Jiang, Yiqi, C. Chaolin, Yituo Zhang, Ruobin Zhao, Kefen Yan, and Wenhui Wang. 2021. “Data-driven Method Based on Deep Learning Algorithm for Detecting Fat, Oil, and Grease (FOG) of Sewer Networks in Urban Commercial Areas.” Water Research 207: 117797. doi:10.1016/j.watres.2021.117797.
- Khalid, Samina, Tehmina Khalil, and Shamila Nasreen. 2014. “A Survey of Feature Selection and Feature Extraction Techniques in Machine Learning.” In 2014 Science and Information Conference London, United Kingdom, 372–378.
- Khan, S., M. Naseer, M. Hayat, S. Waqas Zamir, F. Shahbaz Khan, and M. Shah. 2021. “Transformers in Vision: A Survey.“ arXiv. arXiv:2101.01169.
- Kumar, Srinath S., Dulcy M. Abraham, Mohammad R. Jahanshahi, Tom Iseley, and Justin Starr. 2018. “Automated Defect Classification in Sewer Closed Circuit Television Inspections Using Deep Convolutional Neural Networks.” Automation in Construction 91: 273–283. doi:10.1016/j.autcon.2018.03.028.
- Linnenluecke, MK., M. Marrone, and AK. Singh. 2020. “Conducting Systematic Literature Reviews and Bibliometric Analyses.” Australian Journal of Management 45 (2): 175–194. doi:10.1177/0312896219877678.
- Li, L. H., Mark Yatskar, Da Yin, Cho-Jui Hsieh, and Kai-Wei Chang. 2021. “VisualBERT: A Simple and Performant Baseline for Vision and Language.“ arXiv. arXiv:1908.03557v1.
- Marvin, H. J.P., Y. Bouzembrak, H.J. Van der Fels-Klerx, C. Kempenaar, R. Veerkamp, A. Chauhan, S. Stroosnijder, et al. 2022. “Digitalisation and Artificial Intelligence for Sustainable Food Systems.” Trends in Food Science Technology 120: 344–348. doi:10.1016/j.tifs.2022.01.020.
- Mashford, J., D. Marlow, D. Tran, and R. May. 2011. “Prediction of Sewer Condition Grade Using Support Vector Machines.” Journal of Computing in Civil Engineering 25 (4): 283–290. doi:10.1061/(ASCE)CP.1943-5487.0000089.
- Mills, P. 2010. “FOGs Build up and Removal: Problems and Solutions.” http://www.policyconsulting.co.uk/downloads/FOGs_Cranfield_March2010.pdf
- Montes, Carlos, Luigi Berardi, Zoran Kapelan, and Juan Saldarriaga. 2020a. “Predicting Bedload Sediment Transport of non-cohesive Material in Sewer Pipes Using Evolutionary Polynomial Regression – Multi-objective Genetic Algorithm Strategy.” Urban Water Journal 17 (2): 154–162. doi:10.1080/1573062X.2020.1748210.
- Montes, Carlos, Zoran Kapelan, and Juan Saldarriaga. 2021. “Predicting non-deposition Sediment Transport in Sewer Pipes Using Random Forest.” Water Research 189: 116639. doi:10.1016/j.watres.2020.116639.
- Montes, Carlos, Hachly Ortiz, Sergio Vanegas, Zoran Kapelan, Luigi Berardi, and Juan Saldarriaga. 2022. “Sediment Transport Prediction in Sewer Pipes during Flushing Operation.” Urban Water Journal 19 (1): 1–14. doi:10.1080/1573062X.2021.1948077.
- Montes, Carlos, Sergio Vanegas, Zoran Kapelan, Luigi Berardi, and Juan Saldarriaga. 2020b. “Non-deposition self-cleansing Models for Large Sewer Pipes.” Water Science and Technology 81 (3): 606–621. doi:10.2166/wst.2020.154.
- Montserrat, A., L. Bosch, M. Kiser, M. Poch, and L. Corominas. 2015. “Using Data from Monitoring Combined Sewer Overflows to Assess, Improve, and Maintain Combined Sewer Systems.” Science of the Total Environment 505: 1053–1061. doi:10.1016/j.scitotenv.2014.10.087.
- Moral-Muñoz, J. A., E. Herrera-Viedma, A. Santisteban-Espejo, and M. J. Cobo. 2020. “Software Tools for Conducting Bibliometric Analysis in Science: An up-to-date Review.” Profesional de la Información 29 (1). doi:10.3145/epi.2020.ene.03.
- Mustafa, H. M., G. Hayder, A. Mustapha, K. F. Kushiar, S. M. Tahir, and E. H. O. Elsadig. 2020. “Bibliometric Analysis of Sediment Concentration Prediction Using Artificial Neural Network.” Journal of Energy and Environment 12 (2).
- Nansubuga, I., N. Banadda, W. Verstraete, and K. Rabaey. 2016. “A Review of Sustainable Sanitation Systems in Africa.” Reviews in Environmental Science and Bio/Technology 15 (3): 465–478. doi:10.1007/s11157-016-9400-3.
- Okwori, E., M. Viklander, and A. Hedström. 2021. “Spatial Heterogeneity Assessment of Factors Affecting Sewer Pipe Blockages and Predictions.” Water Research 194: 116934. doi:10.1016/j.watres.2021.116934.
- Pan, S. J., and Q. Yang. 2010. “A Survey on Transfer Learning.” IEEE Transactions on Knowledge and Data Engineering 22 (10): 1345–1359. doi:10.1109/TKDE.2009.191.
- Pölsterl, Sebastian, Tom Nuno Wolf, and Christian Wachinger. 2021. “Combining 3D Image and Tabular Data via the Dynamic Affine Feature Map Transform.” International Conference on Medical Image Computing and Computer Assisted Intervention (MICCAI), Strasbourg, France, 688–698.
- Ribalta, M., C. Mateu, R. Bejar, E. Rubión, L. Echeverria, F. J. Varela Alegre, and L. Corominas. 2021. “Sediment Level Prediction of a Combined Sewer System Using Spatial Features.” Sustainability 13 (7): 4013. doi:10.3390/su13074013.
- Robles-Velasco, Alicia, Pablo Cortés, Jesús Muñuzuri, and Luis Onieva. 2021. “Predicting Non-deposition Sediment Transport in Clean Pipes: Assessing Heuristic Models.” OR Spectrum 43 (3): 759–776. doi:10.1007/s00291-020-00614-9.
- Rosin, T. R., Z. Kapelan, E. Keedwell, and M. Romano. 2022. “Near real-time Detection of Blockages in the Proximity of Combined Sewer Overflows Using Evolutionary ANNs and Statistical Process Control.” Journal of Hydroinformatics 24 (2): 259–273. doi:10.2166/hydro.2022.036.
- Salman, B., and O. Salem. 2012. “Failure of Wastewater Collection Lines Using Various Section-Level Regression Models.” Journal of Infrastructure Systems 18 (2): 146–154. doi:10.1061/(ASCE)IS.1943-555X.0000075.
- Shakya, Deepti, Mayank Agarwal, Vishal Deshpande, and Bimlesh Kumar. 2022. “Estimating Particle Froude Number of Sewer Pipes by Boosting Machine-Learning Models.” Journal of Pipeline Systems Engineering and Practice 13 (2): 04022012. doi:10.1061/(ASCE)PS.1949-1204.0000643.
- Shen, C., M. Wei, and Y. Sheng. 2021. “A Bibliometric Analysis of Food Safety Governance Research from 1999 to 2019.” Food Science & Nutrition 9 (4): 2316–2334. doi:10.1002/fsn3.2220.
- Stoll, Uwe, and Hani Gupta. 1997. “Management Strategies for Oil and Grease Residues.” Waste Management Research 15 (1): 23–32. doi:10.1177/0734242X9701500103.
- Sun, Chen, Austin Myers, Carl Vondrick, Kevin Murphy, and Cordelia Schmid. 2019. “VideoBERT: A Joint Model for Video and Language Representation Learning.“ arXiv. arXiv:1904.01766.
- Tan, Chuanqi, Fuchun Sun, Tao Kong, Wenchang Zhang, Chao Yang, and Chunfang Liu. 2018. “A Survey on Deep Transfer Learning.” Artificial Neural Networks and Machine Learning – ICANN 2018 11141: 270–279.
- Tarragona, J., A. de Gracia, and L. F. Cabeza. 2020. “Bibliometric Analysis of Smart Control Applications in Thermal Energy Storage Systems. A Model Predictive Control Approach.” Journal of Energy Storage 32: 101704. doi:10.1016/j.est.2020.101704.
- Tavakoli, Razieh, Ali Sharifara, and Mohammad Najafi. 2020. “Prediction of Pipe Failures in Wastewater Networks Using Random Forest Classification.” 90–102.
- Tscheikner-Gratl, F., N. Caradot, F. Cherqui, J. P. Leitão, M. Ahmadi, J. G. Langeveld, Y. Le Gat, et al. 2019. “Sewer Asset Management – State of the Art and Research Needs.” Urban Water Journal 16 (9): 662–675. DOI:10.1080/1573062X.2020.1713382.
- Van Eck, N. J., and L. Waltman. 2011. “Text Mining and Visualization Using VOSviewer.” ArXiv.
- Waltman, L., and N. J. van Eck. 2013. “A Smart Local Moving Algorithm for large-scale modularity-based Community Detection.” The European Physical Journal B 471: 86.
- Wang, L., Y. Wei, and M. A. Brown. 2017. “Global Transition to low-carbon Electricity: A Bibliometric Analysis.” Applied Energy 205: 57–68. doi:10.1016/j.apenergy.2017.07.107.
- Wen, Qingsong, Tian Zhou, Chaoli Zhang, Weiqi Chen, Ma Ziqing, Junchi Yan, and Liang Sun. 2022. “Transformers in Time Series: A Survey.“ arXiv. arXiv:2202.07125.
- West, E., S. Mutasa, Z. Zhu, and R. Ha. 2019. “Global Trend in Artificial Intelligence–Based Publications in Radiology from 2000 to 2018.” American Journal of Roentgenology 213 (6): 1204–1206. doi:10.2214/AJR.19.21346.
- Wolf, Tom Nuno, Sebastian Pölsterl, and Christian Wachinger. 2022. “DAFT: A Universal Module to Interweave Tabular Data and 3D Images in CNNs.” NeuroImage 260: 119505. doi:10.1016/j.neuroimage.2022.119505.
- Wolpert, D. H. 2002. The Supervised Learning No-Free-Lunch Theorems, 25–42. London: Springer London.
- YCELP, Yale Center for Environmental Law Policy. 2018. “Wastewater Treatment Ranking.” https://epi.yale.edu/epi-indicator-report/WWT
- Yin, Xianfei, Yuan Chen, Ahmed Bouferguene, Hamid Zaman, Mohamed Al-Hussein, and Luke Kurach. 2020. “A Deep learning-based Framework for an Automated Defect Detection System for Sewer Pipes.” Automation in Construction 109: 102967. doi:10.1016/j.autcon.2019.102967.
- Yoon, J., D. Jarrett, and M. van der Schaar. 2019. “ Time-series Generative Adversarial Networks.“ Advances in Neural Information Processing Systems 32 (NeurIPS 2019) Vol. 32, Vancouver, Canada.
- Yosefvand, Fariborz, Ahmad Rajabi, and Saeid Shabanlou. 2022. “Predicting Non-deposition Sediment Transport in Clean Pipes: Assessing Heuristic Models.” Iranian Journal of Science and Technology, Transactions of Civil Engineering 46 (1): 615–629. doi:10.1007/s40996-021-00766-w.
- Zhao, L., T. Dai, Z. Qiao, P. Sun, J. Hao, and Y. Yang. 2020. “Application of Artificial Intelligence to Wastewater Treatment: A Bibliometric Analysis and Systematic Review of Technology, Economy, Management, and Wastewater Reuse.” Process Safety and Environmental Protection 133: 169–182. doi:10.1016/j.psep.2019.11.014.
- Zheng, Ge, Songtao Liu, Feng Wang, Li Zeming, and Jian Sun. 2021. “YOLOX: Exceeding YOLO Series in 2021.” arXiv preprint arXiv:2107.08430 .
- Zhou, Z. 2017. “Machine Learning: Recent Progress in China and beyond.” National Science Review 5 (1): 20. doi:10.1093/nsr/nwx132.
- Zhou, Yunxiang, Ji Ankang, and Limao Zhang. 2022. “Sewer Defect Detection from 3D Point Clouds Using a transformer-based Deep Learning Model.” Automation in Construction 136: 104163. doi:10.1016/j.autcon.2022.104163.