
 ?Mathematical formulae have been encoded as MathML and are displayed in this HTML version using MathJax in order to improve their display. Uncheck the box to turn MathJax off. This feature requires Javascript. Click on a formula to zoom.
ABSTRACT
Uncontrolled wastewater discharges have social and environmental consequences and generate increased operational costs. Wastewater treatment plants (WWTPs) are vulnerable infrastructure and require the implementation of risk and safety analyses in the context of climate change and flooding. Therefore, making decisions in changing weather conditions is one of the most important but also most difficult tasks for operators to maintain proper management of wastewater infrastructure facilities. The aim of the research was to develop a decision-making tool based on soft sensor methods to allow inflows to be classified into two classes of WTTP operating conditions. The quality of the regression models was maintained at 90.0%, while the classifier based on the coarse decision tree had a testing accuracy of 92.4%. The results can contribute to a reduction in wastewater load, which is significant in the context of ongoing climate change, and to an improvement in WWTP operation through automation.
1 Introduction
Refined climate scenarios indicate that climate change is progressing at both global and local scales (IPCC Citation2021). The observed warming of the climate has implications for an increase in the intensity and frequency of rainfall and droughts. Precipitation patterns are changing, with a shift from low-intensity continuous precipitation to intensive rainfall, which in temperate climates occurs mainly in spring and summer. Intensive rainfall is becoming an increasing challenge for growing cities, which in Poland concentrate about 60.0% of the population and are particularly exposed to the negative consequences of meteorological extremes. In highly urbanized areas, where there has been a significant loss of natural retention, the problem of rainwater management is becoming more and more important. The increasing number of flash floods in urban areas caused by intensive rainfall is notable (Yuan et al. Citation2019; Yuan, Tu, and Su et al. Citation2021). These conditions affect not only the population quality of life decline in urban agglomerations, but also the functioning of related infrastructure (Olds et al. Citation2018). This is particularly true for water distribution systems and wastewater disposal, including wastewater treatment plants (WWTPs), extremely important elements in cities (Koop, Koetsier, and Doornhof et al. Citation2017).
From a quantitative perspective, WWTPs are overloaded during periods of long-lasting heavy rainfall by wastewater collected by combined sewer systems (CSS). It is estimated that during days with precipitation within 10.0 dm3/m2 about 20.0% more rainwater in wastewater is flowing into WWTPs (Nowobilska-Majewska, Kotowski, and Bugajski Citation2020) and the amount of accidental water as a proportion of the total amount of wastewater flowing into the plant ranges from 9.6% to 34.1% (Bugajski, Nowobilska-Majewska, and Majewski Citation2021). Increased inflows during heavy and prolonged rainfall events force WWTPs to discharge wastewater containing large amounts of fats, oils, grease, splash, organic matter and other micropollutants directly to rivers via system bypasses (Dittmer, Bachmann-Machnik, and Launay Citation2020; Hughes, Cowper-Heays, and Olesson et al. Citation2021; Mohammed et al. Citation2022). Increased uncontrolled discharges as well as wastewater quality deterioration have social and environmental consequences, and generate increased operational costs (Reznik et al. Citation2020; Kareem et al. Citation2021). As estimated by Bugajski, Nowobilska-Majewska, and Majewski (Citation2021), the annual cost of treating accidental wastewater at WWTPs averages €340,000 per year. Sun, Nazari, and Karimi et al. (Citation2021) showed that the WWTPs are subjected to damage ranging from USD60000to 720 000, depending on the size of the WWTP and the extremity of storm surge. The seriousness of the situation is reinforced by the fact that the operation of WWTPs under different meteorological conditions, forced by climate change, should be considered as shock conditions, i.e. significant changes in a system’s boundary conditions, occurring in a relatively short period of time (Plósz, Liltved, and Ratnaweera Citation2009). This type of situation must be dealt with by wastewater treatment plants in order to ensure the reliability of technical infrastructure functioning at the highest possible level, regardless of meteorological phenomena. For these reasons, the implementation of climate change adaptation strategies is increasingly recognized as necessary to maintain proper management of wastewater infrastructure facilities. Examples of such actions include continuous monitoring of the quantitative parameters at the treatment plant and the use of methods that allow to assess the impact of meteorological conditions on the quantitative parameters, and consequently the development of procedures for the treatment plant.
Bypass discharge monitoring and now-casting prediction (Termite, Bonamente, and Garinei et al. Citation2021) can largely reduce the discharge of wastewater through combined sewer overflows (CSOs) directly into the river, according to Icke, van Schagen, and Huising et al. (Citation2017) by up to half. Nowadays, soft computing models and soft sensors represent state-of-the-art solutions aimed at process monitoring and fault detection in WWTPs, and they are undoubtedly a component of sustainable smart cities in the operation of an intelligent sewage treatment (Miao, Zhou, and AlQahtani et al. Citation2021). The literature in that field identifies two main streams related to the application of computational intelligence, soft computing models, and soft sensors in the analysis of data from WWTPs. The first stream is concerned with wastewater quality models at different stages of treatment, making predictions for parameters such as biochemical oxygen demand (BOD), chemical oxygen demand (COD), or total suspended solids (TSS) (Khambete and Christian Citation2014; Cheng, Harrou, and Kadri et al. Citation2020; Hvala and Kocijan Citation2020). The second line of analysis (soft sensors) is, in turn, related to quantitative predictions of influent flow of WWTPs (Wei and Kusiak Citation2015), taking into account different variants of weather conditions (Boyd et al. Citation2019; Nowobilska-Majewska, Kotowski, and Bugajski Citation2020). The purpose of quantitative models related to influent flow in WWTPs is to identify conditions and prevent situations in which WWTPs may become overloaded, especially the biological part associated with the activated sludge (AS) process. Furthermore, their important aim is also to determine when wastewater is necessary to discharge through CSOs to the river, ultimately minimizing their number and possibly modifying the treatment process (Jin, You, and Ji Citation2016). In this regard, methods such as autoregressive integrated moving average (ARIMA) (Boyd et al. Citation2019) used in hybrid with the multilayer perceptron neural network (Zhang, Li, and Snowling et al. Citation2019), deep neural networks such as bidirectional long short-term memory (bi-LSTM) (Kang et al. Citation2020), or random forest (RF) (Zhou et al. Citation2019), among others, have been used. On the other hand, Szeląg et al. (Citation2017) showed that the best quality model with respect to quantitative data for a specific case study can be obtained through the k-nearest neighbour (k-NN) method, RF and SVM (support vector machine).
Despite the many methods available and the increasing multidirectional implementation of smart city and urban computing in the aspect of WWTPs, the number of studies conducted in relation to the impact of weather-related parameters on the performance of WWTPs is still limited (Abdulla and Farahat Citation2020; Alsulaili and Refaie Citation2021). This mainly concerns the demonstration of which of the parameters that are predictors have the greatest impact on obtaining the best quality models, especially when some of them are correlated with each other. As a standard, the authors of the studies conducted so far divide the measurement periods into dry and wet weather (Bugajski, Nowobilska-Majewska, and Majewski Citation2021; Icke, van Schagen, and Huising et al. Citation2017), but the question of whether, in addition to precipitation, other meteorological parameters significantly influence the performance of soft sensors is not answered. Furthermore, the study by Xenochristou et al. (Citation2018) shows the variability of water consumption from weather conditions, especially temperature and radiation. Meanwhile, this parameter is not considered in the analyses, despite the fact that domestic and industrial water consumption generates influent flow on WWTPs. Miao, Zhou, and AlQahtani et al. (Citation2021) consider the lack of professional supervision and maintenance of the wastewater sewage treatment process as another major problem in optimizing WWTP management. These issues are an important factor to maintain optimal operating conditions and avoid future operation failures. Therefore, optimizing the operation of WWTPs, avoiding operational failures, but most of all minimizing wastewater discharges by CSOs directly into rivers, become a necessity in adapting this sector of urban wastewater utilities to changing local weather conditions and technical conditions, including continuous expansion of sewer infrastructure, affecting the increase of influent flow to WWTPs.
The researcher’s main hypothesis was to find out whether there was an optimal set of predictors for forecasting influent flow to WWTP, and if so, which variables allowed the best prediction accuracy. Among the many input data sets for modelling, the one that achieves the best prediction accuracy was selected and implemented in the decision trees to determine the boundary of the problem for the influent flow. Furthermore, it was verified whether the applied methods of computational intelligence, including decision trees, are capable of helping WWTP managers in decision-making processes. Presented research contributes to improving the safety and reliability of WWTP and the combined sewer system through reliable short-term forecasts and is the first step towards automating the operation of CSOs.
The aim of the research was to develop a decision-making tool based on soft sensor methods to assist operators in making key decisions in WWTP. To achieve the main objective, analyses were performed that led to optimization of the set of predictors in the context of model quality improvement using general regression models (GRM) and the Hellwig method, also known as the method of information capacity indicators, which is based on the correlation between predictors and target data. Based on selected supervised learning algorithms, a classification of the working condition of the WTTP that makes up the case study was carried out. The final stage of the research was to create a decision tree aimed directly at the needs of WTTPs operators, allowing the classification of inflows into the group of standard influxes and those that generate emergency discharge of wastewater by CSOs to the river. As part of the research, among the many variants of input data, it was possible to select the optimal set of predictors (current rainfall, precipitation of the preceding day, and inflow to WTTPs preceding day) and develop a decision tree for WTTP operators. This type of research is intended to familiarize and prepare wastewater infrastructure facilities managers, such as WWTPs, to use modern tools to control CSOs during rainfall periods and to develop a procedure to deal with such situations.
In summary, the main contributions of this research are as follows:
i) determining the best set of predictors using general regression models (GRM) and Hellwig method for influent flow to WWTPs modelling,
ii) influent flow forecasting with regression models: linear regression, regression trees, support vector machines, Gaussian process regression, tree ensembles and neural networks,
iii) building a decision tree for the identification of overloads in the WWTPs.
2 Materials and methods
2.1. Case study – WWTP in Świdnica
The WWTP in Świdnica (Poland, Lower Silesian Voivodeship) covers an area of more than 21 km2 in the city of Świdnica and serves a total of approximately 57.000 residents of the city and an additional 10.000 residents of the surrounding rural areas. The designed capacity of the wastewater treatment plant is determined by the capacity of its biological part, however, usually at the inflow of about 20.000 m3/d the CSOs are activated in order to relieve the plant.
In case of higher inflows, during rainy weather, the biological part is protected by a gate valve located within the mechanical part, which is currently operated manually by WWTP operators. This valve, depending on its degree of opening, decides on the amount of wastewater accepted by the biological part of the WWTP. During rainless weather, all wastewater is received by the biological part. During long-lasting periods of precipitation or intense rainfall events, excess wastewater after mechanical treatment is discharged through an outlet that serves as a storm overflow for the WWTP. Typical operational problems for this WWTP relate to meeting the limit on the number of storm overflow discharges and the volume of wastewater. In the event of larger precipitations, there is also a risk of washing out the microorganisms of the activated sludge at its maximum load. The infrastructure of Świdnica is provided with municipal sanitary sewage collection systems, rainwater sewers, and combined sewers. The development of the city is being observed in the direction of slow resignation from the combined sewage system in favour of designing and building the sanitary and storm sewage system.
2.2. Soft computing modelling
The research steps are presented on the methodology flow chart (). At the beginning (Step I), three databases consisting of actual and past wastewater influent flow to the WWTP, system input water volume, and meteorological daily time series were collected. Subsequently (in Step II), general regression models (GRM) and Hellwig method were used to select optimal combinations of input variables between weather and operational parameters for wastewater influent flow modelling. In the third step, based on the best set of predictors, regression predictive models were created. Finally (Step IV), the classification learner was allowed to carry out decision modelling.
Figure 1. The methodology flow chart.
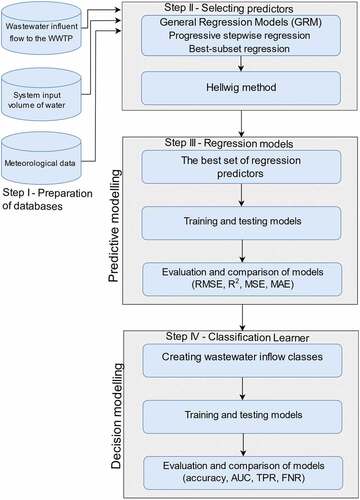
2.2.1 STEP I – The datasets preparation
The input database prepared for the analyzes is a set of daily time series of influent flow to the WTTP and the volume of water injected into the water supply system. The precipitation level data came from the nearest gauge station, located approximately 4 km from the WWTP. Other meteorological data such as maximum, minimum, mean air temperature, minimum temperature at ground surface, and cloud cover came from the station about 40 km away. The measurement period covered data from 01–01-2018 to 31–07-2021.The primary database was divided into a learning set that covered 70.0% of the data (01–01-2018 to 08–04-2020) and a test set that represented 30.0% of the measurements (09–04-2020 to 31–03-2021). After developing the models, additional data validation was performed for the time series from 01–04-2021 to 31–07-2021.
Influent flow to WWTP (InF) was the dependent variable. The sets of operational predictors of WWTP, in different configurations, comprised such quantities as daily system input volume of water (InW), system input volume of water day before (InW-1), influent flow to WWTP day before (InF-1). The meteorological predictors were maximum, minimum, mean air temperature (tmax, tmin, tmean, respectively), minimum temperature at the ground surface (tmin0) and cloud cover (C-C), precipitation (P), precipitation the day before (P-1), and in the occurrence or absence of precipitation on the current and the day before, P(0–1) and P(0-1)-1, respectively. The exploitation data were obtained from Świdnica Water Supply and Sewerage Company and meteorological data from the Institute of Meteorology and Water Management – National Research Institute (IMGW-PIB).
2.2.2 STEP II – Selection of the predictors
In the next stage of the analysis, the rank of each predictor was clarified, its degree of correlation was recognized, and the best set of explanatory variables was found, which was used to build classification models and a decision tree in the next stage. The GRM multivariate linear regression model was used to analyze the multivariate data. It is designed to examine the relationship between factors (predictors, explanatory variables) and a specific dependent variable, the so-called modelled variable. The regression model allowed us to find factors that have a statistically significant effect on the dependent variable and to select the best quality linear model. The general form of the regression model can be written as follows:
where:
– modelled variable (dependent);
– explanatory variables (predictors);
– coefficient, unknown, needs to be estimated;
– random variables, which are affected by the immeasurability of some factors, their unawareness or inaccuracy of measurement.
The study used quantitative and qualitative variables from the input database. The dependent variable was the influent flow to WTTP, which was modelled based on the aforementioned explanatory variables. Standard approach (correlation coefficients), progressive stepwise regression, and best-subset regression were used to select the predictors by which the best quality model was derived.
In addition, the Hellwig method was used to select the best combination of inputs for prediction models. This method is otherwise known as the method of information capacity indicators (Hellwig Citation1968). Its high efficiency, confirmed in the literature (Kajewska-Szkudlarek and Łyczko Citation2021; Omiotek et al. Citation2019; Szmidt, Kacprzyk, and Bujnowski Citation2020; Wójcik-Leń, Leń, and Mika et al. Citation2019), was the reason for applying it in the research.
The idea of the method is to use input variables strongly correlated with the target variable and, at the same time, weakly dependent on each other. Moreover, there is a numerical criterion, the so-called integral capacity of the combination of information carriers. Information carriers are all explanatory variables.
For all combinations received, the individual capacity of information carriers was defined according to the following formula.
where:
– variable number in the set of predictors;
– correlation coefficient of the potential explanatory variable number j with the explained variable (element of the vector of linear correlation coefficients between the explanatory variables and the explained variable R0);
- correlation coefficient between i-th and j-th potential explanatory variables (elements of the correlation coefficients matrix between potential explanatory variables R).
HQ measures the magnitude of the information that the variable Xj gives about variable Y in combination. When rj increases, HQ increases, whereas it decreases when the variable Xj is more correlated with the other explanatory variables.
After calculating the capacity of individual information carriers for all possible combinations, the integral capacity of information carriers was calculated according to the formula:
where:
– number of predictors;
– variable number in the set of predictors;
- individual capacity of information carriers.
The integral capacity of the information carriers for the combination is the sum of the individual capacities of the information carriers which belong to this combination. It is the criterion for choosing the appropriate combination of explanatory variables, and the chosen is the one with the highest HQ (Hellwig Citation1968).
The number of all potential predictor combinations resulted from the formula:
where:
– number of predictors (input variables);
– number of combinations.
In the case of 12 predictors it is equaled as follows:
2.2.3 STEP III – Predictive modelling
In the next step of the research, on the basis of various combinations of sets of predictors, regression models of the operating state of WWTP were built, taking into account the optimal sets of predictors extracted in the previous step. Linear regression models, regression trees, support vector machines, Gaussian process regression, ensembles of trees, and neural networks were used to build regression models.
The quality assessment was based on the squared correlation (R2) for the actual and prognostic values, mean squared error (MSE) and the root mean square error (RMSE) as well as the mean absolute error (MAE) of the models according to the following formulas. For the best-subset regression approach, Mallows’ coefficient CP was applied.
where:
– number of observations;
– predicted data;
– average value of predicted data;
- observed data;
- average value of observed data.
2.2.4 STEP IV – Decision modelling
To implement the classifiers, two classes of WWTP condition were created, with influent flow as the grouping variable. The purpose of this stage of the study was to classify the inflows into two groups, that is, standard inflows to the WWTP and those generating emergency discharge through CSOs into the river. The threshold separating the two groups of WWTP operating conditions was an influent flow of about 20,000 m3/d, since operational data show that such inflows typically discharge CSOs into the river in excess of 1,000 m3/d. It should be noted that the valve regulating the amount of wastewater discharge is currently opened manually by WWTP staff when the specific amount of wastewater inflow to the WWTP is undetermined, and hence the above value is approximate. When the load is high, WWTP usually has a problem in maintaining the activated sludge of the biological section in proper condition.
The basis of modern data exploration techniques are solutions using artificial intelligence. These can include machine learning. A number of methods based on classifiers, which are in the group of machine learning solutions, are based on finding a rule for unambiguous prediction of a given observation to the appropriate group. In this research, decision trees, also known as classification trees, were used to build classifiers (Mahesh Citation2020). The primary goal of using this group of methods is to build a tree with as few nodes as possible and a single vertex (called root), which allows to obtain simple rules describing the division of the data set into groups. This method requires a measure of class diversity in a node of the tree, a measure of the difference between the diversity of classes in a given node and its subordinate nodes, and an algorithm for maximizing the aforementioned difference. The quality of the tree is judged by its size; that is, the less number of nodes it has and the less extensive it is, the better the accuracy. Each node of the decision tree is responsible for one of the selection options, and its edges indicate the assignment of specific WWTP operating conditions to relatively normal or those generating emergency discharge by CSOs.
In addition to the percentage accuracy to the corresponding WWTP condition group, Receiver Operating Characteristic (ROC) curves were used to evaluate the quality of the classifier. The ROC curve expresses the True Positive Rates TPR, which is placed on the axis called the ‘sensitivity’, and the False Positive Rate FPR (called the ‘specificity’). In the classification framework, there is a need to determine the optimal cut-off point of the ROC curve, which indicates the balance between the sensitivity parameter and the specificity of the classifier. The area under the ROC curve (AUC) parameter is used to evaluate the quality of the classifier as the area under the ROC curve plot (Brzeziński and Stefanowski Citation2017). An AUC parameter closer to unity indicates that the classifier has a better accuracy. AUC in the range of 0.5–1.0 is assumed to characterize a very good accuracy, with values closer to unity being the most desirable. AUC below 0.5 indicates poor accuracy of the classifier.
3 Results
3.1. Selection of the predictors
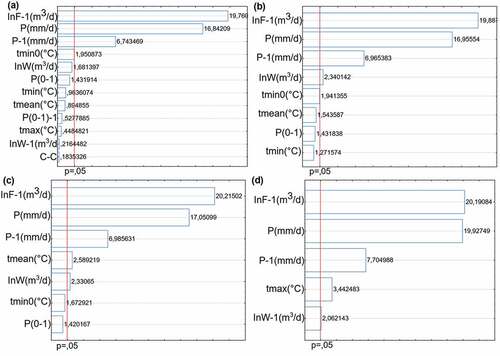
From the Pareto charts () it can be observed that the parameters with p < 0.05 are influent flow day before (InF-1), precipitation (P) and precipitation day before (P-1). The most significant parameters are influent flow day before (InF-1) and precipitation day before (P) as evidenced by the t-test values of 19.760 and 16.842, respectively. The best subset regression, based on R2, indicates the amount of water injected into the water supply system (InW) as an additional parameter with a significant level of significance. On the other hand, the best subset regression, based on CP, indicates minimum temperature in addition to In-W. Using progressive stepwise regression, it was shown that the most significant set of predictors are influent flow day before (InF-1), precipitation (P), precipitation day before (P-1), maximum temperature (tmax) and amount of water injected into the water distribution system day before (InW-1).
Figure 2. Pareto charts for (a) all variables (b) the best-subset regression based on R2 (c) the best-subset regression based on Mallows’ CP (d) progressive stepwise regression.
The best set of predictors according to the Hellwig method is the same as for GRM and also includes influent flow day before (InF-1), precipitation (P), and precipitation day before (P-1) as indicated by the HQ of 0.5068. contains 10 the best and worst combinations of predictors according to the HQ index. It can be observed that the most frequent variable among the least optimal combinations of predictors is the temperature data (minimum, mean, and maximum). This is due to the fact that these parameters are highly correlated with each other.
Table 1. Results of the selection of Hellwig method predictors.
A summary of the most optimal predictor groups, extracted using both the GRM and Hellwig method is shown in , taking into account the best combinations of predictors. Hellwig method from I to IV means the first four best sets from . Moreover, for verification purposes, three additional types of predictor sets were added, using regression learner. shows that the most frequently typed parameters, in most of the used methods, are InF-1, P-1 and P. Occasionally, in 5 out of 14 models, the parameter In-F appears, and twice each InW-1, tmax and tmean.
Figure 3. Proposals of considered predictor sets for building regression models.
In addition to precipitation data, Zhou et al. (Citation2019) hinted at the need to implement weather characteristics and domestic water use patterns in the models, but the latter is not usually considered, as indicated by literature studies. Both the GRM and Hellwig methods have shown that in the variables of best data sets, the water quantity in the distribution system are also significant. This issue is different when building models of WWTPs performance based on qualitative data, as in this case the most commonly considered parameter is influent temperature (Alsulaili and Refaie Citation2021; Cheng, Harrou, and Kadri et al. Citation2020). However, as Dadar et al. (Citation2020) points out, the most important parameter in predicting the quality of wastewater was the amount of inflow, so building a model with good quality influent flow data is crucial in assessing the performance status of WWTP. Quality studies of wastewater treatment process comprise many literature reports on the configuration of appropriate sets of predictors (Hejabi et al. Citation2021), but it is worth noting that the analyses with respect to influent flow quantity studies are limited.
3.2. Predictive modelling
Based on the set of predictors selected in the previous step, influent flow regression models were constructed for WWTP. The accuracy statistics of each model for specific sets of predictors are summarized in .
Table 2. Quality of influent flow regression models based on selected predictor sets.
The best model quality with R2 = 0.55 in the test set was obtained by Quadratic SVM for the InF, InF-1, P and P-1 data (grey line in ). When comparing the R2 value with other studies including Zhou et al. (Citation2019), where R2 = 0.58, it can be concluded that the results are similar and as for environmental data reliable. The lowest R2 (0.19–0.28) were obtained for regression models that were built for their own types of data set containing only precipitation variables and In-F referenced to the current day. This is due to the fact that influent flow to the WWTP is delayed relative to emerging precipitation, so many studies have chosen to include the influent flow parameter even for the 2 days prior to the current day (Zhou et al. Citation2019; Miao, Zhou, and AlQahtani et al. Citation2021). Since the city sewer system that makes up the case study is not very extensive in area, it was decided to consider only the influent flow one day before.
The methods that are most often used as the ones with the best quality of the test set model include ensemble bagged trees and SVM methods. In the literature, we can also find the use of methods in quantitative modelling, including random forest (Zhou et al. Citation2019) with R2 = 0.58, for short-term forecasts ARIMA R2 = 0.57 (Zhang, Li, and Snowling et al. Citation2019) and a dynamic neural network (Wei and Kusiak Citation2015). Due to the analysis of different case studies in the literature and the use of different types of predictor sets, the results obtained by other authors with those presented in this paper cannot be clearly compared. However, the quality of fitting regression models that the authors obtained, adopting the evaluation criterion of Miao, Zhou, and AlQahtani et al. (Citation2021), seems to be satisfactory and possible to implement within the framework of intelligent wastewater treatment given the current lack of professional supervision and maintenance of the sewage treatment process in the analyzed WWTP.
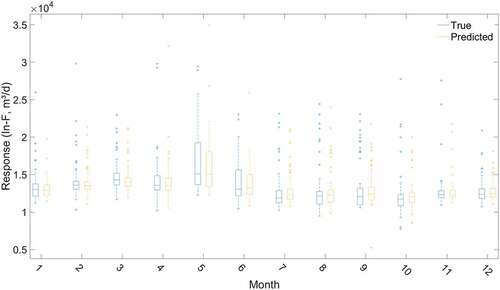
presents the true and predicted influent flow for WWTP in individual months, obtained on the basis of the quadratic SVM model. The largest spread of actual inflows to the WWTP is observed for the months of May and June, which is associated with significant variability in precipitation in the analyzed period. Similarly, a reflection of this situation can be seen in the prediction data set, for which the box has an InF lower bound of 12,248 m3/d and an upper bound of 34,954 m3/d. A fairly significant number of outlier points can be observed for the autumn months, i.e. September-October, and less for the winter period, December-January. The best quality of the model was achieved for months that are fairly predictable and stable in terms of precipitation, such as February and April. However, for the peak periods of In-F to WTTP such as July-August, the true and predicted influent flows are also the same and are within similar limits of the wastewater treatment plant inflows.
Figure 4. True and predicted influent flow to WTTP in each month for Quadratic SVM.
3.3. Decision modelling
The final stage of the research was the construction of a classification model on the loading of WTTP with inflowing wastewater. Using different types of decision tree methods, it was assessed which of them most accurately classifies WTTP states into those belonging to standard influent flows and those causing overload of WWTP. For this purpose, the coarse tree, medium tree and fine tree algorithms were implemented. The results showed that the best quality of learning and testing was achieved for the coarse tree (95.50% and 92.40%, respectively), followed by the medium tree (94.80% for the learning set, 92.20% for the test set). The fine tree showed similar model quality with a fit score of 94.80% for the learning set and a slightly lower quality for the test set of 91.10%. Due to the above results, the coarse tree was adopted for further analysis.
The best learning quality was obtained for the set selected through GRM – all effects, which included variables such as P, P-1, and InF-1. For the same data set, based on an additional validation set April-July 2021, the model was evaluated to verify whether an equally high percentage of accuracy would be achieved for the new data set. Ultimately, a model accuracy of 89.90% was obtained for the validation set from this period, indicating very good quality. The AUC for the test and validation set model created from P, P-1, and InF-1 was 0.77 and 0.76, respectively, indicating that a good fit of the classifier was achieved.
When comparing the individual sets of best predictors obtained by different methods, it is evident that the worst quality at the level of 90.2% and 91.3% for the test set was obtained for the sets developed on the basis of own selection and Hellwig Method I, respectively. The best testing quality at the level of 92.4% was achieved for the models whose predictors were selected by GRM, the other Hellwig methods and regression learner. It should be noted that the quality of the selected classifiers does not finally fall below 90.0%, which proves that each time the construction of regression or classification models should be preceded by the selection of an optimal set of predictors, especially when variables may be correlated.
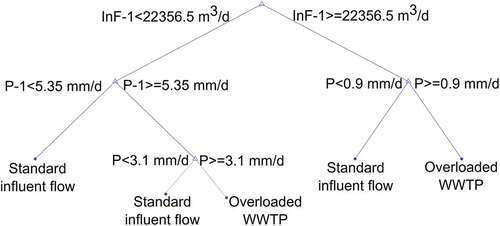
With the knowledge derived from the previous stages of analysis regarding the selection of the best input data set (InF-1, P and P-1), the current influent flow on standard and causing overload of WWTP was classified. A decision tree () was constructed that can clearly assist WWTP operators in making key decisions. At the top of the tree is the magnitude of InF-1, which is the first variant of WWTP state prediction. It can be seen that the limit is an InF-1 of 22,356.5 m3/d. If inflows of this magnitude or greater are recorded at this particular WWTP on the preceding day, the key consideration becomes the current day precipitation, which can be determined using meteorological forecasts for the area. If rainfall in excess of 0.9 mm/d is forecasted, operators can expect an overloaded WWTP, which requires the discharge of excess wastewater after mechanical treatment by CSOs into the river. The second branch for InF-1 less than 22,356.5 m3/d arrives at the precipitation magnitude parameter for the previous day. If it was equal to or greater than 5.35 mm/d and, at the same time, precipitation greater than 3.1 mm/d is forecast for the current day, overloaded WTTP can be expected again. In other situations, the WTTP operating condition is predicted to qualify as a standard wastewater load and thus there will be no need for CSOs to discharge wastewater and no dangerous flushing of activated sludge microorganisms (Oliviera et al. Citation2020). The extracted decision tree is not extensive, which is its undoubted advantage, not only from a mathematical point of view but, above all, its transparency for those who are to make key decisions at WWTP based on it.
Figure 5. Decision Tree for WTTP.
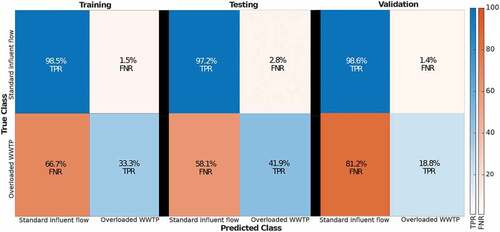
presents the confusion matrix TPR and FNR for the learning, test and validation sets of the decision tree indicated above within the two WTTP operating condition classes. For the learning set, 98.5% of the measurements were correctly classified in the standard influent flow group, while 1.5% of the measurements were incorrectly assigned to the overloaded class. Within the second group, the TPR is 33.3%, indicating that states associated with WWTP overloading may be more difficult to predict, the reason being their lower incidence relative to the most commonly observed standard WWTP operating condition. However, for the test set, the percentage is much higher at 41.9%. By inference, it can be seen that the decision tree has learned very well how to distinguish the standard influent flow and, based on this, is able to place the remaining flows in the overloaded WWTP class. For the validation set, the percentage of assigning measurements to standard influent flow is still at a high level of 98.6%, but due to fewer extreme observations for the validation set (April-July 2021), the FNR is 81.2%.
Figure 6. TPR and FNR for training, test and validation sets.
4 Discussion
WWTPs represent a set of facilities and process equipment that are vulnerable to climate change and require the implementation of risk and safety analyses in the context of flooding (Sun, Nazari, and Karimi et al. Citation2021) and intensive rainfall (Hughes, Cowper-Heays, and Olesson et al. Citation2021), among others. Not including cities in arid climates, virtually every urban area where CSSs operate faces the problem of above-normal discharge from storm overflows by CSOs into rivers.
In Poland, all legal regulations related to the possibility of wastewater discharge by CSOs are contained in the Regulation of the Minister of Marine Economy and Inland Navigation (Dz.U.2019.1311 date 2019.07.15) Citation2019. According to the regulations, ‘wastewater from storm overflows of the municipal combined sewer system may be discharged into inland flowing surface waters, coastal waters, and transitional waters if the average annual number of discharges from individual overflows is not greater than 10’. Oversized discharges of CSS wastewater into rivers are meticulously recorded in water permits. However, water and sewer companies highlight the problem related to the management of rainwater and snowmelt. As can be seen from the above-mentioned provision, under the current legal conditions in Poland, WWTP operators settle accounts with the supervisory authority in the context of the amount of activated overflows. For these reasons, the management of wastewater treatment plants under changing weather conditions, especially during heavy rainfall, is one of the most important but also most difficult tasks for operators, while maintaining a compromise between the amount of inflows and meeting the quantitative standards for overflows during the year. Despite the advances in monitoring of WWTP operating parameters, still the majority of WWTPs, especially small and older ones, provide treatment services by operating in manual control mode ‘intuitively’. This is mainly due to the insufficient knowledge of the feasibility of using the available soft computing methods in practice and the lack of ongoing analysis of the impact of weather-related parameters (or weather conditions) on the characteristics of inflowing wastewater loads. Additionally, it should be noted that the quantitative aspect in the context of overflows, as opposed to qualitative issues, is insufficiently analyzed in the literature. This situation limits the key decisions to be made at WWTPs based on the latest knowledge to improve plant operations. The results obtained show that meteorological parameters, especially precipitation, with respect to the current day as well as the day before are the key input data for modelling the operating condition of WWTPs. In the opinion of the authors, it is not sufficient to consider the impact of weather condition on wastewater inflow to WWTPs only with respect to the division of periods into dry, normal and very wet, as analyzed by Bugajski, Nowobilska-Majewska, and Majewski (Citation2021) and Nowobilska-Majewska, Kotowski, and Bugajski (Citation2020). This kind of assessment is important, for example, for studies of the consequences of seasonal changes in precipitation and temperature on the microbiological and chemical quality of wastewater (Makuwa et al. Citation2022). This knowledge is needed to improve treatment processes and adopt stringent policies to control the quality of final effluents to achieve national and international standards. However, the quantitative assessments undertaken by the authors require analysis of more detailed data on rainfall and hydraulic parameters of WWTP. The high flow rates generated by heavy rainfall can undermine the performance of the treatment plant. The most significant impact of increased rainfalls on wastewater treatment plants has been identified as increased overflows and storm-related power outages (Hughes, Cowper-Heays, and Olesson et al. Citation2021).
According to ICPP (ICPP Citation2021), more extreme variability is forecast, with droughts and rainfall becoming more severe. Adaptation to climate change is increasingly recognized as an important point in managing wastewater treatment plant performance. This means that understanding the science and using the available tools to develop decision-making processes for infrastructure owners and managers is key to the implementation of adaptation strategies.
Poland is in the early stages of planning to adapt to climate change, but recent years have seen some significant steps towards acknowledging national climate risk and developing strategies to adapt to climate change. Therefore, local government authorities must be aware of climate impacts and risks of climate change to make important short and long-term decisions related to their infrastructure. These decisions need to be considered along with other current and future pressures relating to land use, growth, and renewals, as well as the real possibility of insurance retreat over the medium to longer term. The simplest solution to reduce inflows to the treatment plant, according to the principle that prevention is better than cure, appears to be the implementation of measures to increase the retention capacity of the catchment. They allow the reduction the outflow of rainwater by sewer systems even by 41.3% (Pawęska and Duda Citation2018) using elements such as green infrastructure as a control mechanism (Burszta-Adamiak et al. Citation2019; Wieczerak Citation2021). Riechel et al. (Citation2020) claim that for an average rainfall year sustainable urban drainage systems (SUDS) reduce total runoff by 28%–39%, peak runoff by 31%–48%, and relative reduction in total CSO volume ranges from 45%–58%. However, it is important to note that the implementation of sustainable urban drainage systems, such as green roofs, infiltration trenches, or other nature-based solutions can retain rainfall and delay the initiation of runoff at a small spatial scale, e.g. building or settlement level. In addition, building this type of infrastructure typically requires large dedicated areas and financial outlays, as opposed to using cost-effective computational intelligence methods in practice. Soft sensors are classified as statistical methods, which, based on historical data, make it possible to carry out prediction of WWTP operation status and optimization of processes related to wastewater treatment (Cheng, Harrou, and Kadri et al. Citation2020). The advantage of soft sensors and soft computing models is that they are based on numerical analyses without the need to implement other ex situ solutions and have skilled staff. These are a number of cost-effective solutions that do not require too much money and at the same time allow learning about non-linearity and dynamic processes, the knowledge of which is contained in environmental data (Cheng, Harrou, and Kadri et al. Citation2020; Elmaadawy, Elaziz, and Elsheikh et al. Citation2021). Based on long-term observations, data-driven models are implemented, usually based on deep learning technologies. Such soft computing models can greatly improve short-term predictions and help decision makers to support process control and increase reliability of WWTPs.
The need to develop Model Predictive Control (MPC) which is a subset of Real-Time Control (RTC) is not insignificant. This research includes MPC in its scope, thus supporting RTC and ultimately improving the efficiency of managing combined sewers and WTTPs. As Van Der Werf, Kapelan, and Langeveld (Citation2022) point out, the long-term impact of RTC on the performance of combined sewer hydraulics is yet unknown, but they emphasize the importance of studying the interactions between sewer systems and WTTPs. Therefore, both RTC and MPC should be developed and implemented to minimize the effects of urban flooding, sewer overflows, and WWTP overloading. The need to adapt sewer systems to climate change while expanding cities is also a problem. The role of MPC to select sites for the construction of artificial retention basins and to intensify retention naturally is emphasized (Sobieraj, Bryx, and Metelski Citation2022), the need for which is demonstrated on the basis of Poland’s capital city (Warsaw), where about 40% of the city’s area does not transmit 80% of rainwater, which, in the absence of canal retention, means the appearance of floods and local flooding. MPC also in combination with the use of green infrastructure has a positive effect on the rejuvenation of CSOs’ performance, and as Jean et al. (Citation2022) proved, it can be 65–92%. Although studies on the creation of CSO management strategies indicate that there is still a lack of reliable data and analysis of the performance of CSOs, an effective method to avoid flooding is simply greening cities, which in the widespread concreting of them is hard to restore (Quaranta et al. Citation2022). A study by Quaranta et al. (Citation2022) shows that RTCs can reduce the volume of CSO by approximately 20%. However, to realize RTC and MPCs, it is necessary to perform research using computational intelligence, including machine learning and deep learning (Zhang, Lindholm, and Ratnaweera Citation2018). As shown in the research by Yin et al. (Citation2022), machine learning can contribute to balancing the wastewater load of a sewer system and can be applied to improve sewer overflow prediction. Although prediction methods are well known in this aspect, this study is the only one to address the selection of appropriate predictors and implement the use of decision trees, which are extremely useful for operators of WTTPs and combined sewers.
5 Conclusions
This study fills a gap in the literature with respect to quantitative analyses of influent flow at WWTPs. The results obtained show that meteorological parameters, especially precipitation, for the current day (P) and for the day before (P-1) are the key input data for modelling the operating condition of WWTPs. The operating condition of WWTPs was classified into two categories/groups, i.e. standard (no overflows activated) and extreme (when overflows are discharged to the river). The accuracy of the analysis for the test data set was 92.4%. The best quality of the model was achieved for predictable and stable rainfall months such as February and April. For the periods of maximum In-F to WTTP, such as July and August, the true and predicted influent flows were also the same as each other and were within similar limits of wastewater inflows to the treatment plant.
The proposed decision tree tool allows to enrich the experience of the operators with the possibility of making decisions using computational intelligence as a nucleus of the idea of smart cities and an intelligent wastewater treatment operating within them. For the WWTP considered in the case study, the limit between standard inflows and excess influent flows to the WTTP was set at 22 356.5 m3/d, with the parameters most relevant to predict the size of the WWTP load being the influent flow day before (InF-1), precipitation amounts on the preceding day (P-1) and the current day (P).
The results of this study can support and improve the procedures related to the safety of wastewater discharge and treatment at WWTP, since knowledge of basic operational and meteorological parameters encourages the implementation of the proposed procedures. At the analyzed WWTP, these procedures could be implemented, among others, to automate the process of opening and closing the valve that regulates the discharge of wastewater after mechanical treatment to the receiver, which so far is operated manually, with different, unspecified values of the excess flow of wastewater to the facility. However, it should be taken into account that the method proposed by the authors allows for short-term evaluation of WWTP operation and preparation of current wastewater treatment technology for appropriate wastewater load. The presented research refers to a specific case study; however, the methodology can be implemented and evaluated in other wastewater treatment plants that receive wastewater from combined sewer systems.
Future research on the application of computational intelligence will be based on the ability of the CSO to predict the activation of CSOs at the microscale, that is, in the combined sewer network in the context of taking measures to increase the retention of the conduit and select locations where it is necessary to build artificial retention tanks.
Authors contributions
J.Stańczyk conceptualization, methodology, formal analysis, writing original draft, E. Burszta-Adamiak original draft preparation, reviewing and editing, J.Kajewska-Szkudlarek methodology, formal analysis, writing original draft, A.Przerwa and R.Kurkiewicz data collection.
Acknowledgements
The authors would like to express their gratitude to Świdnickie Przedsiębiorstwo Wodociągów i Kanalizacji w Świdnicy Spółka z o. o. for their cooperation and making the data available for research. We also would like to thank the Institute of Meteorology and Water Management - National Research Institute (PIB). The source of the meteorological data is IMGW (PIB). Data from IMGW (PIB) have been processed.
Disclosure statement
The authors have no relevant financial or non-financial interests to disclose.
Data availability statement
On analyses in this manuscript, please contact: [email protected]
Additional information
Funding
References
- Abdulla, F, and S Farahat. 2020. “Impact of Climate Change on the Performance of Wastewater Treatment Plant: Case Study Central Irbid WWTP (Jordan)”. Procedia Manufacturing 44: 205–212. doi:10.1016/j.promfg.2020.02.223.
- Alsulaili, A, and A Refaie. 2021. “Artificial Neural Network Modeling Approach for the Prediction of five-day Biological Oxygen Demand and Wastewater Treatment Plant Performance.” Water Supply 21 (5): 1861–1877. doi:10.2166/ws.2020.199.
- Boyd, G, D Na, Z Li, S Snowling, Q Zhang, and P Zhou. 2019. “Influent Forecasting for Wastewater Treatment Plants in North America.” Sustainability 11 (6): 1764. doi:10.3390/su11061764.
- Brzezinski, D, and J Stefanowski. 2017. “Prequential AUC: Properties of the Area under the ROC Curve for Data Streams with Concept Drift.” Knowledge and Information Systems 52 (2): 531–562. doi:10.1007/s10115-017-1022-8.
- Bugajski, P, E Nowobilska-Majewska, and M Majewski. 2021. “The Impact of Atmospheric Precipitation on Wastewater Volume Flowing into the Wastewater Treatment Plant in Nowy Targ (Poland) in Terms of Treatment Costs.” Energies 14 (13): 3806. doi:10.3390/en14133806.
- Burszta‐Adamiak, E, J Stańczyk, and J Łomotowski. 2019. “Hydrological Performance of Green Roofs in the Context of the Meteorological Factors during the 5‐year Monitoring Period.” Water and Environment Journal 33 (1): 144–154. doi:10.1111/wej.12385.
- Cheng, T, F Harrou, F Kadri, Y Sun, and T Leiknes. 2020. “Forecasting of Wastewater Treatment Plant Key Features Using Deep Learning-Based Models: A Case Study.” IEEE Access 8: 184475–184485. doi:10.1109/ACCESS.2020.3030820.
- Dadar, S, A Pezeschi, B Đurin, and D Dogančić. (2020). “Qualitative Evaluation of Wastewater Treatment Plant Performance by a Neural Network Model Optimized by Genetic Algorithm.” Proceedings of the 5th International Electronic Conference on Water Sciences, 16–30 November 2020, MDPI: Basel, Switzerland. 10.3390/ECWS-5-08047
- Dittmer, U, A Bachmann-Machnik, and MA Launay. 2020. “Impact of Combined Sewer Systems on the Quality of Urban Streams: Frequency and Duration of Elevated Micropollutant Concentrations.” Water 12 (3): 850. doi:10.3390/w12030850.
- Dz.U.2019.1311 date 2019.07.15. “Minister of Marine Economy and Inland Navigation. Regulation on Substances Particularly Harmful to the Aquatic Environment and Conditions to Be Met When Discharging Sewage into Waters or into the Ground, as Well as When Discharging Rainwater or Snowmelt into Water or into Water Facilities.” 12 July 2019. https://isap.sejm.gov.pl/isap.nsf/DocDetails.xsp?id=WDU20190001311 (In Polish)
- Elmaadawy, K, MA Elaziz, AH Elsheikh, A Moawad, B Liu and S Lu. 2021. “Utilization of Random Vector Functional Link Integrated with Manta Ray Foraging Optimization for Effluent Prediction of Wastewater Treatment Plant.” Journal of Environmental Management 298:113520. doi:10.1016/j.jenvman.2021.113520.
- Hejabi, N, SM Saghebian, MT Aalami, and V Nourani. 2021. “Evaluation of the Effluent Quality Parameters of Wastewater Treatment Plant Based on Uncertainty Analysis and post-processing Approaches (Case Study).” Water Science and Technology 83 (7): 1633–1648. doi:10.2166/wst.2021.067.
- Hellwig, Z. 1968. On the Optimal Choice of Predictors. In: Toward a System of Quantitative Indicators of Components of Human Resources Development, ed. Z. Gostkowski. Paris: UNES.
- Hughes, J, K Cowper-Heays, E Olesson, R Bell, and A Stroombergen. 2021. “Impacts and Implications of Climate Change on Wastewater Systems: A New Zealand Perspective.” Climate Risk Management 31:100262. doi:10.1016/j.crm.2020.100262.
- Hvala, N, and J Kocijan. 2020. “Design of a Hybrid mechanistic/Gaussian Process Model to Predict full-scale Wastewater Treatment Plant Effluent.” Computers & Chemical Engineering 140: 106934. doi:10.1016/j.compchemeng.2020.106934.
- Icke, O, K van Schagen, C Huising, J Wuister, E van Dijk, and A Budding. 2017. “Flow Intake Control Using dry-weather Forecast.” Drinking Water Engineering and Science 10 (2): 69–74. doi:10.5194/dwes-10-69-2017.
- IPCC. 2021. Climate Change 2021: The Physical Science Basis. Contribution of Working Group I to the Sixth Assessment Report of the Intergovernmental Panel on Climate Change. Eds. V Masson-Delmotte, P Zhai, A Pirani, Connors SL, C Péan, S Berger, N Caud, et al., Cambridge University Press. Cambridge, United Kingdom and New York, NY, USA. 10.1017/9781009157896
- Jin, Y, X You, and M Ji. 2016. “Process Response of Wastewater Treatment Plant under Large Rainfall Influent Flow.” Environmental Engineering and Management Journal 15: 11.
- Kajewska-Szkudlarek, J, and W Łyczko. 2021. “Assessment of Hellwig Method for Predictors’ Selection in Groundwater Level Time Series Forecasting.” Water 13 (6): 778. doi:10.3390/w13060778.
- Kang, H, S Yang, J Huang, and J Oh. 2020. “Time Series Prediction of Wastewater Flow Rate by Bidirectional LSTM Deep Learning.” International Journal of Control, Automation and Systems 18 (12): 3023–3030. doi:10.1007/s12555-019-0984-6.
- Kareem, SL, WS Jaber, LA Al-Maliki, RA Al-husseiny, SK Al-Mamoori, and N Alansari. 2021. “Water Quality Assessment and Phosphorus Effect Using Water Quality Indices: Euphrates River- Iraq as a Case Study.” Groundwater for Sustainable Development 14: 100630. doi:10.1016/j.gsd.2021.100630.
- Khambete, A, and R Christian. 2014. “Statistical Analysis to Identify the Main Parameters to Effecting WWQI of Sewage Treatment Plant and Predicting BOD.” International Journal of Research in Engineering and Technology 3 (1): 186–195. doi:10.15623/ijret.2014.0301030.
- Koop, SHA, L Koetsier, A Doornhof, O Reinstra, CJ van Leeuwen, S Brouwer, C Dieperink, and PPJ Driessen. 2017. “Assessing the Governance Capacity of Cities to Address Challenges of Water, Waste, and Climate Change.” Water Resources Management 31 (11): 3427–3443. doi:10.1007/s11269-017-1677-7.
- Mahesh, B. 2020. “Machine Learning Algorithms-A Review.” International Journal of Science and Research (Ijsr)[internet] 9: 381–386.
- Makuwa, S, M Tlou, E Fosso-Kankeu, and E Green. 2022. “The Effects of Dry versus Wet Season on the Performance of a Wastewater Treatment Plant in North West Province, South Africa.” Water SA 48 (1): 40–49. doi:10.17159/wsa/2022.v48.i1.3897.
- Mè, Jean, C Morin, S Duchesne, G Pelletier, and M Pleau. 2022. “Real-time Model Predictive and rule-based Control with Green Infrastructures to Reduce Combined Sewer Overflows.” Water Research 221: 118753. doi:10.1016/j.watres.2022.118753.
- Miao, S, C Zhou, SA AlQahtani, M Alrashoud, A Ghoneim and Z Lv. 2021. “Applying Machine Learning in Intelligent Sewage Treatment: A Case Study of Chemical Plant in Sustainable Cities.” Sustainable Cities and Society 72:103009. doi:10.1016/j.scs.2021.103009.
- Mohammed, AA, SL Kareem, RJ Peters, and K Mahdi. 2022. “Removal of Amoxicillin from Aqueous Solution in Batch and Circulated Fluidized Bed System Using Zinc Oxide Nanoparticles: Hydrodynamic and Mass Transfer Studies.” Environmental Nanotechnology, Monitoring and Management 17: 100648. doi:10.1016/j.enmm.2022.100648.
- Nowobilska-Majewska, E, T Kotowski, and P Bugajski. 2020. “Impact of Atmospheric Precipitation on the Volume of Wastewater Inflowing to the Treatment Plant in Nowy Targ.” E3S Web of Conferences 171: 01009. doi:10.1051/e3sconf/202017101009.
- Olds, HT, SR Corsi, DK Dila, KM Halmo, MJ Bootsma, and SL McLellan. 2018. “High Levels of Sewage Contamination Released from Urban Areas after Storm Events: A Quantitative Survey with Sewage Specific Bacterial Indicators.” PLOS Medicine 15 (7): 1002614. doi:10.1371/journal.pmed.1002614.
- Oliveira DBC de, Soares WDA, Holanda MACR de. 2020. “Effects of Rainwater Intrusion on an Activated Sludge Sewer Treatment System.” Ambiente E Agua - an Interdisciplinary Journal of Applied Science 15: 1. doi:10.4136/ambi-agua.2497.
- Omiotek, Z, O Stepanchenko, W Wójcik, W Legieć, and M Szatkowska. 2019. “The Use of the Hellwig’s Method for Feature Selection in the Detection of Myeloma Bone Destruction Based on Radiographic Images.” Biocybernetics and Biomedical Engineering 39 (2): 328–338. doi:10.1016/j.bbe.2018.11.008.
- Pawęska, K, and P Duda. 2018. “Wpływ opadów atmosferycznych na bilans ścieków dopływających i odpływających z komunalnej oczyszczalni ścieków.” Ecological Engineering & Environmental Technology 19: 49–56. doi:10.12912/23920629/95277.
- Plósz, BG, H Liltved, and H Ratnaweera. 2009. “Climate Change Impacts on Activated Sludge Wastewater Treatment: A Case Study from Norway.” Water Science and Technology 60 (2): 533–541. doi:10.2166/wst.2009.386.
- Quaranta, E, S Fuchs, HJ Liefting, A Schellart, and A Pistocchi. 2022. “Costs and Benefits of Combined Sewer Overflow Management Strategies at the European Scale.” Journal of Environmental Management 318: 115629. doi:10.1016/j.jenvman.2022.115629.
- Reznik, A, Y Jiang, and A Dinar. 2020. “The Impacts of Climate Change on Wastewater Treatment Costs: Evidence from the Wastewater Sector in China.” Water 12 (11): 3272. doi:10.3390/w12113272.
- Riechel, M, A Matzinger, M Pallasch, K Joswig, E Pawlowsky-Reusing, R Hinkelmann, and P. Rouault. 2020. “Sustainable Urban Drainage Systems in Established City Developments: Modelling the Potential for CSO Reduction and River Impact Mitigation.” Journal of Environmental Management 274: 111207. doi:10.1016/j.jenvman.2020.111207.
- Sobieraj, J, M Bryx, and D Metelski. 2022. “Stormwater Management in the City of Warsaw: A Review and Evaluation of Technical Solutions and Strategies to Improve the Capacity of the Combined Sewer System.” Water 14 (13): 2109. doi:10.3390/w14132109.
- Sun, Q, R Nazari, M Karimi, MGR Fahad, and RW Peters. 2021. “Comprehensive Flood Risk Assessment for Wastewater Treatment Plants under Extreme Storm Events: A Case Study for New York City, United States.” Applied Sciencesi. 11 doi:10.3390/app11156694.
- Szeląg, B, L Bartkiewicz, J Studziński, and K Barbusiński. 2017. “Evaluation of the Impact of Explanatory Variables on the Accuracy of Prediction of Daily Inflow to the Sewage Treatment Plant by Selected Models Nonlinear.” Archives of Environmental Protection 43 (3): 74–81. doi:10.1515/aep-2017-0030.
- Szmidt, E, J Kacprzyk, and P Bujnowski. 2020. “Attribute Selection via Hellwig’s Algorithm for Atanassov’s Intuitionistic Fuzzy Sets.“ In Computational Intelligence and Mathematics for Tackling Complex Problems, edited by LT Kóczy, J Medina-Moreno, E Ramírez-Poussa, A Šostak, 81–90. 978-3-030-16024-1. Switzerland: Springer Cham. doi:10.1007/978-3-030-16024-1
- Termite, LF, E Bonamente, A Garinei, D Bolpagni, and L Menculini. 2021. “An Artificial Neural Network-based Real Time DSS to Manage the Discharges of a Wastewater Treatment Plant and Reduce the Flooding Risk.“ Proceedings of the 10th International Conference on Smart Cities and Green ICT Systems. pp .15–26.
- Van Der Werf, JA, Z Kapelan, and J Langeveld. 2022. “Towards the Long Term Implementation of Real Time Control of Combined Sewer Systems: A Review of Performance and Influencing Factors. Water Sci.” Technology 85 (4): 1295–1320. doi:10.2166/wst.2022.038.
- Wei, X, and A Kusiak. 2015. “Short-term Prediction of Influent Flow in Wastewater Treatment Plant.” Stochastic Environmental Research and Risk Assessment 29 (1): 241–249. doi:10.1007/s00477-014-0889-0.
- Wieczerak, TJ (2021) “Understanding Combined Sewer Overflow (CSO) and Green Infrastructure Interaction in New Jersey: An Economic Analysis.” Theses, Dissertations and Culminating Projects. 759. https://digitalcommons.montclair.edu/etd/759
- Wójcik-Leń, J, P Leń, M Mika, H Kryszak, and P Kotlarz. 2019. “Studies regarding Correct Selection of Statistical Methods for the Needs of Increasing the Efficiency of Identification of Land for consolidation—A Case Study in Poland”. Land Use Policy 87: 104064. doi:10.1016/j.landusepol.2019.104064.
- Xenochristou, M, and M Blokker. (2018). “Investigating the Influence of Weather on Water Consumption: A Dutch Case Study.” Presented at the WDSA/CCWI Joint Conference Proceedings 23-25 July, 2018. Kingston, Ontario, Canada.
- Yin, Z, L Zahedi, AS Leon, MH Amini, and LA Bian. 2022. “Machine Learning Framework for Overflow Prediction in Combined Sewer Systems.” World Environmental and Water Resources Congress (2022): 194–205. doi:10.1061/9780784484258.019.
- Yuan, W, L Fu, Q Gao, and F Wan. 2019. “Comprehensive Assessment and Rechecking of Rainfall Threshold for Flash Floods Based on the Disaster Information.” Water Resources Management 33 (10): 3547–3562. doi:10.1007/s11269-019-02321-9.
- Yuan, W, X Tu, C Su, M Liu, D Yan and Z Wu. 2021. “Research on the Critical Rainfall of Flash Floods in Small Watersheds Based on the Design of Characteristic Rainfall Patterns.” Water Resources Management 35 (10): 3297–3319. doi:10.1007/s11269-021-02893-5.
- Zhang, D, G Lindholm, and H Ratnaweera. 2018. “DeepCSO: Forecasting of Combined Sewer Overflow at a Citywide Level Using Multi-Task Deep Learning.” arXiv preprint arXiv:1811.06368. doi: 10.13140/RG.2.2.21058.84161.
- Zhang, Q, Z Li, S Snowling, A Siam, and W El-Dakhakhni. 2019. “Predictive Models for Wastewater Flow Forecasting Based on Time Series Analysis and Artificial Neural Network.” Water Science and Technology 80 (2): 243–253. doi:10.2166/wst.2019.263.
- Zhou, P, Z Li, S Snowling, BW Baetz, D Na, and G Boyd. 2019. “A Random Forest Model for Inflow Prediction at Wastewater Treatment Plants.“ Stochastic Environmental Research and Risk Assessment 33 (10): 1781–1792. doi:10.1007/s00477-019-01732-9.