
ABSTRACT
Growing media in green infrastructure (GI) designed for stormwater management plays a critical role in providing hydrological benefits. However, sediment deposition by urban stormwater can cause clogging and reduce the infiltration capacity. This study introduces a new approach to characterise the impact of clogging of GI that uses fluorescent tracer particles. Results are compared for two contrasting growing media: Grey to Green Substrate (G2G) and Marie Curie Substrate (MCS). Results showed that most sediment particles were retained on the surface of both growing media, and surface clogging in G2G caused a decrease in infiltration capacity. Sediment vertical movement was observed in both growing media, but particles travelled deeper in MCS. Vertical sediment movement is influenced by the growing media’s pore size distribution, and a high clogging risk is expected in growing media with a pore size distribution that is close to the particle size distribution of the incoming sediment particles.
Introduction
Background
Green infrastructure (GI) refers to a network of natural and engineered multifunctional green space and other green features. As a subset of GI, vegetated sustainable drainage systems (SuDS) use natural processes to provide sustainable solutions to stormwater management and minimise the hydrological impacts of urbanisation (Woods-Ballard et al. Citation2015). Vegetated SuDS can take various forms, but their main functions are to manage stormwater quality to control pollution and reduce runoff quantity to mitigate flood risk (Woods-Ballard et al. Citation2015). Vegetated SuDS such as green roofs and bioretention cells (commonly known as rain gardens) rely on vegetation and engineered growing media to provide the relevant stormwater benefits. The hydrological characteristics of growing media and the species of vegetation determine the hydrological performance of these systems in response to storm events (De-Ville et al. Citation2021; Stovin et al. Citation2015).
Growing media and clogging
The growing media used in green roof and bioretention systems are engineered substrates that typically comprise a mixture of sand, crushed brick, gravel and organic matter (De-Ville et al. Citation2021; Fassman and Simcock Citation2012; FLL Citation2008; Hunt et al. Citation2008; Smith et al. Citation2021; Stovin et al. Citation2015). A green roof system is designed to deal with incident rainfall only. The depth of a typical extensive green roof growing media layer is <150 mm. The materials used for green roof growing media usually have a high permeability to avoid surface ponding whilst providing attenuation for subsequence storm events (FLL Citation2008). In contrast, a bioretention system is expected to capture the inflow from adjacent impermeable catchments in addition to direct rainfall (Woods-Ballard et al. Citation2015). As a bioretention system is designed to handle a large quantity of stormwater, the growing media is designed to be deep enough (i.e. >750 mm) to support large plants and enhance evapotranspiration. In order to provide sufficient contact time to remove pollutants, the permeability of bioretention growing media is usually lower than for a typical green roof growing media (Woods-Ballard et al. Citation2015).
The hydrological processes in green roof and bioretention systems include surface infiltration, percolation through the growing media and drainage via an underdrain. Many bioretention systems also allow exfiltration into the underlying native soil. Surface infiltration is a key process in these systems, as it determines how quickly stormwater can reach the lower layers for percolation and drainage. The surface infiltration rate is dominated by the saturated hydraulic conductivity of the growing media, the head of the water ponding on the surface of the growing media and the moisture content in the growing media. In practice, saturated hydraulic conductivity is usually used to indicate growing media infiltration capacity (Ebrahimian et al. Citation2020; Woods-Ballard et al. Citation2015).
Current hydraulic design guidance for green roof and bioretention growing media suggests appropriate values for saturated hydraulic conductivity of 4200 mm/h in green roof growing media and 100–300 mm/h in bioretention media (FLL Citation2008; Woods-Ballard et al. Citation2015). However, over time, deposition of sediments (introduced through inflows) can cause clogging and a change in saturated hydraulic conductivity (Le Coustumer et al. Citation2009; Ebrahimian et al. Citation2020; Langergraber et al. Citation2003; Winter and Goetz Citation2003). In long-term studies, a change in the growing media’s saturated hydraulic conductivity has been used as an indicator of the development of clogging (Emerson and Traver Citation2008; Le Coustumer et al. Citation2009; Asleson et al. Citation2009; Jenkins et al. Citation2010; Paus et al. Citation2013; Garza, Welker, and Rife Citation2016; Natarajan and Davis Citation2015; Smith et al. Citation2021). However, the surface saturated hydraulic conductivity does not provide any insight into the transport of sediment particles below the surface of the growing media. In addition, clogging in growing media may take time to occur. Limited by the concentration of sediment particles in the inflows and the study duration, field studies may not be systematic or of sufficient length to observe clogging within the deeper layers of the growing media. Moreover, saturated hydraulic conductivity measured in field systems can be influenced by many factors that cannot be controlled, meaning that measured changes (or not) in hydraulic conductivity are not necessarily attributable to clogging (or not) of the growing media. Therefore, tracing sediment particle movement in growing media with simulated rainfall events and sediment loads under a controlled laboratory environment is critical for understanding clogging in growing media.
Visualisation of sediment particle movement
Tracers used to visualise sediment movement in growing media must have distinct characteristics from the native media materials to be identifiable. Fluorescent tracer particles made from natural silica coated with fluorescent pigmented resin offer significant potential for tracking sediment in soils at a laboratory scale (Hardy et al. Citation2016, Citation2017, Citation2019). The particle size distribution of fluorescent tracer particles can be designed to represent actual sediment particle sizes, and the mass loading of fluorescent tracer particles applied to the surface of the media can be controlled. As the fluorescent tracer particles do not dissolve in water and are excited only with a specific light wavelength (i.e. Ultra Violet light), the particles can be easily identified and tracked within the media in a dark environment. Fluorescent tracer particles have successfully been used in soil media for real-time tracking of clay, sand and sediment particles in a laboratory soil flume (Hardy et al. Citation2016, Citation2017, Citation2019). In this study, we undertake a preliminary investigation to explore the potential to utilise similar fluorescent particles specifically within SuDS growing media to investigate and visualise media clogging.
Aim and objectives
This preliminary study aimed to investigate clogging due to fine sediment deposition in two SuDS growing media. The specific objectives were to:
Characterise the pore size distribution and hydrological properties of two SuDS growing media;
Visualise surface clogging and vertical sediment movement in the growing media using fluorescent tracer particles;
Investigate the impact of growing media physical properties on the vertical movement of the sediment particles;
Quantify the vertical sediment particle distribution within the growing media in response to sustained rainfall/inflow and multiple sediment particle dosings.
Methods and materials
Experimental set-up
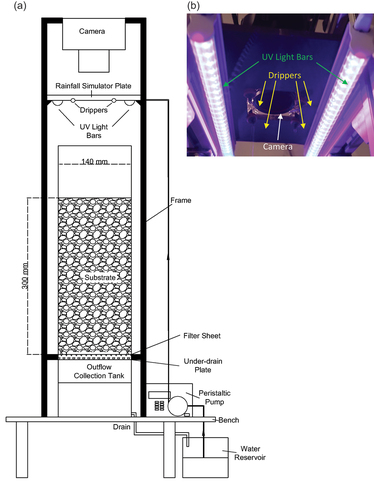
illustrates the apparatus used in this study. The apparatus comprises a flow control system, sample column and lighting and an image acquisition system. The flow control system consists of a water reservoir, a peristaltic pump and four drippers. With a constant pumping rate delivered by the peristaltic pump, a constant inflow rate is offered by the drippers. The four drippers were placed in a square, 90 mm apart, to achieve a uniform inflow onto the growing media surface. A circular sample column with a diameter of 140 mm and a height of 400 mm was made from transparent acrylic. The column incorporated a perforated base covered by a layer of filter sheet (Camlab Grade 601, with 5–13 μm particle retention). Runoff from the bottom of the column was collected and directed to the water supply reservoir to form a circulating water system. A Canon EOS D1200 camera with EFS 18–55 mm zoom lens was used to take images at the surface of the growing media at 1 min to 1 h time intervals, depending on the time since the start of the experiment. Two 6 W UV light bars with a dominant wavelength of 395 nm were used to illuminate the fluorescent tracer particles, and the camera was fitted with a 515 nm long pass filter to filter UV light. The camera was connected to a PC, and the Digital Camera Control software (DigiCamControl) was used to adjust camera parameters and control the camera to take images (camera parameters are provided in Supplementary Material Table A.1).
Figure 1. Experimental set-up for the particle dosing experiment; (a) Schematic drawing of the setup; (b) Details of the rainfall simulator plate viewed from below.
Growing media
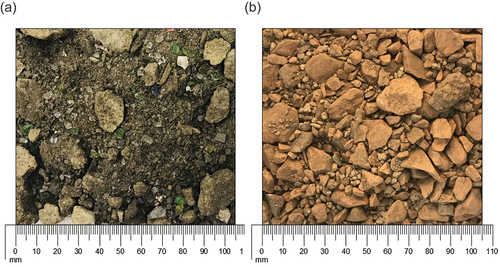
Two types of SuDS growing media were used in this study. Grey to Green media (G2G) ()) is the growing media used in Sheffield City Council’s Grey-to-Green retrofit bioretention systems (Susdrain Citation2016). G2G media comprises locally sourced (Sheffield, UK) recycled waste components with 50% (by weight) Sandstone Quarry Waste Material (5–20 mm); 25% Crushed Recycled Glass; 15% Green Waste Compost; and 10% Sugar-beet Washings (topsoil) (De-Ville et al. Citation2021). Marie Curie Substrate (MCS) ()) is a type of green roof growing media that was developed between the University of Sheffield and ZinCo as part of a collaborative research project. MCS is comparable with commercial green roof substrates and has shown the potential to provide hydrological benefits (i.e. rainfall retention and runoff detention) in previous studies (De-Ville et al. Citation2017; Peng, Smith, and Stovin Citation2020; Yio et al. Citation2013).
Figure 2. The two growing media used in this study; (a) Bioretention Grey to Green media (G2G); (b) Green roof Marie Curie Substrate (MCS).
Growing media physical properties
The saturated hydraulic conductivity, porosity, particle size distribution and soil water release curve have been determined for both growing media, and reported in De-Ville et al. (Citation2021) (G2G) and Peng, Smith, and Stovin (Citation2020) (MCS) with the properties relevant to this study summarised in Supplementary Material Tables A.2 and A.3 alongside Figures A.5 and A.6. G2G contains a higher proportion of large particles (i.e. particle size >6 mm) (44% versus 35%) and fine particles (i.e. particle size <0.6 mm) (18% versus 8%) than MCS. Due to the high percentage of fines in G2G, G2G has a lower porosity (0.443 v/v versus 0.552 v/v) and saturated hydraulic conductivity than MCS (101 mm/h versus 9960 mm/h). The soil water release curve describes the ability of the growing media to retain water under negative pore-water pressure. Studies have found that the calibrated Durner model fits the measured data points on the soil water release curve for green roof growing media (Liu and Fassman-Beck Citation2018; Peng, Smith, and Stovin Citation2020). In this study, the measured soil water release curve for the two growing media was used to calibrate the Durner model parameters (De-Ville et al. Citation2021; Peng, Smith, and Stovin Citation2020), and the parameters were then used to derive pore size distributions for the media following the approach described in Liu and Fassman-Beck (Citation2018) and Basile et al. (Citation2007). The detailed procedures are also provided in the Supplementary Material.
Note that the experiments were set up to represent a bioretention system receiving runoff from adjacent impermeable surfaces such as urban roads. The MCS was not developed as a growing media for bioretention cells but is used here to provide contrasting media characteristics compared with the G2G media.
Fluorescent tracer particles
The fluorescent tracer particles used throughout this study are commercially available fluorescent tracers (Partrac Ltd, UK) made from natural silica sand (sizing up to 150 μm) coated with fluorescent pigmented resin and have a density of 2.65 g/cm3. The particles appear bright yellow-green under UV light (with light wavelength between 100 and 400 nm). The particle distribution of the fluorescent tracer particles was designed to be a Gaussian distribution with a mean particle size of 120 μm. The actual particle size distribution was determined using a Malvern Matersizer 3000 (Malvern Panalytical Ltd) using the laser diffraction technique. Based on the survey conducted by Selbig and Bannerman (Citation2011) in Madison, Wisconsin, US, sediment particles in urban stormwater sourced from a parking lot, a feeder street, a collector street, an arterial street, a rooftop, and mixed-use land had a mean particle size between 63 and 125 μm with most of the particles (>60%) ranging from 32 to 500 μm. The fluorescent tracer particles used in this study fall in the range of the typical sediment sizes in urban stormwater, according to Selbig and Bannerman (Citation2011). However, it should be noted that the size distribution and mean particle size can vary between source areas and local environmental conditions.
Particle dosing experiment
Air-dried growing media was filled into the circular column to a depth of 300 mm at the beginning of the experiments with gentle compaction (3 strikings of a 1 kg metal plate) on the surface, resulting in a density of 1221.8 kg/m3 for G2G and 994.4 kg/m3 for MCS.
It should be noted that the experiments reported here were preliminary in nature. The intention was to explore the feasibility of visualising sediment movement within, and on the surface of, typical growing media, prior to more comprehensive and realistic experimental work being undertaken. The tests were (somewhat arbitrarily) designed to apply the equivalent of 2 years’ inflow in a short experimental period using a high sediment load to maximise the opportunities to visualise sediment movement. The experimental conditions were further simplified through the use of a constant inflow and four discrete sediment applications. While these conditions represent a simplification of inflows expected in reality, they are sufficient to permit an evaluation of the experimental visualisation methodology and to identify differences in the responses of the two contrasting media.
Based on Sheffield’s annual rainfall depth of approximately 850 mm, and an assumption that a bioretention cell may receive inflow from a total contributing area on the order of 10 times its own surface area, the annual inflow depth was assumed to be 8,500 mm. Two years equivalent inflow (17,000 mm) was applied on the surface of the growing media over 10 days at a constant rate, and a total of 40 g (± 1 g) fluorescent tracer particles was evenly sprinkled on the surface of the growing media over four applications. Applications were restricted to a maximum of 10 g of particles each time to ensure that the fluorescent particles did not change the growing media’s surface properties. The constant inflow rate was selected to be the saturated hydraulic conductivity of G2G to minimise the duration of the experiment and maximise the opportunity of observing both vertical movement and clogging effects. The first particle dosing was at the beginning of the experiment, with subsequent dosings after 6 months of equivalent inflow. The 6-month interval reflected the time taken to visibly observe reductions in the particles on the growing media surface following each dosing. It should be noted that the inflow rate applied is not representative of real rainfall events, and the mass of the tracer particles applied on the growing media in each dosing is significantly higher than a typical sediment load of 1 g/m2 (Sansalone et al. Citation1998) observed in urban roadway runoff. Therefore, the resulting clogging rate is not representative of the rate expected to occur in reality. The combination of a high inflow depth and multiple high concentrations of particle applications was intended to reproduce the multiple cycles of storm events experienced by a bioretention cell in practice and to be sufficiently long to reveal measurable differences in vertical particle movement. Surface images of the growing media during the experiment were captured by the camera. At the end of the experiment, the sample column was saturated, frozen and cut into six horizontal slices (50 mm thick) to determine the vertical variation in cross-sectional particle distribution.
Image interpretation
The raw images taken from the experiments were cropped in MATLAB to exclude non-interest areas, and coloured using the MATLAB Turbo colour scheme to enhance the concentration distribution. As fluorescent tracer particles emit green light and are significantly brighter than the growing media in the images, the ratio of green pixels to total image pixels (defined as the percentage coverage) was used to quantify the particle concentration. The procedure for counting fluorescent pixels involved extracting the image intensity from the camera green channel using the cropped images and a threshold of 12.5 (image greyscale intensity 8-bit), to define the minimum image intensity of a fluorescent tracer particle. An example showing the results of this procedure can be found in Supplementary Material Figure A.4.
Results
Physical properties of growing media
shows the estimated Pore Size Distribution (PSD) for the two growing media. A dual pore system is evident in the MCS with two peaks in the pore size distribution curve. As the sediment particle size from stormwater runoff is typically larger than 2 μm (Selbig and Bannerman Citation2011), pore spaces smaller than 2 μm are not of interest for this study (i.e. the first peak at small pore sizes for MCS). MCS has a broader range of pore sizes than G2G, but the pore space in G2G is generally smaller than in MCS (with a mean of 0.2 mm versus 0.5 mm).
Figure 3. Estimated pore size distribution (derived from measured soil water release curve) for the two growing media (G2G and MCS) and particle size distribution for the fluorescent particles (secondary Y axis).
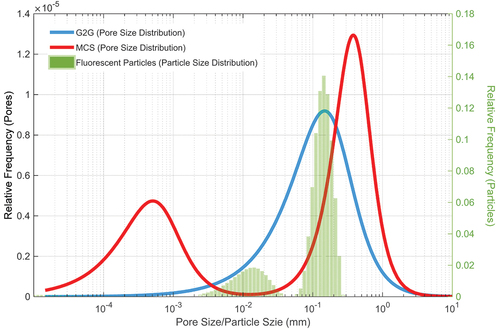
The particle size distribution measured for the fluorescent tracer particles is presented in as the mean result of three measurements. The d50 determined for the fluorescent tracer particles is 145 μm, which is slightly larger than the manufacturer reported value. The particle size distribution was designed to follow a Gaussian distribution. However, the measured distribution is bimodal with a gap between 40 and 50 μm. Nevertheless, the particle size of the fluorescent tracer particles reasonably covers the range of possible sediment particle sizes in urban stormwater (i.e. from 2 to 500 μm (Selbig and Bannerman Citation2011)).
Growing media pore size distribution is a key factor for determining potential clogging in the media as it determines the potential spaces for sediment particles to travel within. The sediment particles can block any pore space smaller than the sediment particle sizes. Comparing the particle size of the fluorescent tracer particles and the pore sizes of G2G and MCS, as a low proportion of pore space in G2G is larger than the fluorescent tracer particle sizes, it is expected that G2G may have a higher risk of clogging.
Particle dosing experiment
shows images of the surfaces of the two growing media at the end of each particle dosing. The images are coloured based on the image intensity of raw photographs, a more green colour corresponding to higher image intensity and a higher particle concentration. It is clear that in both growing media, the regions where the water fell from the drippers showed a lower particle concentration (i.e. darker blue colours) than the rest of the surface area. This is due to rain splash erosion processes repositioning the sediment across the surface upon impact directly under the drippers. The images for G2G showed an obvious increase in particle concentration on the surface over time (light blue colouring), whereas the images for MCS show a clear decrease in particle concentration.
Figure 4. Surface images for G2G and MCS at the end of each particle dosing.
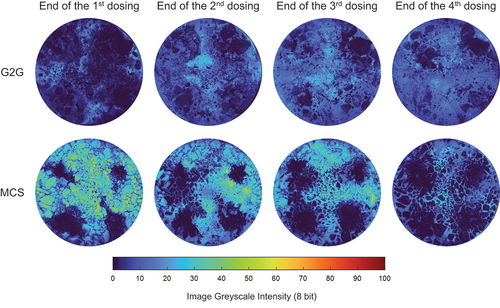
The growing media’s surface hydrological properties were altered due to the particles that accumulated on the surface. This change did not have a noticeable effect on the MCS: surface particle deposition did not totally block the surface pore space, such that water still infiltrated into the media. Surface particle deposition caused temporary localised minor ponding on the surface of MCS, and this helped water spread out on the surface and thus forced particles to travel into the media. However, surface particle deposition influenced G2G in a different way: surface infiltration capacity was reduced, surface ponding was observed, and downward movement was restricted. As a constant inflow rate was applied throughout the experiment and no surface ponding was observed at the beginning of the experiment, the reduction in infiltration capacity in G2G at a later stage of the experiment is believed to be caused by surface clogging.
shows the change of surface particle coverage for the two growing media in the particle dosing experiments. The four peaks in correspond to the times when particles were added to the surface of the growing media, approximately every 2.5 days (i.e. approximately 6-month equivalent inflow). As severe surface ponding was observed 5 minutes after the final particle dosing on G2G, the inflow rate was reduced by half, and the inflow duration was doubled to achieve the same inflow volume.
Figure 5. Surface particle coverage for G2G and MCS in the experiment.
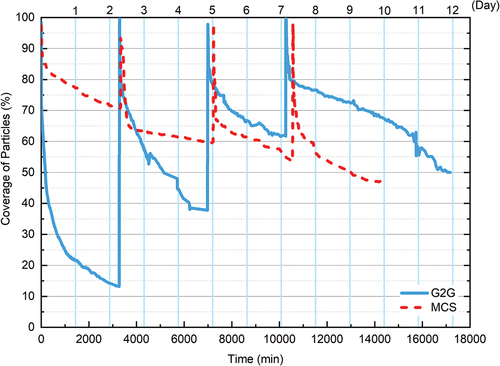
The two growing media showed different responses following each particle dosing. In the first dosing, particle coverage dropped dramatically to 15% in G2G. However, MCS still had 70% coverage at the end of this dosing. With more particles and inflow applied, the particle coverage increased at the end of each particle dosing (i.e. from 15% to 60% after the first three dosings) in G2G, and it dropped each time (i.e. from 70% to 45%) in MCS.
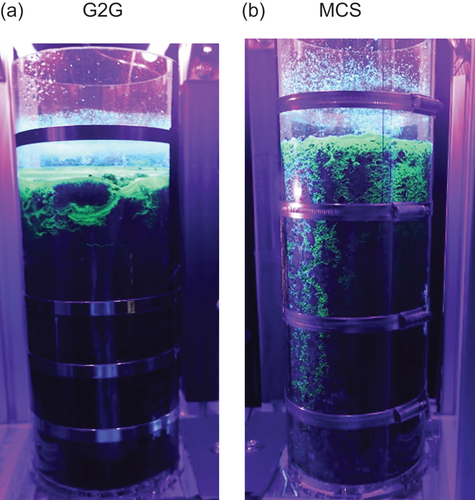
shows side view photographs taken for the two growing media at the end of the particle dosing experiment. Vertical movement was clearly observed in both growing media, but the movement in MCS was more noticeable than in G2G.
Figure 6. Photographs taken from the side of the columns at the end of the experiment: (a) G2G; (b) MCS.
The images for the frozen and sliced samples of the two growing media at the end of the experiments are presented in . Most particles were retained on the surface following the 2 years of equivalent water inflows in both growing media, but some vertical movement is also evident. In G2G (), particles were mainly observed in the upper 100 mm, and very few particles (less than 0.3%) were observed to travel further than 200 mm down into the media. In MCS (), a relatively high concentration (0.6%) of particles was observed at 200 mm below the surface. More particles travelled downwards in MCS and reached the bottom of the column than in G2G (2% versus 1%). It should be noted that the camera settings for surface images () and sliced samples () are different. This is because very few particles reached the bottom of the column, and in order to see those low concentration particles, a higher ISO was used for the sliced images (Supplementary Material Table A.1). It is acknowledged that the procedure of saturation and freezing at the end of the experiment can alter the surface particle distribution (i.e. the images for the growing media at the end of 4th dosing in look differently from #1 in ), but this does not affect the relative vertical particle distribution.
Figure 7. Images for the sliced G2G at the end of the experiment.
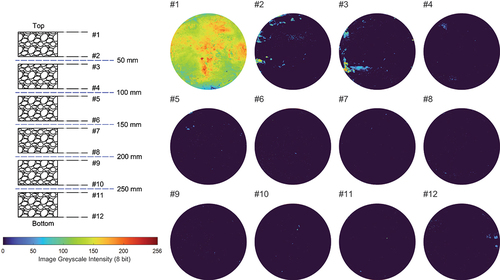
Figure 8. Images for the sliced MCS at the end of the experiment.
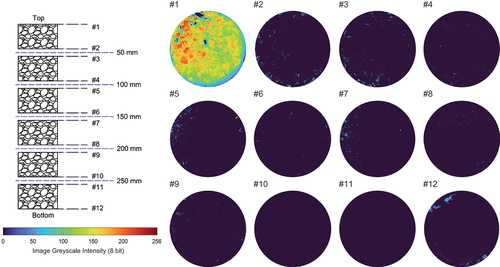
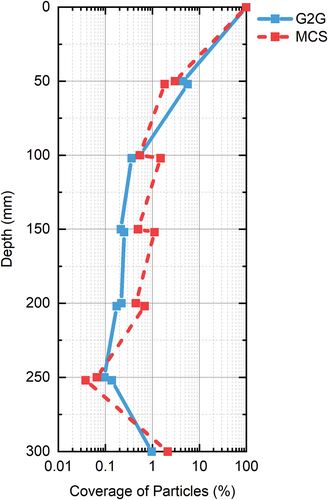
characterises the vertical particle distribution profiles derived from the slice images. More particles were observed to travel further into MCS than G2G, and the coverage of particles in MCS between 100 and 200 mm deep was higher than in G2G. However, higher particle coverage was observed in G2G at 50 mm (5% versus 2%). In both growing media, particle coverage at the bottom is higher than it is at 250 mm. This is probably a result of the restriction of the filter sheet placed at the bottom of the media column. Based on the particle size distribution of the sediment particles and the pore size distribution of the two growing media (), there is a small proportion of sediment particles that are significantly smaller than the smallest pore size of the growing media, and this proportion of particles can travel to the bottom of the media column relatively easily. However, as the opening of the filter sheet (i.e. retaining 5–13 μm particles) is too small for particles to travel through, any particles reaching the bottom were trapped by the filter sheet. It should be noted that preferential paths developed near the wall in MCS (), and these could also result in the particles reaching the bottom more quickly.
Figure 9. Cross-sectional vertical particle distribution of the tracer for the two growing media derived from the sliced growing media images.
Overall, the experimental results demonstrate that fluorescent tracer particles can be used to successfully track the movement of suspended solids entering SuDS growing media. The analysis demonstrated that vertical particle movement in MCS is greater than in G2G due to more large pore size spaces in MCS. Infiltration capacity and vertical particle mobility in G2G were significantly reduced with increasing particle deposition on the surface.
Discussion
Pore size distribution in the growing media is key to understanding clogging and vertical movement. However, this property is extremely difficult to characterise in practice. The pore size distribution for the two growing media in this study was derived from the characterised soil water release curve. It is acknowledged that there are uncertainties associated with the transfer functions. However, the derived pore size distribution in this study provided a good estimate of the possible performance of the growing media in response to surface sediment deposition (i.e. particle movement in MCS is easier than in G2G, and the possibility of surface clogging is low in MCS). Although more sophisticated tomography (e.g. 3D X-Ray CT) and simulation techniques (e.g. Lattice Boltzmann method) could be used to derive the vertical sediment distribution and particle travel paths, for practical application, the pore size distribution derived from the measured soil water release curve is sufficient to predict the susceptibility of different growing media to surface clogging and depth of vertical particle movement.
Careful selection and construction of growing media with consideration of appropriate infiltration capacity and pore size distribution may increase the lifespan of SuDS devices and reduce the associated clogging risk. Integrating graded filter design principles with bioretention media design provide a simple approach to prevent media from high clogging risk, maximise growing media longevity, and minimise restoration needs (Hatt, Fletcher, and Deletic Citation2007; Smith et al. Citation2021). The surface filter layer also requires careful design considering sediment particles and their relation with the filter media pore size needs (Kandra, McCarthy, and Deletic Citation2015). A good practical example of using a surface filter layer can be found in Sheffield’s Grey to Green Scheme (Susdrain Citation2016), where a 50 mm mulch layer made from sandstone was placed over the engineered bioretention growing media to allow sediment deposition and reduce the likelihood of localised accumulation and growing media clogging.
In addition to media pore size distribution, it is acknowledged that other factors (e.g. sediment load, inflow duration and intensity, dry and wet weather cycle; filter design and vegetation) also have the potential to influence the development of clogging in SuDS growing media. These factors were not considered in this preliminary study. However, the experimental set-up and method developed and adopted in this study provide unlimited opportunities for further investigations using representative depths of SuDS growing media. Controlled laboratory investigation using the tracer visualisation and analysis approach is especially important to support the development and performance characterisation of new growing media mixes from the perspectives of surface clogging, hydrological performance and treatment of solid pollutants, especially those based on reclaimed or recycled components.
Conclusions
Fluorescent tracer particles that are representative of typical sizes of sediment particles in surface runoff were used to investigate and visualise clogging in two growing media. To the authors’ knowledge, this is the first time such an approach has been used to characterise the susceptibility of SuDS growing media to clogging and how that varies with depth. This provides an indication of how the hydrological performance of SuDS might be expected to change in the long term. Experiments with two growing media of contrasting pore size distribution showed that the depth of penetration and the clogging risk are linked to the pore size distributions of the media compared with the particle sizes of the incoming sediments.
Data availability
The data that support the findings of this study are openly available via The University of Sheffield’s Online Research Data (ORDA) service, DOI: 10.15131/shef.data.20059580.
Supplemental Material
Download MS Word (3.4 MB)Acknowledgements
The authors would like to thank Joesph Milner, Martin Taylor and Paul Osborne for their technical support in setting up the experiment. For the purpose of open access, the author has applied a Creative Commons Attribution (CC BY) licence to any Author Accepted Manuscript version arising.
Disclosure statement
No potential conflict of interest was reported by the author(s).
Supplementary Material
Supplemental data for this article can be accessed https://doi.org/10.1080/1573062X.2023.2180394
Additional information
Funding
References
- Asleson B C, Nestingen R S, Gulliver J S, Hozalski R M and Nieber J L. (2009). Performance Assessment of Rain Gardens. JAWRA Journal of the American Water Resources Association, 45(4), 1019–1031. 10.1111/j.1752-1688.2009.00344.x
- Basile, A., A. Coppola, R. De Mascellis, G. Mele, and F. Terribile. 2007. “A Comparative Analysis of the Pore System in Volcanic Soils by Means of Water-Retention Measurements and Image Analysis.” Soils of Volcanic Regions in Europe: 493–513. Springer, Berlin, Heidelberg. doi:10.1007/978-3-540-48711-1_35.
- De-Ville, Simon, Daniel Green, Jill Edmondson, Ross Stirling, Richard Dawson, and Virginia Stovin. 2021. “Evaluating the Potential Hydrological Performance of a Bioretention Media with 100% Recycled Waste Components.” Water 13 (15): 1–24. doi:10.3390/w13152014.
- De-Ville, Simon, Manoj Menon, Xiaodong Jia, George Reed, and Virginia Stovin. 2017. “The Impact of Green Roof Ageing on Substrate Characteristics and Hydrological Performance.” Journal of Hydrology 547: 332–344. Elsevier. doi:10.1016/j.jhydrol.2017.02.006.
- Ebrahimian, Ali, Kristin Sample-Lord, Bridget Wadzuk, and Robert Traver. 2020. “Temporal and Spatial Variation of Infiltration in Urban Green Infrastructure.” Hydrological Processes 34 (4): 1016–1034. John Wiley and Sons Ltd. doi:10.1002/HYP.13641.
- Emerson, Clay H., and Robert G. Traver. 2008. “Multiyear and Seasonal Variation of Infiltration from Storm-Water Best Management Practices.” Journal of Irrigation and Drainage Engineering 134 (5): 598–605. American Society of Civil Engineers. doi:10.1061/(ASCE)0733-9437(2008)134:5(598).
- Fassman, Elizabeth, and Robyn Simcock. 2012. “Moisture Measurements as Performance Criteria for Extensive Living Roof Substrates.” Journal of Environmental Engineering 138 (8): 841–851. doi:10.1061/(ASCE)EE.1943-7870.0000532.
- FLL (Forschungsgesellschaft Landschaftsentwicklung Landschaftsbau). 2008. ”In Guidelines for the Planning, Construction and Maintenance of Green Roofing.” Bonn Germany.
- Garza, Pablo R., Andrea Welker, and Sarah Rife. 2016. “Forensic Analyses of Two Failed Rain Gardens in a Tract Development in Glasgow, Delaware,” American Society of Civil Engineers, 60–68. doi:10.1061/9780784480175.005.
- Hardy, Robert A, Michael R James, Jacqueline M Pates, and John N Quinton. 2017. “Using Real Time Particle Tracking to Understand Soil Particle Movements during Rainfall Events.” CATENA 150: 32–38. Elsevier. doi:10.1016/J.CATENA.2016.11.005.
- Hardy, Robert A, Jacqueline M Pates, John N Quinton, and Michael P Coogan. 2016. “A Novel Fluorescent Tracer for Real-Time Tracing of Clay Transport over Soil Surfaces.” CATENA 141: 39–45. Elsevier. doi:10.1016/J.CATENA.2016.02.011.
- Hardy, R. A, J. N Quinton, M. R James, P Fiener, and J. M Pates. 2019. “High Precision Tracing of Soil and Sediment Movement Using Fluorescent Tracers at Hillslope Scale.” Earth Surface Processes and Landforms 44 (5): 1091–1099. John Wiley and Sons Ltd. doi:10.1002/esp.4557.
- Hatt, B.E., T.D. Fletcher, and A. Deletic. 2007. “Hydraulic and Pollutant Removal Performance of Stormwater Filters under Variable Wetting and Drying Regimes.” Water Science and Technology 56 (12): 11–19. IWA Publishing. doi:10.2166/WST.2007.751.
- Hunt, W. F., J. T. Smith, S. J. Jadlocki, J. M. Hathaway, and P. R. Eubanks. 2008. “Pollutant Removal and Peak Flow Mitigation by a Bioretention Cell in Urban Charlotte, N.C.” Journal of Environmental Engineering 134 (5): 403–408. American Society of Civil Engineers. doi:10.1061/(ASCE)0733-9372(2008)134:5(403).
- Jenkins, B M. Wadzuk, Jennifer K. Gilbert, Bridget M. Wadzuk, and Andrea L Welker. 2010. “Fines Accumulation and Distribution in a Storm-Water Rain Garden Nine Years Postconstruction.” Journal of Irrigation and Drainage Engineering 136 (12): 862–869. American Society of Civil Engineers. doi:10.1061/(ASCE)IR.1943-4774.0000264.
- Kandra, Harpreet, David McCarthy, and Ana Deletic. 2015. “Assessment of the Impact of Stormwater Characteristics on Clogging in Stormwater Filters.” Water Resources Management 29 (4): 1031–1048. doi:10.1007/s11269-014-0858-x.
- Langergraber, G., R. Haberl, J. Laber, and A. Pressl. 2003. “Evaluation of Substrate Clogging Processes in Vertical Flow Constructed Wetlands.” Water Science and Technology 48 (5): 25–34. IWA Publishing. doi:10.2166/WST.2003.0272.
- Le Coustumer, Sébastien, Tim D. Fletcher, Ana Deletic, Sylvie Barraud, and Justin F. Lewis. 2009. “Hydraulic Performance of Biofilter Systems for Stormwater Management: Influences of Design and Operation.” Journal of Hydrology 376 (1–2): 16–23. Elsevier. doi:10.1016/J.JHYDROL.2009.07.012.
- Liu, Ruifen, and Elizabeth Fassman-Beck. 2018. “Pore Structure and Unsaturated Hydraulic Conductivity of Engineered Media for Living Roofs and Bioretention Based on Water Retention Data.” Journal of Hydrologic Engineering 23 (3): 04017065. doi:10.1061/(ASCE)HE.1943-5584.0001621.
- Natarajan, Poornima, and Allen P. Davis. 2015. “Hydrologic Performance of a Transitioned Infiltration Basin Managing Highway Runoff.” Journal of Sustainable Water in the Built Environment 1 (3): 04015002. American Society of Civil Engineers. doi:10.1061/JSWBAY.0000797.
- Paus, Kim H., Joel Morgan, John S. Gulliver, TorOve Leiknes, and Raymond M. Hozalski. 2013. “Assessment of the Hydraulic and Toxic Metal Removal Capacities of Bioretention Cells after 2 to 8 Years of Service.” Water, Air, & Soil Pollution 2013 225:1 225 (1): 1–12. Springer. doi:10.1007/S11270-013-1803-Y.
- Peng, Zhangjie, Colin Smith, and Virginia Stovin. 2020. “The Importance of Unsaturated Hydraulic Conductivity Measurements for Green Roof Detention Modelling.” Journal of Hydrology 590: 125273. Elsevier B.V. doi:10.1016/j.jhydrol.2020.125273.
- Sansalone, John J., Joseph M. Koran, Joseph A. Smithson, and Steven G. Buchberger. 1998. “Physical Characteristics of Urban Roadway Solids Transported during Rain Events.” Journal of Environmental Engineering 124 (5): 427–440. American Society of Civil Engineers. doi:10.1061/(ASCE)0733-9372(1998)124:5(427).
- Selbig, WR, and RT Bannerman. 2011. Characterising the Size Distribution of Particles in Urban Stormwater by Use of Fixed-Point Sample-Collection Methods. Geological Survey Open-File Report 2011–1052. https://pubs.er.usgs.gov/publication/ofr20111052
- Smith, Christine, Rebecca Connolly, Richard Ampomah, Amanda Hess, Kristin Sample-Lord, and Virginia Smith. 2021. “Temporal Soil Dynamics in Bioinfiltration Systems.” Journal of Irrigation and Drainage Engineering 147 (11): 04021053. doi:10.1061/(asce)ir.1943-4774.0001617.
- Stovin, Virginia, Simon Poë, Simon De-Ville, and Christian Berretta. 2015. “The Influence of Substrate and Vegetation Configuration on Green Roof Hydrological Performance.” Ecological Engineering 85: 159–172. doi:10.1016/j.ecoleng.2015.09.076.
- Susdrain. 2016. “Grey to Green Phase 1, Sheffield.” chrome-extension://efaidnbmnnnibpcajpcglclefindmkaj/viewer.html?pdfurl=https%3A%2F%2Fwww.susdrain.org%2Fcase-studies%2Fpdfs%2F006_18_03_28_susdrain_suds_awards_grey_to_green_phase_1_light.pdf&clen=1903078&chunk=true
- Winter, K.-J., and D. Goetz. 2003. “The Impact of Sewage Composition on the Soil Clogging Phenomena of Vertical Flow Constructed Wetlands.” Water Science and Technology 48 (5): 9–14. IWA Publishing. doi:10.2166/WST.2003.0268.
- Woods-Ballard, B, S Wilson, H Udale-Clarke, S Illman, T Scott, R Ashely, and R Kellagher. 2015. The SuDS Manual. London: CIRIA. C697.
- Yio, Marcus H N, Virginia Stovin, Jorg Werdin, and Gianni Vesuviano. 2013. “Experimental Analysis of Green Roof Substrate Detention Characteristics.” Water Science and Technology 68 (7): 1477–1486. doi:10.2166/wst.2013.381.