
 ?Mathematical formulae have been encoded as MathML and are displayed in this HTML version using MathJax in order to improve their display. Uncheck the box to turn MathJax off. This feature requires Javascript. Click on a formula to zoom.
ABSTRACT
The establishment of effective medium and long-term rehabilitation strategies is essential to counter the continuous process of deterioration of the water distribution networks. A novel methodology to support pipe rehabilitation planning, including the establishment and scheduling of interventions in the medium and long-term using the graph theory, is developed, and demonstrated using a real case study. This methodology is divided into two main phases: the first is the definition of rehabilitation pipe groups according to the available budget and pipes connectivity and the second is the scheduling of these groups over time according to relevant criteria. This approach allows a clearer correspondence between the financial amounts to be annually invested in rehabilitation and a grouping of single pipes to be rehabilitated. Results demonstrate that the methodology allows a better and advanced planning of interventions when compared with the current traditional approaches applied by water utilities.
Introduction
Water distribution networks (WDN) ageing is a natural and inevitable process, in which these systems present multiple symptoms of deterioration, such as high leakage levels, frequent pipe bursts and water quality problems, that can seriously compromise the operation, efficiency, and reliability of the system as a whole (Carriço et al. Citation2020). In addition, high accumulated levels of deferred rehabilitation indicate the existence of large extensions of pipes that are in an advanced state of deterioration (Amaral, Alegre, and Matos Citation2017).
Establishing effective rehabilitation strategies considering a medium and long-term perspective is a complex and data-demanding decision-making process (Salehi et al. Citation2022; Tscheikner-Gratl et al. Citation2016). Due to the impossibility of carrying out extensive visual inspections of the network, as pipes are mostly buried and of small diameter, data collection and analysis is essential for supporting the decision process. Often, available data are incomplete and inaccurate, or even do not exist, which is a constraint that has been shaping the formal methodologies implemented in real-life systems.
Several studies have been developed to address WDN rehabilitation problems using different approaches. Most common approaches are life-cycle cost analysis (Francisque et al. Citation2016), risk analysis (Phan et al. Citation2019; Robles-Velasco et al. Citation2021; Salehi et al. Citation2021; Shahata and Zayed Citation2016; Wang and Suzhen Citation2020), pipe failure modelling (Winkler et al. Citation2018; Scheidegger, Leitão, and Scholten Citation2015), and multi-criteria decision analysis (Salehi et al. Citation2022; Salehi, Jalili Ghazizadeh, and Tabesh Citation2018; Scholten et al. Citation2014). Current approaches tend consider more than one dimension of analysis (e.g. cost, risk, image), being preferred broader and more comprehensive approaches that attend to multiple stakeholders’ points of view and concerns (Scholten et al. Citation2014; Tscheikner-Gratl et al. Citation2015). However, these methodologies are difficult to apply in practice, as most are applied to single pipes as defined and discretized in the Geographic Information System (GIS) (Chen, Man, and Michael Daly Citation2021). Also, water utilities do not usually plan and implement rehabilitation interventions on single pipes, but rather on sets of contiguous pipes whose rehabilitation complies with a pre-determined available budget (Fengfeng et al. Citation2015; Ramos-Salgado, Aparicio-Ruiz, and Onieva Citation2022; Rokstad and Maria Ugarelli Citation2015). The main advantage of having sets of pipes is the minimization of construction costs and the better management of the civil works and the respective perturbations to users and third parties.
Different techniques have been proposed for grouping water pipes. Nafi and Kleiner (Citation2010) developed an approach to schedule the replacement of pipes subjected to budget constraints and considering cost savings associated with: (i) the coordination with other scheduled roadworks, (ii) the grouping of contiguous pipes, and (iii) the significant discounts made by manufacturers when purchasing a large quantity of pipes, for using in the same replacement programme.
Fengfeng et al. (Citation2015) developed a novel decision optimization model for scheduling pipe group replacement by considering the minimization of costs and of service disruptions. Two grouping criteria were considered, the shortest geographic distance, and the minimum service disruption. A case study is presented to test the model and to assess the benefits of grouping pipes compared to approaches using single pipes. Despite the promising results, the authors highlight the importance of considering more criteria in the analysis, as previously stated by Nafi and Kleiner (Citation2010).
Rokstad and Maria Ugarelli (Citation2015) proposed a similar method applied to the entire network in service, ensuring that an optimal grouping is achieved not only in the short term but also in the long term. This makes the problem more computational demanding when compared to previous approaches. A greedy algorithm with an element of randomness was proposed to tackle this complex combinatorial decision problem. Despite the efficiency of the proposed algorithm not being explored, the obtained solution is economically advantageous when compared to replacement strategies without pipe grouping.
Clemens, Adey, and Lethanh (Citation2017) investigated two distinct approaches for grouping pipes in rehabilitation work programs: (i) the static neighbourhood and (ii) the dynamic neighbourhood. Conceptually, in the static neighbourhood, a mesh of polygons is applied to the entire network and the pipes are grouped according to the polygon that contains them; this procedure is independent of the methodology. In a dynamic neighbourhood, the groups are dynamically calculated within the methodology. The dynamic neighbourhood approach showed high potential to be extended and the benefits of coordinating rehabilitation interventions between different infrastructures were verified. An innovative aspect identified is to explore, in a combined way, three different concepts of neighbourhood criteria and the probability of pipe failure. In Clemens and Adey (Citation2020), the dynamic neighbourhood methodology is expanded to find economically optimal intervention programs. Genetic algorithms are used for this purpose considering several criteria, such as capital costs, potential interruptions of service and the associated costs (i.e. interventions in a network sector can increase the failure probability in another), and the cost reduction when interventions are carried out in several network sectors at the same time.
More recently, Ramos-Salgado et al. (Citation2021) developed a two-stage algorithm that allows the establishment of rehabilitation programmes using a multi-objective genetic algorithm tuned by a local search that aggregates ‘street sections’ that are strictly geographical areas containing pipes of the water and wastewater networks. Initially, the pipes are assessed using the risk index proposed by Muñuzuri et al. (Citation2020) and aggregated to the street section by weighting with the pipe length. The different street sections are grouped by contiguity until the respective construction costs reach the available budget. Ramos-Salgado, Aparicio-Ruiz, and Onieva (Citation2022) integrated the previous approach in long-term planning and concluded that incorporating grouping algorithms defined by proximity criteria (called ‘convenience criteria’), resulted in higher investment needs compared to the approach applied to single pipes, but, in return, they are more realistic and practicable.
Previous research works highlight the economic benefits of integrating pipe grouping approaches in network rehabilitation methodologies as well as the importance to attend to several criteria given the complexity and multi-dimensional nature of the decision problem. Despite being identified with research potential, the coordination of different infrastructures in the rehabilitation process is not considered herein, being the focus the WDN. This decision is related to the author’s opinion that the various urban networks have different physical behaviours and there is still research to be developed in each network individually before moving towards the coordination of civil works between them. However, it is relevant to consider the isolation valve system within the scope of the network’s rehabilitation, more specifically for the establishment of pipes groups to be replaced and their scheduling in the medium and long term. To the authors’ knowledge, there are no studies that consider this aspect.
In practice, network maintenance activities can only be carried out when pipes can be isolated through the closure of existing valves (Giustolisi et al. Citation2022). Usually, a subset of valves that directly separates a small portion of the network (e.g. causing the least possible impact on the provided service) is closed to repair or replace the pipe (Giustolisi and Savic Citation2010). The subset of pipes that are out of service due to valve closure was first called a ‘segment’ by Walski (Citation1993). Depending on the localization of the valves in the network, the set of pipes that constituted the segment can considerably vary in size. This concept has been used in the scope of systems reliability and vulnerability analysis (Wéber, Huzsvár, and Hős Citation2020; Liu et al. Citation2017; Giustolisi Citation2020). Nevertheless, it has not been used in the context of pipe rehabilitation, despite the numerous associated advantages, namely, practicality in carrying out maintenance or repair activities and homogeneity of the structural condition of pipes within a segment.
This paper develops a novel approach to group network segments (i.e. pipes connected between isolation valves) instead of grouping single pipes. The graph concept proposed by Walski (Citation1993) is used, in which each segment is represented by a node and the adjacency between segments is described by an arc. This allows solving the discrete combinatorial problem using a graph, where contiguity is represented by arcs connecting nodes (i.e. segments).
The proposed methodology aims at supporting pipe rehabilitation planning, including the establishment, and scheduling of interventions in the medium and long-term using the graph theory. This methodology is divided into two main phases: the first is the definition of pipe grouping according to an available budget (referred to herein as rehabilitation units), and the second is the interventions scheduled overtime according to predefined criteria. The new methodology is demonstrated with a real case study and results are thoroughly discussed. The main novelties are: the problem formulation using political districting approach; the use of graph theory to represent groups of pipes between isolation valves; the consideration of several criteria to establish the pipe groups (i.e. pipe contiguity and cost); and the use of two criteria for the scheduling of investment in the long-term.
Proposed methodology
The proposed methodology for pipe grouping and rehabilitation intervention planning in WDN is divided into two phases: i) definition of rehabilitation units and ii) rehabilitation planning along time. These phases are further explained in the following sub-sections.
Definition of rehabilitation units
First phase rational
The definition of rehabilitation units is a discrete combinatorial problem in which the complexity increases according to the size of the network and the considered constraints. Unlike the budget constraint, the contiguity constraint has deeper implications for modelling the problem. An approach commonly followed for modelling contiguity is the use of a graph structure (Tavares-Pereira et al. Citation2007; Dilip et al. Citation2008), as this is an effective and natural way of representing spatially distributed elements and their connections (Ricca, Scozzari, and Simeone Citation2013).
The proposed approach herein is based on the models of Political Districting (PD) given their effectiveness in solving problems with the characteristics of the analysed one. The PD approach is based on the voting method used in many countries, like the United States of America, which consists of subdividing a given territorial area into a fixed number of voting districts, where a certain number of seats based on the population is allocated to each district. The lack of formal models to carry out this procedure has allowed parties to manipulate the district size (i.e. number of resident citizens) and their shape, thus favouring the final distribution of seats. This practice is known as gerrymandering and has attracted the interest of researchers who began to develop impartial formal models for the definition of districts, being the pioneer works developed by Hess et al. (Citation1965) and, later, by Garfinkel and Nemhauser (Citation1970).
Since then, several researchers have developed new models and quickly realized the potential of the generalization of this approach to other real-world problems. Districts are geographic clusters resulting from the grouping of small geographic areas, called basic units (Kalcsics and Ríos-Mercado Citation2015). Generally, districting models are based on four criteria: i) integrity, ii) balance, iii) contiguity, and iv) compactness. The rationale for using these criteria is that each basic unit must belong to only one district (integrity); districts should have approximately the same size (balance); it must be possible to walk from any point to another without leaving the district (contiguity); and each district cannot be irregularly shaped (compactness).
The methodology of districting is adapted herein to establish the groups of pipes, hereafter referred to as rehabilitation units, so that each group has similar construction costs. Each rehabilitation unit is composed of contiguous segments (i.e. sets of pipes between isolation valves) and each segment can only belong to one rehabilitation unit. The compactness criterion is not considered herein, since pipe groups with irregular shapes are common in WDN, very much depending on the network topology and spatial distribution.
For the grouping of the pipes in the referred rehabilitation units, three complementary procedures need to be sequentially carried out: i) segment definition and characterization, ii) graph building and iii) pipe grouping. These procedures are detailed in the following sections.
Segment definition and characterization
Segments are the basic units in the generic districting problem. In the context of pipe rehabilitation, a segment includes all adjacent and connected pipes located between isolation valves, being composed of multiple pipes or of a single pipe, when the pipe has isolation valves at both ends. In other words, a segment can be characterized as the set of pipes that will necessarily be taken out of service to rehabilitate a pipe contained therein. This means that rehabilitation interventions can only be carried out at the segment level, excluding the possibility of rehabilitating single pipes as defined in the GIS.
Once the segments are defined, the rehabilitation costs are calculated for each segment considering the cost functions developed by Marchionni et al. (Citation2016), based on pipe material and diameter. The cost calculation is carried out for each pipe of the segment and added to the total cost of the respective segment.
Graph building
The segment graph proposed by Walski (Citation1993) is used to model contiguity. Formally, a segment graph is represented by a planar graph, undirected and connected , where the set of nodes
represent the segments and the set of edges
represents the valves that connect segments, where
, denote two adjacent segments
and
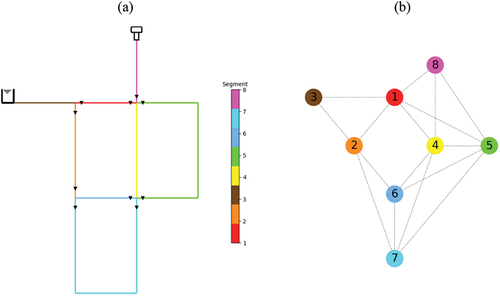
. Segments connected through an arc mean that there is a boundary valve between them. depicts a network based on the benchmark water network, Net1 (Klise et al. Citation2017), to demonstrate the conversion from the classic node-arc topology to the segment-valve topology. shows that the pipe network in which each of the eight (pipe) segments is delimited at the extremities by one or more isolation valves (represented by triangles). Each segment in the classic node-arc topology has a corresponding node in the graph in segment-valve topology ().
Figure 1. Example of a pipe network descripted in (a) the classic node-arc topology, and (b) segment-valve topology.
Pipe grouping
An optimization model based on the districting approach is used for the pipe grouping, aiming to define rehabilitation units composed of contiguous segments, with homogeneous construction costs and as close as possible to the available budget.
As previously mentioned, the segment graph is used to model contiguity and graph theory terminology is used. A solution is a partition of the segment graph into groups of nodes that represent the various rehabilitation unit to optimize a given criterion. For contiguity to be respected, the subgraph generated from the groups defined in the solution must have only one component. In other words, each partition is composed of a set of segments that are internally connected but disconnected from the rest of the nodes of the segment graph (Al-Taie and Kadry Citation2017). Contiguity validation index is computed for each segment as follows:
where is the contiguity validation index associated with the rehabilitation unit
,
is the maximum number of segments connected to each other in the rehabilitation unit
and
is the total number of segments associated with the rehabilitation unit
.
The objective function used is defined by two conditions: if the contiguity is respected, the function allows the homogenization of construction costs and accumulates the construction costs; if contiguity is not respected, the function describes how close the solution is to a contiguous solution. The objective function, denoted by , is defined as follows:
where are the number of rehabilitation units,
is the cost of intervention of segment
in rehabilitation unit
,
is the pre-defined budget and
is a penalty constant (i.e. usually a high value).
In this paper, the Tabu Search (TS) metaheuristic was used to solve this optimization problem, being a heuristic algorithm that allows, from a set of randomly generated solutions, to iteratively improve solutions according to the previously defined objective function. At each iteration the objective function is computed for all possible movements i.e. each node of the graph can belong to only one group. Once all possible moves are computed, the best move is selected. Note that a penalty factor, , is applied to moves that generate non-contiguous solutions. The process is repeated until the termination criterion is met. In this case, this criterion corresponds to a predefined maximum number of iterations without any improvement of the objective function value.
This algorithm was implemented in Python programming language using the rustworkx library (Treinish et al. Citation2021). This library allows the integration of heuristics that characterize neighbourhood relations in a graph in a performative way. One of the main advantages of this algorithm is that avoids the return to the previously visited solutions through memories, called tabu list, which serves as a historical record of the visited solutions (Gendreau and Potvin Citation2019).
shows an example of a set of iterations carried out by using this algorithm from an initial solution. To follow the iterative process of the algorithm, it is necessary to know the rehabilitation cost associated with each node, , and the budget, B. The costs associated with each node are 15, 17, 7, 23, 22, 17, 29 and 7, respectively, from nodes 1 to 8. The budget limit is 45. Since it is an illustrative example, the referred values do not have units.
Figure 2. Illustrative example of Tabu Search moves: (a) initial solution; (b) 1st iteration; (c) 2nd iteration; (d) 3rd iteration and (e) 4th iteration.
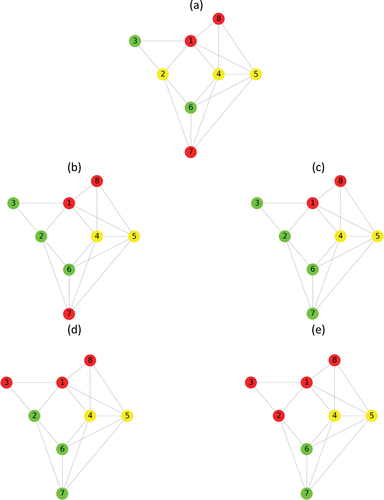
In this example, each node of the graph has the possibility of belonging to one and only one of the three groups (i.e. rehabilitation units) represented in green, yellow and red. The initial solution is not contiguous which implies a value in the function of≈1.63k (
,
and
). Once the initial solution has been evaluated, the objective function is computed for all solutions by changing the group associated with a unique node (i.e. red, yellow and green). depicts that the assignment of node 2 to the green group is the move that most benefits the objective function, improving the value to≈1.12k (
,
and
). Note that in this step the yellow and green groups already respect contiguity. In , the procedure is repeated, and the assignment of node 7 to the green group results in an improvement to a value of 48 (
,
and
). At this moment the solution is contiguous. Henceforth, the selected moves will decrease the sum of deviations from the previously defined budget. demonstrates that assigning node 3 to the red group improves the objective function value to 34 (
,
and
). depicts the best degenerate solution from initial solution in which the objective function value is 2 (
,
and
and
). In other words, it is the solution that results in the smallest sum of deviations for each rehabilitation unit from the defined budget. Through the application of this algorithm, the red, yellow and green units present associated rehabilitation costs of 46, 45 and 46 respectively i.e. the costs are considered homogeneous.
Rehabilitation planning
Second phase rational
The second stage of the proposed approach is rehabilitation planning which consists of the prioritization and scheduling of the rehabilitation interventions (units) over time. Two assessment criteria are considered and aggregated with a weighted sum, in which the highest final score indicates the highest rehabilitation priority. This approach allows ranking of the rehabilitation units and, accordingly, their scheduling over time. An important assumption is that each rehabilitation unit is assigned a single year which represents the beginning of the civil works, even if the duration of these works exceeds one year. The scheduling of the rehabilitation units’ intervention is assessed over time considering two different criteria described by two metrics as explained in the following sections.
Building a set of criteria
Two criteria are considered and applied to rehabilitation units to prioritise the rehabilitation activities, namely the Average Residual Life and the Percentage of Asbestos Cement pipes.
The Average Residual Life (ARL) of a rehabilitation unit describes the average remaining age of the rehabilitation unit pipes weighted by the respective length, being mathematically described as follows:
where is the reference time (i.e. year of analysis),
is the percentage of average residual life of a certain rehabilitation unit at time
,
is the total number of pipes in a specific rehabilitation unit,
is the length of the pipe
,
is the residual service life of the pipe
in the year
. In other words, residual service life,
, represents the number of remaining years of service that pipe
has in the year
, until reaching the expected service life. If a pipe has reached the end of its expected service life,
will be negative and will account for the amount of time the residual service life of the pipe has been exceeded.
The ARL is expressed in years and is a measure of the need for the rehabilitation unit intervention (i.e. the lowest value refers to the highest priority). The values vary linearly between the pipe service life (i.e. upper limit) and a theoretically infinite negative number, if no pipe is rehabilitated. The ARL of a rehabilitation unit assumes the minimum value the year before the unit is rehabilitated and the maximum value the year of the rehabilitation is initiated.
The residual service life of a rehabilitation unit depends on the expected service life of each of its pipes that depends on pipe material and manufacturer, the transport, storage and installation conditions, and operations and maintenance practices.
Asbestos cement is a pipe material that is no longer used, as asbestos fibres are carcinogenic when inhaled. Although there is no evidence of increased risk to human health of this material in contact with water, operators who handle and cut these pipes in case of a failure repair are exposed to that risk. Thus, the Percentage of Asbestos Cement pipes (PAC) in each rehabilitation unit is used as an imperative criterion in decision-making, being formally described as follows:
in which is the percentage of asbestos cement pipes in a certain rehabilitation unit at time
,
is the number of AC pipes within the rehabilitation unit,
is the length of AC pipes within the rehabilitation unit (m),
is the total number of pipes and
is the length of all pipes of the rehabilitation unit. As described by EquationEquation (4)
(4)
(4) , PAC is expressed in percentage.
Scheduling interventions
The scheduling of the interventions in the rehabilitation units is carried out through the application of a weighted sum that allows the aggregation of the scores computed in the two criteria in a single one that describes the need for rehabilitation. Once the score is computed, the rehabilitation units are ordered from the highest to the lowest, thus constituting a priority ranking. Each unit is sequentially assigned to one specific year, according to that score.
To aggregate the criteria values, a normalization is required due to different scales and directions of preference. Note that the direction of preference of the two criteria is inverse i.e. the lower PAC value, the better the assessment in the criterion. The opposite happens for the ARL criterion.
A Min-Max normalization is used to rescale the original values to values between 0–1. For this, the PAC criterion considers as a maximum value a situation where the rehabilitation units is be entirely composed of AC (i.e. PAC = 100%) and as a minimum value a situation where this material does not exist (i.e. PAC = 0%). The normalization of the ARL has the following rationale: the maximum value is considered equal to the expected service life after rehabilitation (50 years); and the minimum value is described by the total lack of rehabilitation during an investment cycle of 50 years in the oldest rehabilitation unit, that is the one with the lowest ARL (e.g. for ARL = 5 years, the minimum value is ‒45 years).
Evolution of the system performance over time
Once the schedule of the rehabilitation unit interventions has been defined, it is important to assess the evolution of the system’s performance over time through two performance indicators, namely, the Infrastructure Value Index and the PAC of the whole network.
The Infrastructure Value Index (IVI) is described as follows (Cabral, Loureiro, and Covas Citation2019; Alegre, Vitorino, and Coelho Citation2014):
where is the reference time (i.e. year of analysis),
is the infrastructure value index at time
,
is the total number of pipes in the whole network,
is the rehabilitation cost of pipe
at time
,
is the residual service life of pipe
at time
and
is the expected service life of pipe
.
According to Alegre, Vitorino, and Coelho (Citation2014), the IVI is a measure that reflects the degree of youth, maturity or ageing of an infrastructure. A mature and well-maintained infrastructure presents values between 0.4–0.6, whereas young infrastructure, old infrastructures subject to recent and significant expansion phases and old infrastructures subject to overinvestment in rehabilitation present values above 0.6. Low IVI values reflect the lack of investments in rehabilitation. Water utilities in Portugal in general have been built for several decades, and the main challenge is to maintain IVI values between 0.4–0.6. Therefore, rehabilitation rates between 1% and 2% need to be performed annually so that the values remain in this range.
It is important to highlight that the IVI assumes that the economic depreciation and physical degradation of pipes are linear and does not consider the influence of O&M practices, nor of the technical performance of the system. Despite these simplifications, it is a useful indicator to assess the network as a whole.Monitoring the PAC present throughout the WDN is also assessed. Until the 1980s, AC was largely used in the construction of water distribution networks. Currently, AC networks are the most aged and have, probably, the most deteriorated pipes in service. Since this material, composed of asbestos fibres, is harmful to human health when inhaled, it has stopped being used and has been replaced by plastic pipes (PVC and PE). Currently, the replacement of AC pipes is a priority to most water utilities. It should be noted that the rehabilitation of the units implies, not only the updating of the residual service life but also the type of material. The modern equivalent pipe considered herein to replace the AC pipes is PVC, regardless of the pipe diameter.
Results analysis and discussion
Case study description
The developed methodology is applied to a real case study of a small WDN located in the south of Portugal. The WDN has approximately 113 km of pipes with diameters ranging from 60 to 700 mm of different materials, predominantly asbestos cement (60%) and PVC (33%), mostly installed in the 1980s or earlier, and 521 isolations valves. Currently, the water utility that manages this infrastructure is beginning to face the consequences of the advanced deterioration of the infrastructure given the low rehabilitation rates applied in the past, namely, high levels of leakage and increasingly more frequent pipe bursts. For the sake of simplification, all pipes are assumed to have an expected service life of 50 years; yet, several sensitivity analyses will be carried out in section 3.4 to analyse the effect of service life in the rehabilitation planning. Note that different expected service lives can be easily assigned to groups of pipes and, thus, integrated into the methodology. The scheduling procedure and IVI calculation will be sensitive to these considerations.
Analysis of rehabilitation strategies
Two rehabilitation strategies are compared considering a long-term perspective, before applying the proposed approach. These strategies are: (i) the status quo, which is characterized by the maintenance of the reactive rehabilitation currently applied, that is the rehabilitation is carried out only on small sections of pipes during the pipe repair after the burst and (ii) the rehabilitation of the pipes once these reach the end of their expected service life. It is considered that the service life of the existing pipes is 50 years, regardless of the pipe material and diameter.
The analysis of the status quo situation is fundamental, since it allows to better understand the impacts of maintaining or changing the current practices. depicts the evolution of the PAC and IVI throughout a 100-year period. The value associated with the PAC in the year of analysis (i.e. 2022) is 60% and decreases at a rate of 0.1% over time (i.e. replacement of small pipe sections due to failures). The IVI is 0.25 in the year of analysis, which denotes a mature network with a lack of investment in rehabilitation, and rapidly declining to zero, highlighting the urgency of changing the current practices.
Figure 3. Evolution of IVI and PAC: (a) status quo situation, (b) traditional strategy in which single pipes are rehabilitated that reach their expected service life and (c) novel methodology.
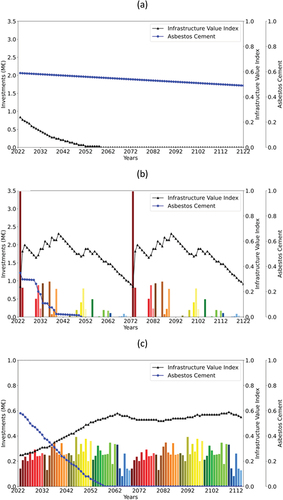
The second strategy is the rehabilitation of single pipes when reaching the end of their expected service life. An expected service life of 50 years is considered which implies that at the end of 50 years an investment cycle is completed i.e. the entire WDN is rehabilitated. depicts the phasing of rehabilitation to be carried out over 50 years and the respective geospatial distribution, in which the colour represents the decade of the investments, and the gradient allows differentiation by years (i.e. darker tones represent a higher priority within the respective decade). The evolution of the PAC and IVI shows the existence of investment peaks and, also, the absence of investments for long periods. This results in the non-constancy of the IVI value compared to the recommended ones. The highest peak of investment occurs in 2023 and corresponds to 30% of the investment needed to rehabilitate the entire WDN. This happens because a large number of pipes have already exceeded their expected service life in the year of analysis, which demonstrates the deferral of investment needs.
Figure 4. Geospatial representation of the schedule of interventions in rehabilitation units: (a) traditional strategy in which single pipes are rehabilitated that reach their expected service life and (b) novel methodology.
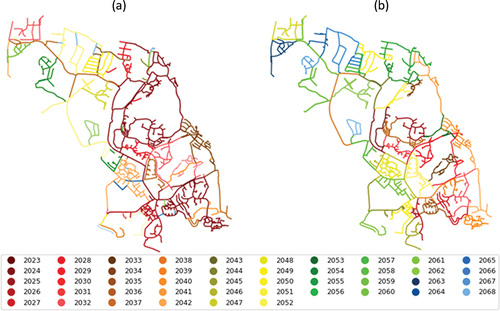
On the other hand, a detailed analysis of shows that, in the first two decades, more than 75% of the investment is carried out. The high investment efforts required from utilities in certain periods make the use of this strategy often impracticable. Furthermore, this approach considers single pipes, i.e. do not exploit the benefits of rehabilitating groups of contiguous pipes. shows that contiguity is not respected, since there is some spread of the pipes to be rehabilitated in the same year. This happens because the approach is solely dependent on the expected service life of the pipes and does not consider any contiguity criterion.
The methodology presented in this paper aims to solve the main barriers encountered in the application of the approaches described above, namely the mitigation of the investment peaks by adapting the methodology according to the financial availability of the water utility, ensuring the establishment of sustainable and continuous investments and a clear correspondence between the investment and the group of contiguous pipes to be rehabilitated.
Application of the proposed approach to the case study
The proposed two-stage methodology is applied to the case study. depicts the WDN represented through the segment-valve topology. According to the decision-makers of the water utility (i.e. the Executive Board), the annual budget to invest in rehabilitation in the WDN over time is 250 k€. Once the annual budget has been defined, the grouping of pipes is carried out to establish the rehabilitation units. A total of 46 rehabilitation units are generated, as a result of the grouping of 397 segments. depicts the allocation of segments to the respective unit. Colours are used to differentiate each rehabilitation unit. Note that integrity and contiguity constraints are always respected, the same can be verified through the analysis of .
Figure 5. Representation of the distribution network in the segment-valve topology with grouping pipes.
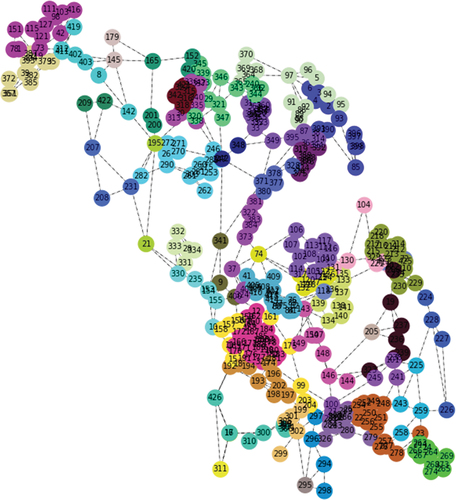
The scheduling of the interventions in the units over time is carried out considering the same weights for the criteria (i.e. 50% for ARL and 50% for PAC). The investment cycle allowing the entire infrastructure to be rehabilitated is about 46 years. depicts the scheduling of rehabilitation interventions to be carried out over 46 years, according to the representation scheme of .
In , the rehabilitation units with the highest rehabilitation priority are located in two well-limited areas of the network (i.e. represented in red and orange), indicating that the oldest pipes are found in these areas. The units categorized in green and blue will deteriorate through the natural ageing process in a few decades and need to be urgently rehabilitated. Analogously to the behaviour of the ‘first-in, first-out’ queue computational structure, the rehabilitation units after interventions will go to the end of the priority queue. For instances, the rehabilitation unit scheduled to be implemented in 2023 will be rehabilitated again in 2069, after an investment cycle of 46 years.
depicts the evolution of PAC and IVI over time. Due to the high extension of asbestos cement material pipes in 2022, only in 2058 is it possible to eliminate this material. Regarding IVI, it has a gradual improvement, reaching a value of 0.4 by 2041, which is acceptable for an ageing infrastructure with adequate rehabilitation practices. Keeping this schedule of investments, the IVI will remain between 0.4 and 0.6 at least until 2114 (i.e. two investment cycles).
On the other hand, it is possible to observe that investment efforts are spread over time. This is not the case with the aforementioned approach (see 3.2). Thus, the proposed methodology is more adequate for the case where financial availability is a limitation.
Sensitivity analyses
A sensitivity analysis is carried out by varying the parameters of the model that strongly influence the rehabilitation planning and that have a higher uncertainty associated, namely the budget availability and the expected service life of the pipes. The budget availability is often a constraint for the water utilities and has implications in the segment grouping process. The higher the annual available budget to invest in rehabilitation is, the shorter the investment cycle becomes. Also, the expected service life depends on pipe materials and installation, as well as on maintenance practices, varying from utility to utility, and being, often, difficult to specify in order to avoid misleading recommendations. presents the seven scenarios considered in the sensitivity analysis, for budgets the of 150 and 250 k€ and the expected service lives of 50, 75 and 100 years. These values aim to represent utilities with different financial capacities and, also, with different O&M practices that a are reflected in the expected service lives of their assets. Additionally, a scenario where the expected service life varies depending on the pipe material is considered, so 45, 50 and 60 are assumed for AC, PVC/PE and DI, respectively. Note, these are the reference values in Portugal Cabral, Loureiro, and Covas (Citation2019).
Table 1. Scenarios considered in the sensitivity analysis and obtained results.
The methodology was applied to the case study considering these seven scenarios. Results are presented in , in terms of number of rehabilitation units, established value of IVI (i.e. average of the 2nd cycle) and average annual rehabilitation rate (i.e. percentage of the length of pipes rehabilitated annually). , depicts the evolution of the IVI over time, in which the red and green colour bars refer to the first and the second investment cycle, respectively. The evolution of the PAC is not presented, since it hardly varies between scenarios due to the complete replacement of asbestos cement after the first cycle. Note that, after one investment cycle (red bars), all asbestos cement pipes have been replaced and the scheduling becomes a single criterion process, depending only on the ARL of the rehabilitation units.
Figure 6. Sensitivity analysis for (a) Scenario A; (b) Scenario B; (c) Scenario C; (d) Scenario D; (e) Scenario E, (f) Scenario F and (g) Scenario G (red bars − 1st investment cycle; green bars − 2nd investment cycle).
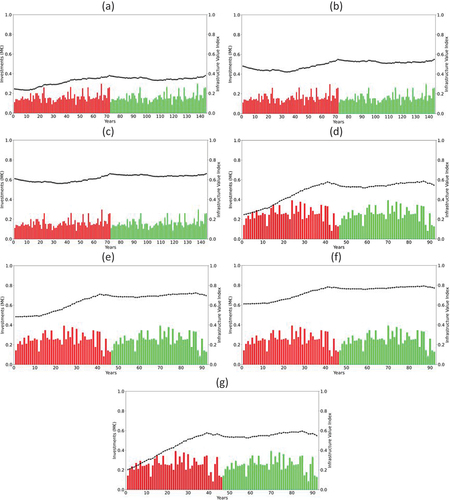
depicts scenarios for the 150 k€ budget, in which 72 rehabilitation units are created meaning that a full rehabilitation cycle of the WDN is about 72 years and implies an average annual rehabilitation rate of 1.4%. depicts scenarios for the 250 k€ budget with only 46 rehabilitation units, implying an average annual rehabilitation rate of 2.2% ().
The IVI for the 150 k€ budget scenarios tends to 0.35, 0.53 and 0.64, respectively, when considering pipe expected service lives of 50, 75 and 100 years, respectively (, whereas the IVI for the 250 k€ budget scenarios tends to significantly higher values (i.e. 0.55, 0.70 and 0.77) for homologous service lives (. Overall, in this particular network, it is necessary a 250 k€ annual budget to have an adequate IVI in the long term when considering pipes’ service lives of 50 years, whereas the necessary annual budget is only 150 k€, when considering longer service lives of 75 years. Comparing with 6(d), the similarities between the two scenarios are highlighted. This similarity demonstrates that the IVI is not sensitive to these variations. Also, note that the reference expected service lives for the different materials are close to 50 years as the network is mostly composed of AC and PVC pipes. The fact is that the service lives are related to the number of rehabilitation units to attain an IVI equal to 0.5 in the long term. In situations where the number of rehabilitation units is less than the expected service life, IVI values tend to stabilize above 0.5. On the other hand, in situations where the number of rehabilitation units is higher than the expected service life, IVI values tend to stabilize below 0.5 (). Therefore, the number of rehabilitation units has implications in the evolution of the IVI over time. If the number of generated units is approximately equal to the value of the expected service life of the pipes, the value of IVI will stabilize very close to 0.5 in the long term. The higher the difference between the number of generated units and the expected service life is, the higher the differences between the recommended IVI value (i.e. 0.5) and the obtained value becomes. The sensitivity analysis shows that there is a close relationship between the available budget and the expected service life.
Carrying out sensitivity analyses is always recommended for making more informed decisions given the uncertainty of the considered model parameters and the subjective nature of the decision-making process in the long-term.
Conclusions
A novel two-step methodology for pipe grouping and rehabilitation works’ scheduling is proposed and illustrated. This approach assumes that rehabilitation works are carried out in groups of contiguous pipes, which is consistent with the actual rehabilitation projects. The political districting formulation is used for pipe grouping considering that the financial resources available (i.e. the annual budget) are approximately constant in time. The annual budget must be defined so that each rehabilitation cycle corresponds to the average expected service life of the pipes (between 50 to 100 years). Accordingly, the network is divided into several rehabilitation units (50 to 100) and, after one rehabilitation cycle, the whole network is replaced.
The proposed pipe grouping approach has been demonstrated to be more advantageous than traditional approaches based only on the analysis of single pipes, as defined in the GIS, or based on pipe clustering. First, the analysis is carried out at the pipe segment level which is composed of a set of single pipes defined between isolation valves, corresponding to the smallest network sector that can be isolated containing those pipes. Second, pipe grouping, creating rehabilitation units, is a rule-based process that involves categorizing data into predefined groups based on the criteria of contiguity and homogenization of construction costs. This procedure concentrates rehabilitation works in contiguous pipes, facilitating the out-of-service operation and, also, creating homogeneous rehabilitation units with the same age, materials, and installation procedure, important for future works. Conversely, pipe clustering, which is a data-driven process that involves finding patterns in the data to create clusters, results in sets of pipes spread all over the network and not necessarily near each other. However, the pipe grouping procedure when considering only the criteria of contiguity and costs has the disadvantage of grouping pipes of different materials, ages and burst history in the same rehabilitation unit. This problem only exists in the first investment cycle. Despite of this weakness, the criterion of homogenization of construction costs is more important from the point of view of financial management of the infrastructure. Methodologies that originate rehabilitation units with unbalanced construction costs are typically not well accepted by decision-makers.
In this paper, the methodology is developed considering only contiguity, costs, average residual life and percentage of asbestos cement, thus, future research should focus on adding more criteria to the analysis, namely, criticality, water losses and energy efficiency. Despite more criteria making the decision more complete and robust, this also adds more complexity and more difficulty to interpret the results; thus, adding more assessment criteria should be done with some parsimony.Additionally, future research should be developed in order to explore and improve the flexibility of the methodology to cover the uncertainty associated with medium and long-term planning (e.g. network expansion, increased hydraulic capacity).
Acknowledgements
The authors would like to thank the Fundação para a Ciência e Tecnologia (FCT) for funding this research and the INFRAMOURA, E.M. water utility for providing the case study and the data.
Disclosure statement
No potential conflict of interest was reported by the authors.
Additional information
Funding
References
- Alegre, H., D. Vitorino, and S. Coelho. 2014. “Infrastructure Value Index: A Powerful Modelling Tool for Combined Long-Term Planning of Linear and Vertical Assets.” Procedia Engineering 89: 1428–1436. Elsevier B.V. doi:10.1016/j.proeng.2014.11.469.
- Al-Taie, Mohammedd, and Seifedine Kadry. 2017. Advanced Information and Knowledge Processing Python for Graph and Network Analysis. Young. http://www.springer.com/series/4738.
- Amaral, R., H. Alegre, and J. S. Matos. 2017. “Highlights of Key International Water Infrastructure Asset Management Initiatives, and Trends, Challenges and Developments in Portugal.” Water Policy 19 (1): 128–146. doi:10.2166/wp.2016.137.
- Cabral, Marta, Dália Loureiro, and Dídia Covas. 2019. “Using Economic Asset Valuation to Meet Rehabilitation Priority Needs in the Water Sector.” Urban Water Journal 16 (3): 205–214. Taylor & Francis. doi:10.1080/1573062X.2019.1648528.
- Carriço, N., B. Ferreira, R. Barreira, A. Antunes, C. Grueau, A. Mendes, D. Covas, L. Monteiro, J. Santos, and I. S. Brito. 2020. “Data Integration for Infrastructure Asset Management in Small to Medium-Sized Water Utilities.” Water Science and Technology 82 (12): 2737–2744. doi:10.2166/wst.2020.377.
- Chen, Thomas Ying Jeh, Chung Man, and Craig Michael Daly. 2021. “Optimizing Cluster Selections for the Replacement Planning of Water Distribution Systems.” AWWA Water Science 3 (4): 1–16. doi:10.1002/aws2.1230.
- Clemens, Kielhauser, and Bryan T. Adey. (2020). “Determination of Intervention Programs for Multiple Municipal Infrastructure Networks: Considering Network Operator and Service Costs.” Sustainable and Resilient Infrastructure 5 (1–2): 49–61. Taylor & Francis. doi:10.1080/23789689.2018.1497879.
- Clemens, Kielhauser, Bryan T. Adey, and Nam Lethanh. 2017. “Investigation of a Static and a Dynamic Neighbourhood Methodology to Develop Work Programs for Multiple Close Municipal Infrastructure Networks.” Structure and Infrastructure Engineering 13 (3): 361–389. doi:10.1080/15732479.2016.1162818.
- Dilip, Datta, José Rui Figueira, Carlos M. Fonseca, and Fernando Tavares-Pereira. 2008. “Graph Partitioning Through a Multi-Objective Evolutionary Algorithm: A Preliminary Study.” GECCO’08: Proceedings of the 10th Annual Conference on Genetic and Evolutionary Computation 2008, Atlanta, GA, USA, 625–632.
- Fengfeng, Li, Lin Ma, Yong Sun, and Joseph Mathew. 2015. “Optimized Group Replacement Scheduling for Water Pipeline Network.” Journal of Water Resources Planning and Management 142 (1): 04015035. doi:10.1061/(asce)wr.1943-5452.0000559.
- Francisque, Alex, Solomon Tesfamariam, Golam Kabir, Husnain Haider, Andrew Reeder, and Rehan Sadiq. (2016). “Water Mains Renewal Planning Framework for Small to Medium Sized Water Utilities: A Life Cycle Cost Analysis Approach.” Urban Water Journal 14 (5): 493–501. Taylor & Francis. doi:10.1080/1573062X.2016.1223321.
- Garfinkel, R. S., and G. L. Nemhauser. 1970. “Optimal Political Districting by Implicit Enumeration Techniques.” Management Science 16 (8): B-495-B–508. doi:10.1287/mnsc.16.8.b495.
- Gendreau, Michel, and Jean-Yves Potvin. 2019. “Handbook of Metaheuristics Third Edition.” International Series in Operations Research & Management Science 272: 37–55.
- Giustolisi, Orazio. 2020. “Water Distribution Network Reliability Assessment and Isolation Valve System.” Journal of Water Resources Planning and Management 146 (1): 1–11. doi:10.1061/(ASCE)WR.1943-5452.0001128.
- Giustolisi, Orazio, Francesco Gino Ciliberti, Luigi Berardi, and Daniele Biagio Laucelli. 2022. “A Novel Approach to Analyze the Isolation Valve System Based on the Complex Network Theory.” Water Resources Research 58 (4): 1–14. doi:10.1029/2021WR031304.
- Giustolisi, Orazio, and Dragan Savic. 2010. “Identification of Segments and Optimal Isolation Valve System Design in Water Distribution Networks.” Urban Water Journal 7 (1): 1–15. doi:10.1080/15730620903287530.
- Hess, S. W., J. B. Weaver, H. J. Siegfeldt, J. N. Whelan, and P. A. Zitlau. 1965. “Nonpartisan Political Redistricting by Computer.” Operations Research 13 (6): 998–1006. doi:10.1287/opre.13.6.998.
- Kalcsics, Jörg, and Roger Ríos-Mercado. 2015. “Location Science.” In Second Edi, pp. 705–743. Springer. doi:10.1007/978-3-319-13111-5_14.
- Klise, Katherine A., Michael Bynum, Dylan Moriarty, and Regan Murray. 2017. “A Software Framework for Assessing the Resilience of Drinking Water Systems to Disasters with an Example Earthquake Case Study.” Environmental Modelling and Software 95: 420–431. Elsevier Ltd. doi:10.1016/j.envsoft.2017.06.022.
- Liu, Haixing, Tom Walski, Fu Guangtao, and Chi Zhang. 2017. “Failure Impact Analysis of Isolation Valves in a Water Distribution Network.” Journal of Water Resources Planning and Management 143 (7): 1–10. doi:10.1061/(asce)wr.1943-5452.0000766.
- Marchionni, Valentina, Marta Cabral, Conceição Amado, and Dídia Covas. 2016. “Estimating Water Supply Infrastructure Cost Using Regression Techniques.” Journal of Water Resources Planning and Management 142 (4): 4. doi:10.1061/(asce)wr.1943-5452.0000627.
- Muñuzuri, Jesús, Cristóbal Ramos, Alejandro Vázquez, and Luis Onieva. 2020. “Use of Discrete Choice to Calibrate a Combined Distribution and Sewer Pipe Replacement Model.” Urban Water Journal 17 (2): 100–108. Taylor & Francis. doi:10.1080/1573062X.2020.1748205.
- Nafi, Amir, and Yehuda Kleiner. 2010. “Scheduling Renewal of Water Pipes While Considering Adjacency of Infrastructure Works and Economies of Scale.” Journal of Water Resources Planning and Management 136 (5): 519–530. doi:10.1061/(asce)wr.1943-5452.0000062.
- Phan, Hieu Chi, Ashutosh Sutra Dhar, Hu Guangji, and Rehan Sadiq. 2019. “Managing Water Main Breaks in Distribution Networks - a Risk-Based Decision Making.” Reliability Engineering & System Safety 191: 106581. Elsevier Ltd. doi:10.1016/j.ress.2019.106581.
- Ramos-Salgado, Cristóbal, Pablo Aparicio-Ruiz, and Luis Onieva. 2022. A Comprehensive Framework to Efficiently Plan Short and Long-Term Investments in Water Supply and Sewer Networks; p. 219. doi:10.1016/j.ress.2021.108248.
- Ramos-Salgado, Cristóbal, Jesús Muñuzuri, Pablo Aparicio-Ruiz, and Luis Onieva. 2021. “A Decision Support System to Design Water Supply and Sewer Pipes Replacement Intervention Programs.” Reliability Engineering & System Safety 216: 107967. doi:10.1016/j.ress.2021.107967.
- Ricca, Federica, Andrea Scozzari, and Bruno Simeone. 2013. “Political Districting: From Classical Models to Recent Approaches.” Annals of Operations Research 204 (1): 271–299. doi:10.1007/s10479-012-1267-2.
- Robles-Velasco, Alicia, Jesús Muñuzuri, Luis Onieva, and Pablo Cortés. 2021. “An Evolutionary Fuzzy System to Support the Replacement Policy in Water Supply Networks: The Ranking of Pipes According to Their Failure Risk.” Applied Soft Computing 111: 107731. Elsevier B.V. doi:10.1016/j.asoc.2021.107731.
- Rokstad, Marius Møller, and Rita Maria Ugarelli. 2015. “Minimising the Total Cost of Renewal and Risk of Water Infrastructure Assets by Grouping Renewal Interventions.” Reliability Engineering & System Safety 142: 148–160. Elsevier. doi:10.1016/j.ress.2015.05.014.
- Salehi, Sattar, Mohammadreza Jalili Ghazizadeh, and Massoud Tabesh. 2018. “A Comprehensive Criteria-Based Multi-Attribute Decision-Making Model for Rehabilitation of Water Distribution Systems.” Structure and Infrastructure Engineering 14 (6): 743–765. Taylor & Francis. doi:10.1080/15732479.2017.1359633.
- Salehi, Sattar, Mohammadreza Jalili Ghazizadeh, Massoud Tabesh, Somayeh Valadi, and Seyed Payam Salamati Nia. (2021). “A Risk Component-Based Model to Determine Pipes Renewal Strategies in Water Distribution Networks.” Structure and Infrastructure Engineering 17 (10): 1338–1359. Taylor & Francis. doi:10.1080/15732479.2020.1842466.
- Salehi, Sattar, Alicia Robles-Velasco, Ali Seyedzadeh, Aliakbar Ghazali, and M. Davoudiseresht. 2022. “A Hybrid Knowledge-Based Method for Pipe Renewal Planning in Water Distribution Systems with Limited Data: Application to Iran.” Utilities Policy 78 (March): 101407. Elsevier Ltd. doi:10.1016/j.jup.2022.101407.
- Scheidegger, A., J P. Leitão, and Lisa Scholten. 2015. “Statistical Failure Models for Water Distribution Pipes – a Review from a Unified Perspective.” Water Research 83: 237–247. doi:10.1016/j.watres.2015.06.027.
- Scholten, Lisa, Andreas Scheidegger, Peter Reichert, Max Mauer, and Judit Lienert. 2014. “Strategic Rehabilitation Planning of Piped Water Networks Using Multi-Criteria Decision Analysis.” Water Research 49: 124–143. Elsevier Ltd. doi:10.1016/j.watres.2013.11.017.
- Shahata, Khaled, and Tarek Zayed. 2016. “Integrated Risk-Assessment Framework for Municipal Infrastructure.” Journal of Construction Engineering and Management 142 (1): 04015052. doi:10.1061/(asce)co.1943-7862.0001028.
- Tavares-Pereira, Fernando, José Rui Figueira, Vincent Mousseau, and Bernard Roy. 2007. “Multiple Criteria Districting Problems: The Public Transportation Network Pricing System of the Paris Region.” Annals of Operations Research 154 (1): 69–92. doi:10.1007/s10479-007-0181-5.
- Treinish, Matthew, Ivan Carvalho, Georgios Tsilimigkounakis, and Nahum Sá. 2021. “Rustworkx: A High-Performance Graph Library for Python.” Journal of Open Source Software 7 (79): 1–5. Open Journals. doi:10.21105/joss.03968.
- Tscheikner-Gratl, Franz, Robert Sitzenfrei, Wolfgang Rauch, and Manfred Kleidorfer. 2015. “Integrated Rehabilitation Planning of Urban Infrastructure Systems Using a Street Section Priority Model.” Urban Water Journal 13 (1): 28–40. doi:10.1080/1573062X.2015.1057174.
- Tscheikner-Gratl, Franz, Robert Sitzenfrei, Wolfgang Rauch, and Manfred Kleidorfer. 2016. “Enhancement of Limited Water Supply Network Data for Deterioration Modelling and Determination of Rehabilitation Rate.” Structure and Infrastructure Engineering 12 (3): 366–380. doi:10.1080/15732479.2015.1017730.
- Walski, Thomas M. 1993. “Water Distribution Valve Topology for Reliability Analysis.” Reliability Engineering & System Safety 42 (1): 21–27. doi:10.1016/0951-8320(93)90051-Y.
- Wang, Zifeng, and Li. Suzhen. 2020. “Data-Driven Risk Assessment on Urban Pipeline Network Based on a Cluster Model.” Reliability Engineering & System Safety 196: 106781. October. 2019 Elsevier Ltd. doi:10.1016/j.ress.2019.106781.
- Wéber, Richárd, Tamás Huzsvár, and Csaba Hős. 2020. “Vulnerability Analysis of Water Distribution Networks to Accidental Pipe Burst.” Water Research 184: 184. doi:10.1016/j.watres.2020.116178.
- Winkler, Daniel, Markus Haltmeier, Manfred Kleidorfer, Wolfgang Rauch, and Franz Tscheikner-Gratl. 2018. “Pipe Failure Modelling for Water Distribution Networks Using Boosted Decision Trees.” Structure and Infrastructure Engineering 14 (10): 1402–1411. Taylor & Francis. doi:10.1080/15732479.2018.1443145.