
 ?Mathematical formulae have been encoded as MathML and are displayed in this HTML version using MathJax in order to improve their display. Uncheck the box to turn MathJax off. This feature requires Javascript. Click on a formula to zoom.
ABSTRACT
Predicting the structural condition of sewer pipes plays a vital role in the predictive maintenance of sewer pipes and renewal plans of many water utilities. This study explores the simultaneous utilization of physical and environmental features of sewer pipes in sewer structural condition prediction. Three (3) hybrid machine learning models which are the combination of Bagging (BG), Dagging (DG), and Rotation Forest (RotF) ensembles with a J48 Decision Tree (J48DT) based classifier were used to predict sewer pipe conditions in Ålesund city, Norway. The classification performance of the machine learning models was evaluated using the area under the receiver operating characteristic (AUC-ROC) and the area under the precision-recall (AUC-PRC) curves. The RotF-J48DT model had the highest (AUC-ROC = 0.857, AUC-PRC = 0.918) values, followed by the BG-J48DT, and the base classifier J48DT. The RotF-J48DT hybrid model should be considered when predicting the condition of sewer pipes in the study area.
1. Introduction
A sewer system is an indispensable part of urban cities and plays a vital role in the collection and transport of wastewater and stormwater from residential and industrial areas to treatment plants. Sewer pipelines undergo different stresses during their lifespan, which contribute to their rapid deterioration with dire consequences for public health, property, and the environment (Sempewo and Kyokaali Citation2019). Wastewater usually contains chemical and microbial hazards that can escape through cracks in sewer pipelines and contaminate surrounding soil and groundwater (Farkas et al. Citation2020).
Failures in sewer systems have been reported in Europe. For example, the collapse of sewer pipes due to aging was reported in Paris and Bordeaux (Diab Citation2000). According to Kuliczkowska, Kuliczkowski, and Parka (Citation2022), pipe failure is the main cause of street pavement collapse in residential areas. Venkatesh and Brattebø (Citation2012) found the condition of wastewater pipelines in Oslo, Norway, to be poor due to deterioration, and were not able to perform their engineered functions effectively. Although there have been recent investments in sewer networks in Norway, some of these networks remain in poor condition with an annual renewal rate of 0.6% (RIF Citation2021). Many municipalities have therefore been looking for ways to intensify their renewal programs through the use of condition assessment methods, visual inspection techniques, and deterioration models (Fugledalen, Møller Rokstad, and Tscheikner-Gratl Citation2021).
The predictive ability of the structural condition and deterioration models significantly depends on the input variables. Based on the literature, the factors affecting the structural condition of sewer pipes are generally divided into physical, environmental, and operational factors (Mohammadi, Najafi, Vinayak, et al. Citation2019; Mohammadreza Malek Mohammadi et al. Citation2020). Age, diameter, material, depth, length, and slope are the most important physical factors (Hawari et al. Citation2020). The frequently used environmental factors are soil type, location, groundwater, and traffic volume (Laakso et al. Citation2018; Mohammadi, Najafi, Vinayak, et al. Citation2019; Mohammadreza Malek Mohammadi et al. Citation2020). Operational factors include preparation, cleaning, flow rate, infiltration and inflow, and pressure (Balekelayi and Tesfamariam Citation2019; Hawari et al. Citation2018). A recent review by Hawari et al. (Citation2020) indicated that very few studies account for some environmental factors and operational factors as inputs of condition assessment models. Deterioration is a complex process and is a result of the interaction between several factors (Huu Dung Tran, Citation2007; Mohammadreza Malek Mohammadi et al. Citation2020). Therefore, considering more factors will provide more useful information in addressing sewer deterioration. One major challenge with this approach is the high redundancy and multicollinearity of features (input variables).
Reliable deterioration models enhance our understanding of the deterioration process and mechanism. This is critical for the evaluation of non-inspected pipe conditions and the forecast of their future state for rehabilitation strategies (Nicolas Caradot et al. Citation2017). This tool can help wastewater utilities to evaluate the non-inspected pipes’ conditions and forecast the future state of the sewer pipes. Hawari et al. (Citation2020) showed that exploring the relationship between the factors affecting the deterioration process is fundamental in building a good deterioration model for sewer condition prediction. Generally, deterioration models for sewer condition classification can be grouped into three (3) major categories namely physical, statistical, and machine learning methods (Mohammadi, Najafi, Vinayak, et al. Citation2019).
The physical models (or deterministic models) utilize only the physical properties and mechanics of sewer pipes to determine the extent of deterioration (Hawari et al. Citation2020; Tscheikner-Gratl et al. Citation2019). Several physical deterioration models have been reported in the literature. These include power function models (M. I. C. H. E. A. L. L. Doleac, Lackey, and Bratton Citation1980) and linear function models (Randall-Smith, Oliphant, and Russell Citation1992) to determine corrosion pit depth, UtilNets for reliability-based life prediction of buried grey cast iron in water mains (Hadzilacos et al. Citation2000), and ExtCorr for external corrosion estimation (Hawari et al. Citation2020). Hawari et al. (Citation2020) argued that physical models are best suited for determining specific processes such as corrosion but are too simple to reflect a complex process such as deterioration. Additionally, suitable data types for physical modeling of deterioration are scarce and difficult to curate (E. V. Ana and Bauwens Citation2010). Some studies have proposed statistical models as an economic alternative to the physical models (Rajani and Kleiner Citation2001; Tscheikner-Gratl et al. Citation2019) to overcome some of the drawbacks.
Statistical models describe historical failure data’s probabilistic nature as a random variable and estimate the best output (state) based on the condition of given data (Mohammadi, Najafi, Vinayak, et al. Citation2019). These statistical models include regression models (Bakry et al. Citation2016; Ngandu, Tesfamariam, and Asce Citation2019; Kabir et al. Citation2018; Mohammadrza Malek Mohammadi et al. Citation2019; Sempewo and Kyokaali Citation2019), Markov chains (Sempewo and Kyokaali Citation2019), cohort survival models (Nicolas Caradot et al. Citation2017), discriminant analysis (Vladeanu, Matthews, and Asce Citation2019; Alsaqqar, Hussein Khudair, and Karim Jbbar Citation2017), probabilistic models (Kleiner and Rajani Citation2001), and integrated methods (Kabir et al. Citation2018; Altarabsheh, Ventresca, and Kandil Citation2018; Hawari et al. Citation2016). Regression models are flexible and simple models for predicting the condition of sewer pipes that enhance interpretability vs explainability, however, the accuracy of these models can sometimes be low. Markov chains on the other hand create complex and chronological models with appreciable accuracy but determining the transitional probability matrix has always been a difficult challenge (Hawari et al. Citation2020). Additionally, the underlying assumption of normality is difficult to validate (Huu Dung Tran, Citation2007; Mohammadi, Najafi, Vinayak, et al. Citation2019). Machine learning (ML) models have been proposed as distribution-free alternatives to statistical models. These models include random forest (N. Caradot et al. Citation2018; Laakso et al. Citation2018; Vitorino et al. Citation2014), support vector machine (SVM) (Harvey and Arthur McBean Citation2014; H. D. Tran and Ng Citation2010), decision tree (Harvey and Arthur McBean Citation2014; Syachrani et al. Citation2013), or artificial neural network (El-Abbasy et al. Citation2014; H. D. Tran, Perera, and Ng Citation2009). These models explore the complex non-linear relationship between inputs and outputs (Hawari et al. Citation2020; Tsai, Miao-Ling, and Lin Citation2018).
Several previous studies have applied ML algorithms to study the sewer deterioration process. For example, Multinomial Logistic Regression and Artificial Neural Network models were developed to predict sanitary sewer pipes condition in a study by Atambo, Najafi, and Kaushal (Citation2022), or Yin et al. (Citation2020) used linear regression and a neural network to construct neighborhood-level and individual-level prediction models, respectively. However, a common point of these studies is that they only used single ML algorithms to construct sewer deterioration models, and hybrid ML models were not considered. Moreover, Tizmaghz, van Zyl, and Henning (Citation2022) showed that each classification system exist weaknesses and no algorithm is perfect for all cases. Hence, finding a suitable sewer deterioration assessment model should be considered.
Many studies have shown that hybrid machine learning and metaheuristic algorithms are better than single ML methods because they enhance the capability of individual weak base algorithms to develop higher accuracy prediction models (Shirzadi et al. Citation2018, Citation2019). For instance, hybrid ensemble models outperformed a base classifier in the mapping of the groundwater potential zones or environmental hazards (Phong et al. Citation2021; Shahabi et al. Citation2020). The application of these kinds of hybrid ensemble ML models in the water field is still limited and seldom utilized, especially in predicting the structural condition of the sewage system.
The main objective of this study is to develop hybrid ensemble models for predicting the structural condition of sewer pipes using the physical and environmental factors affecting the deterioration process in Ålesund city, Norway. The hybrid ML model with higher performance (compared to the original ML model) can effectively support local water engineers, water managers, and relevant agencies in optimizing predictive maintenance strategies. Moreover, feature selection analysis in this study defines the most significant factors affecting sewer deterioration that provide useful information for local water agencies to prioritize their maintenance strategies. This study explores several hybrid ML models for predicting the condition of sewer pipelines. Specifically, the J48 Decision Tree (J48DT) algorithm is utilized as a base classifier and then combined with ensemble techniques namely Bagging (BG), Dagging (DG), and Rotation Forest (RotF) to develop hybrid ML models, namely BG-J48DT, DG-J48DT, and RotF-J48DT, for predicting the structural condition of sewer pipe in Ålesund city, Norway. Appropriate and suitable models for structural condition assessment will go a long way to help authorities and municipalities optimize maintenance strategies, reduce expenses, and strengthen the performance of the sewer network.
2. Materials and methods
2.1. Study area
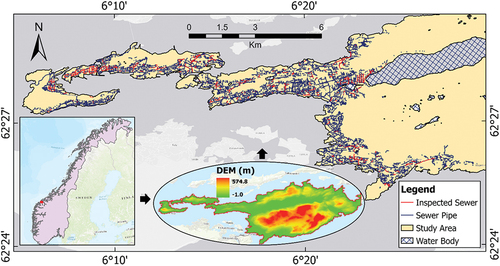
The data used for this study were collected from the sewer network in Ålesund city, Norway. This city is located between longitudes 6°05’E and 6°42’E and latitudes 62°25’N and 62°32’E with an area of 633.6 km2. The geographic location of the sewer network in Ålesund city is shown in .
Figure 1. The sewer network in the study area.
2.2. Data used
The sewer network consists of about 33,090 pipes with a total length of 760.4 km comprising concrete and polyvinyl chloride (PVC) as the main pipe materials. The condition of pipes was monitored by using the Closed-Circuit Television (CCTV) approach and damaged scores were assigned for sewer pipes to reflect their status (Nicolas Caradot et al. Citation2020; Bairaktaris et al. Citation2007). The status of sewer pipes was classified into five damaged classes based on the damage score obtained from the CCTV as shown in (Haugen and Viak Citation2018). These damage classes were further grouped into three (3) aggregated classes namely good condition (class 1 or class 2), intermediate condition (class 3), and bad condition (class 4 or class 5). Previous studies have utilized these aggerated classes in sewer condition assessment since it facilitates comprehension of sewer condition states (Nicolas Caradot et al. Citation2020; Mohammadi, Najafi, Tabesh, et al.).
Table 1. The condition classes of pipe.
Sewer pipes without full properties in terms of physical or environmental values were eliminated from the database, this data was then compared to inspected data to select sewer pipes for training and validating models. As a result, a total of 1,335 inspected pipes were used in this study (). These data were curated via the CCTV method from 2012 to 2020. The physical attributes of the pipes of the selected pipes include age, diameter, depth, length, slope, pipe type, network type, pipe form, connection type, and material as shown in . The environmental factors considered for modeling the sewer pipe conditional process were calculated from auxiliary geospatial data. Detailed information is provided in . These data were converted to pixels of 5 m × 5 m to prepare data for analyzing process. The map of rainfall is interpolated from monthly average precipitation from 9 weather stations within the Ålesund municipality using the inverse distance weighting method in ArcGIS Pro software.
Figure 2. The maps of (a) Training and testing samples; (b) Condition class distribution.
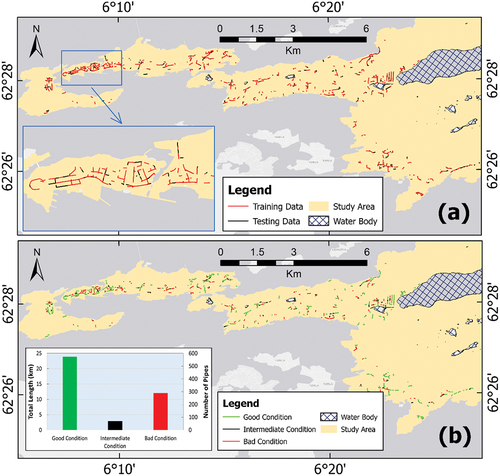
Figure 3. The maps of environment-related factors.
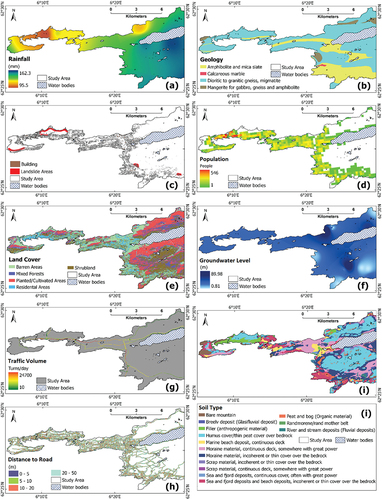
Table 2. Input factors for building structural condition model for sewer pipe.
2.3. Condition assessment
2.3.1. Boruta feature selection method
Condition assessment models of sewer pipes use multiple factors/features as independent variables. The current and future condition of any sewer pipe is a function of physical, environmental, and operational factors. Therefore, choosing significant factors before modeling is essential in reducing multicollinearity and redundancy amongst features. Many feature selection techniques have been proposed in the literature to assess the importance of independent variables. These feature selection methods include filter, wrapper, and embedded methods (Chandrashekar and Sahin Citation2014).
The Boruta algorithm, which is a wrapper method built around the Random Forest model, is a good candidate for dealing with both regression and classification problems (Kursa and Rudnicki Citation2010). Many studies used the Boruta for feature selection and showed that this algorithm is an effective method to reduce the dimensionality of the data set (Nanda et al. Citation2021; Bhavan and Aggarwal Citation2018). This algorithm distinguishes relevant variables or features into important, tentative, and unimportant categories based on a comparison of input variables’ importance with output performance using a randomly permuted method. The main idea of the Boruta algorithm is to randomly create a copy of data, then classify the combination of copied versions with the original data. Then an iterative procedure is applied until every feature is classified as either important (accepted) or unimportant (rejected). The key steps for implementing the Boruta method are represented in .
Figure 4. Framework for implementing the Boruta feature selection method.
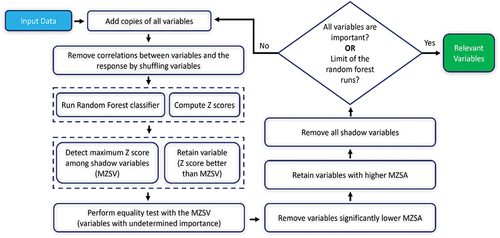
For a detailed description of the Boruta algorithm, readers are referred to (Kursa and Rudnicki Citation2010; Nanda et al. Citation2021). The Boruta method ranks the importance of each feature thereby eliminating unimportant factors and reducing multicollinearity before developing the sewer condition model.
2.3.2. Hybrid ensemble models
2.3.2.1. J48 decision tree classifier base model
A decision tree is a classification model that comprises a root, decision nodes, leaf nodes, and branches (Bui et al. Citation2014). In a decision tree structure, one of the attributes represents a decision node and the class value is represented by a leaf node (Sahu and Mehtre Citation2015). The minimum number of instances per leaf and the confidence factor are two important user-defined parameters for building a decision tree classifier. A typical decision tree classifier is constructed in two steps: building and pruning. In the building step, the parameters influencing the classification accuracy of the decision tree are determined. In the pruning step, Laplace smoothing is used for probabilistic estimates of the leaves (Bui et al. Citation2014). Depending on the accuracy and efficiency desired, different algorithms can be used to generate decision trees. These dominant algorithms include Best First Tree (BFTree), Classification and Regression Trees (CART), Alternating Decision Tree (AD Tree), ID3, J48, and C4.5. A study by Lim, Loh, and Shih (Citation2000) showed that the C4.5 family of algorithms represents the fastest algorithm for building decision trees with good accuracy. The J48 algorithm, which is slightly modified C4.5 in WEKA, is used in this study for building the decision tree base model. The steps for implementing the J48 Decision Tree (J48DT) are presented in .
Figure 5. J48 Decision Tree overview.
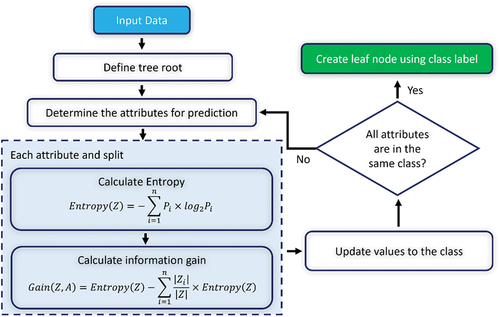
In , denotes the entropy of each attribute, and
denotes the information gain of each split (Hilal et al. Citation2021);
and
are represented the dataset and attributes, respectively;
and
are the number of partitions of A and the number of classes respectively;
and
represent the number of cases on partition
and the proportion of
to
, respectively.
2.3.2.2. Bagging ensemble
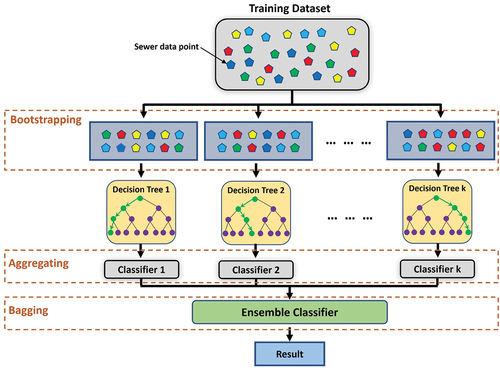
Bagging (Bootstrap Aggregating) was proposed by Breiman (Citation1996) to raise the stability of models significantly classification problems by improving accuracy and reducing variance. There are three main steps implemented in this model:
Creating multiple datasets: new sewer pipe points are created by randomly selecting samples with replacement (e.g. the individual sewer data points can be chosen more than one time) from the original training dataset.
Building multiple J48DT classifiers: the J48DT algorithm is used to independently train using random subsets from the previous step. Each J48DT will predict sewer condition status from the subset.
Combining classifier: the sewer condition status predictions of all the individual J48DT classifiers are combined to give a better classifier, usually with less variance compared to before. Finally, the final sewer condition status is defined using a plurality vote of those predictions from the J48DT models.
The concept of the bagging ensemble method is shown in .
Figure 6. The framework of the Bagging ensemble method.
2.3.2.3. Dagging ensemble
Ting and Witten (Citation1997) proposed Dagging (Disjoint Aggregating) method to create random training subsets from the original training dataset using the disjoint sampling method (instead of the bootstrap sampling) without replacement.
The main steps for implementing the dagging ensemble are described as follows:
New sewer pipe points are randomly created from the original training dataset without replacement (e.g. the individual sewer data points can be chosen only one time).
Prediction of sewer status condition from each subset is obtained using the J48DT classifier.
The plurality vote is used to aggregate results from the individual predictions obtained from each J48DT classifier, and the final sewer condition status is defined for each sewer data point.
2.3.2.4. Rotation forest ensemble
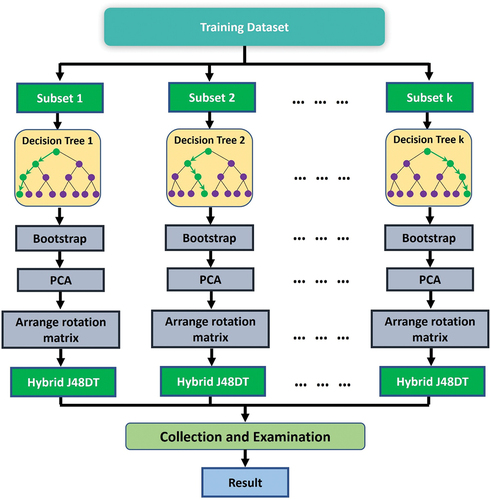
Rotation Forest (RotF) was firstly introduced by Rodriguez, Kuncheva, and Alonso (Citation2006) based on the idea of a random forest algorithm to improve the diversity and accuracy of the base classifier. In this method, the base classifiers (decision trees) are independently built and trained using the whole training dataset in a rotated feature space. Hyperplanes parallel to the feature axes are used to create classification regions while training decision trees and the final sewer condition status is computed based on the largest confidence for each status (Kuncheva and Rodríguez Citation2007).
Assume is a vector that contains
factors of sewer pipes,
represents sewer condition status vector where
is the sewer condition (i.e. good condition, intermediate condition, and bad condition) of the
sewer pipe and
is the number of inspected sewer pipes in the training dataset. Let
and
be the number of subsets and feature set of classifiers
in the ensemble (
is the number of classifiers in the ensemble), respectively, and
is the objects in the training dataset. Rodriguez, Kuncheva, and Alonso (Citation2006) introduced steps for constructing the training dataset for classifier
as follows:
For each classifier in the ensemble, randomly split the feature set
into
For each subset
Arrange the obtained vector with coefficients in a spare ‘rotation’ matrix
Rearrange the columns to match the order of features in F for constructing a rotation matrix
Calculate the confidence of each class from the input
The process for the RotF method is shown in .
Figure 7. The framework of the rotation forest method.
2.4. Model performance assessment
The performance of a classification model is usually evaluated using different metrics such as accuracy, sensitivity, specificity, F1-score, Matthew’s Correlation Coefficient (MCC), Geometric Mean (GM), or graphical assessment methods e.g. receiver operating characteristics and/or precision-recall curves. The above-mentioned metrics are derived from a confusion matrix (Tharwat Citation2021). This matrix is the basic component for calculating model performance assessment metrics in binary classification problems and multi-class classification problems.
2.4.1. Confusion matrix
The confusion matrix is an matrix whose elements
correspond to the number of classes in grade
that are predicted to be in grade
is the number of classes. shows the confusion matrix for a multi-class classification problem with 3 classes. Elements on the diagonal of the confusion matrix represent the number of samples that are correctly classified. Off-diagonal elements are the number of a sample that are incorrectly predicted.
Table 3. The confusion matrix for 3-class classification.
Based on the confusion matrix, various model performance metrics including false negative (FN), false positive (FP), true positive (TP), and true negative (TN) can be computed as follows (Tharwat Citation2021):
Accuracy (
F1-score: This metric represents the harmonic mean of precision and recall, the value of 1 represents the highest classification performance and the value of 0 is the worst.
Geometric Mean (GM): This metric is the root of the product of class-wise sensitivity. For multi-class problems, this metric is a higher root of the product of the sensitivity of each class. It is most often used for evaluating the performance of classification with imbalanced data. The equation for calculating GM is described as follows:
Matthew’s Correlation Coefficient (MCC): This metric represents the correlation between the predicted and actual classifications. The coefficient of + 1 and −1 represents perfect and bad predictions, respectively. The value of zero represents a random prediction. The below equation describes the MCC formula for multiclassification:
2.4.2. Receiver operating characteristic
The Receiver Operating Characteristic (ROC) curve represents the relationship between sensitivity and specificity (Tharwat Citation2021). Each point in the ROC curve is generated by changing the threshold on the confidence score. The AUC-ROC is a threshold-independent metric that calculates the area under the ROC curve. The AUC-ROC score is in the range of zero to one and the ROC curve that has a larger AUC-ROC value will have better classification performance with the same class. shows the success rate based on the AUC-ROC (Kritikos and Davies Citation2015).
Table 4. The model performance is based on the AROC values (Kritikos and Davies, Citation2015.).
2.4.3. Precision-recall curve
The Precision-Recall curve (PRC) represents the relationship between recall and precision. The PRC has been considered an alternative to the Receiver Operating Characteristics (ROC) curve for classification problems that have a large skew in the class distribution (Davis and Goadrich Citation2006). The AUC-PRC is a threshold-independent metric that calculates the area under the PRC curve.
2.5. Structural condition modeling framework
The data processing procedure for assessing sewer pipe status can be divided into several steps: 1) Collecting and pre-processing data, 2) Splitting data into training and testing data sets, 3) Building hybrid ML models, and 4) Validating and selecting structural conditions models. The flowchart for this procedure is shown in .
Figure 8. The framework for modeling the structural condition of sewer pipes.
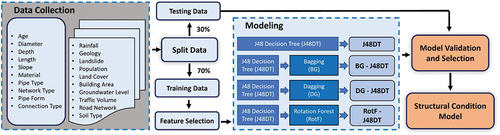
To build and validate the structural condition models, the data was split into training, cross-validation, and testing datasets. The ratio for splitting training and testing datasets depends on the quantum of data available and the objectives of the study. In this study, we randomly split the dataset with a ratio of 70% for the training dataset and cross-validation (934 samples) and 30% for the testing dataset (401 samples) respectively. In the training and cross-validation dataset, the number of sewer pipes in good condition, intermediate condition, and bad condition are 574, 70, and 290 samples, respectively. The test dataset consists of 248 samples in good condition, 33 samples in intermediate condition, and 120 samples in bad condition.
A base classifier was created based on every sample dataset and several classifiers were obtained based on the training dataset. Finally, the outputs of individual classifiers are amalgamated via the voting process. The hybrid models use the J48 algorithm as the base classifier. In an attempt to avoid the subjective character of the hybrid models, the user-defined parameters () and
of the base classifier were not varied when applying ensembles. The optimal values for the user-defined parameters (
) and
were found using a grid search with 10-fold cross-validation. The best values for
and
are found as 2.0 and 0.25, respectively.
3. Results and discussions
3.1. Feature selection using the Boruta method
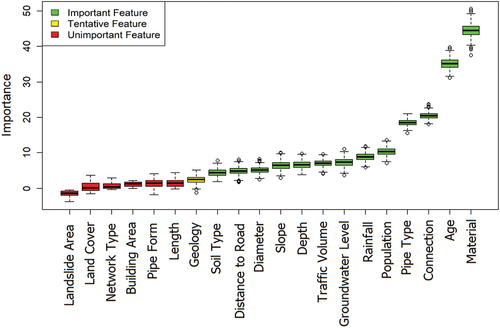
The importance of the features (variables) utilized in this study for sewer structural condition prediction is presented in . The result showed that the material was adjudged as the most important factor affecting the structural deterioration process, followed by the age of the pipe. Six variables (landslide area, land cover, network type, building area, pipe form, and length) were unimportant for deterioration modeling and these factors were eliminated from the model. One tentative factor (geology) and the remaining factors were used to develop the structural condition models for the study area.
Figure 9. Feature selection for building conditional assessment model.
Yin et al. (Citation2020) only used backward direction feature selection to eliminate insignificant factors and indicated that more advanced selection methods should be considered in the future to find significant factors. The significant values (p-value) from the logistic regression model were used to rank the important degree of factors in the study of Atambo, Najafi, and Kaushal (Citation2022), this approach may be not an ideal solution in case an unbalanced dataset (Sanchez-Pinto et al. Citation2018). This study partly fills the above limitation by using the advanced wrapper method for defining the importance of input factors and eliminating insignificant factors before constructing ML models.
In this study, the Boruta feature selection method highlighted the material and age of the sewer pipelines as significant factors for modeling the structural condition of the pipes. This conclusion agrees with various studies in the literature (Mohammadi, Najafi, Tabesh, et al. ; Salman and Salem Citation2012; Baur and Herz Citation2002). For example, Mohammadi, Najafi, Tabesh, et al. () showed that pipe age was the most important factor, followed by the material and diameter of the pipe when building the condition prediction model of sanitary sewer pipe by applying the logistic regression model. The importance and absolute ranking of factors depend to some extent on the method utilized and local conditions. For example, Najafi and Kulandaivel (Citation2005) concluded the diameter of the sewer was the most important based on an ANN model; whereas, pipe material was pointed as the most important factor based on the Back Propagation Neural Network and Probabilistic Neural Network models (Khan, Zayed, and Moselhi Citation2010). The age of sewer pipes was proved as the most important based on the binary logistic regression model in the study by Mohammadi, Najafi, Tabesh, et al. ().
In Ålesund city, sewer material significantly affects deterioration behaviors. Many sewer pipes in the study area are polyvinyl chloride (PVC) and concrete (BET), and these materials have a strong correlation with the conditioning process. For instance, PVC pipes are highly resistant to acidic and alkaline wastes and BET pipes work well with abrasion (Mohammadreza Malek Mohammadi et al. Citation2020). Additionally, installation and operation procedures ensure BET pipes are less affected by deterioration. More specifically, because of installation in controlled situations, BET pipes normally keep high quality and have good integrity. Moreover, reinforced steel in BET pipes makes them strong enough against structural deterioration and PVC pipes suffer excessively from traffic loads (Mohammadreza Malek Mohammadi et al. Citation2020), this mechanism is insignificant in this study as most pipes were not impacted by roads with high traffic volumes ().
The study shows the age of the pipe is an important factor in the deterioration process (). This finding has been made in previous studies (Mohammadi, Najafi, Tabesh, et al. ; Khan, Zayed, and Moselhi Citation2010). The effect of aging on the condition of the sewer pipe begins immediately after the pipe is installed and it normally takes 44–65 years for pipes to change to poor condition (Laakso et al. Citation2018).
Although landslide directly affects the underground assets in general and the sewer network, it is not significant in this study. This can be explained by the landslide areas being small and the number of inspected sewer pipes in these areas not being significant (). In the same vein, the building area has been assessed to be a less important factor affecting the structural condition of sewer pipes in this study. This can be explained by the fact that most of the inspected pipes in the central area of Ålesund city were in good condition () although found in locations of high building density ().
The length of the sewer pipes is considered an unimportant factor for this study area, this conclusion is in line with the result of Lubini and Fuamba (Citation2011), in which the authors found the slope and length were not significant in their deterioration model.
3.2. Comparison of structural condition models
The predictive capability of the models for the structural condition of sewer pipes is assessed using the test dataset. The results of the statistical measures of the J48DT, BG-J48DT, DG-J48DT, and RotF-J48DT are represented in . Because there is a difference between the number of samples in the three output classes (class imbalance), accuracy may not be a reliable metric for assessing the overall classification performance (Haixiang et al. Citation2017). Therefore, some statistical measures such as GM, MCC, F1-score, AUC-ROC, and AUC-PRC have been used as alternative performance assessment metrics.
Table 5. Statistical measures of developed hybrid models in this analysis.
The results indicate that the statistical measures including GM, MCC, and F-measure have the highest values for good condition, which is a major class in the dataset, followed by the bad condition class. It can be seen that the MCC value of the DG-J48DT models is immeasurable when predicting samples in an intermediate condition indicating the bad performance for this class.
shows the AUC-ROC and AUC-PRC of four developed structural condition models in this study. Based on the definition of AUC values in , the developed ML models have good performance in predicting the structural condition of the sewer pipe in good and bad condition classes, but they have satisfactory performance in predicting samples in the intermediate condition class.
Figure 10. The AUC values of the developed models: (a) AUC-ROC, (b) AUC-PRC.
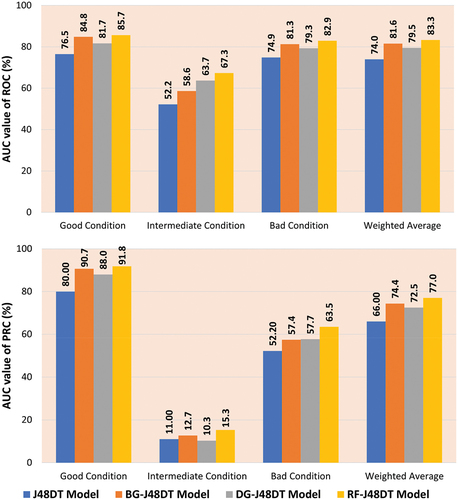
The results show that all three developed hybrid models improve classification performance compared to the base classifier (the J48DT model). More specifically, for the good condition class, the RotF-J48DT model have the highest classification performance (AUC-ROC = 0.857, AUC-PRC = 0.918), followed by BG-J48DT (AUC-ROC = 0.848, AUC-PRC = 0.907), DG-J48DT (AUC-ROC = 0.817, AUC-PRC = 0.880), and J48DT (AUC-ROC = 0.800, AUC-PRC = 0.765). Similarly, for the bad condition class prediction, the RotF-J48DT (AUC-ROC = 0.829, AUC-PRC = 0.635) is outperformed the BG-J48DT (AUC-ROC = 0.813, AUC-PRC = 0.574), DG-J48DT (AUC-ROC = 0.793, AUC-PRC = 0.577), and J48DT (AUC-ROC = 0.749, AUC-PRC = 0.522) models. All developed models have the lowest classification performance in predicting samples in the minor class (intermediate condition). However, the RotF-J48DT model (AUC-ROC = 0.673, AUC-PRC = 0.153) is better than the DG-J48DT (AUC-ROC = 0.637, AUC-PRC = 0.103), BG-J48DT (AUC-ROC = 0.586, AUC-PRC = 0.127), and J48DT (AUC-ROC = 0.522, AUC-PRC = 0.110) models. Additionally, in terms of weighted average values, the RotF-J48DT has higher values than other models indicating better classification performance. In conclusion, these ensemble models have better predictive power than the basic model. The RotF-J48DT ensemble model produces the best result for predicting the structural condition of sewer pipes in the study area.
Based on the area under the curve values, the hybrid models have higher performance compared to the base classifier. This conclusion is consistent with previous findings. For example, Miraki et al. (Citation2019) showed that the novel classifier ensemble model, namely the Random Forest Classifier based on Random Subspace Ensemble, had a higher predictive capability for groundwater potential mapping compared to other benchmark models. Additionally, the findings of Chen et al. (Citation2019) indicated that two ensemble frameworks, namely Random subspace, and Bagging, produce a higher predictive performance than the base classifier, namely Reduced-error pruning trees. A similar conclusion was illustrated in the study by Phong et al. (Citation2021) which shows the RealAdaBoost, Bagging, and Rotation Forest ensembles outperformed the functional tree base classifier.
Finally, the structural condition models developed in this study had a lower capability in predicting samples in the intermediate condition class (). This can be explained that this is the minor class in the dataset (about 7.7% in the total of 957 training samples). Several studies have transformed the multi-classification problems into binary classification problems by clustering samples in classes 1–3 into one class (good condition) and the remaining samples into another class (bad condition) to improve classification performance (Mohammadi, Najafi, Tabesh, et al. ; E. Ana et al. Citation2009). In our study, we try to keep the basic characteristic of classes by converting five-grade scales into three-grade scales. This still allows water managers to correctly assess the importance of each class (pipes in class 1 and class 2 are good conditions, and pipes in class 4 and class 5 are bad conditions) and improves the classification performance of the structural condition models.
4. Conclusions
In this study, three ML hybrid models namely BG-J48DT, DG-J48DT, and RotF-J48DT based on the J48DT base classifier were investigated to predict the structural condition of sewer pipes in Ålesund city, Norway. The importance of input factors for modeling was assessed by applying the Boruta feature selection technique.
The results show that the material of sewer pipes is the most important factor affecting the structural condition of sewer pipes in the study area, followed by the age of the pipes. The landslide area, land cover, network type, building area, pipe form, and length of sewer pipe have the least influence on the structural condition in the study area.
Many model performance assessment measures including GM, MCC, F-Measure, AUC-ROC and AUC-PRC curves were used to evaluate the classification performance of the developed models. The three ensemble models have shown better prediction capability compared to the J48DT base classifier. The RotF-J48DT ensemble model is better at predicting all three condition classes comparing the remaining other ML models.
Although the ensemble models perform more effectively than the base classifier in predicting the structural condition of sewer pipes, the accuracy of these models is still limited (about 70%). Therefore, other ML models need to be investigated to improve classification performance and accuracy.
Acknowledgements
The authors would like to thank Ålesund Municipality for providing the data for this research. This research was funded by the Smart Water Project (No.: 90392200), financed by Ålesund Municipality and the Norwegian University of Science and Technology (NTNU).
Disclosure statement
No potential conflict of interest was reported by the author(s).
Additional information
Funding
References
- Alsaqqar, Awatif Soaded, Basim Hussein Khudair, and Rehab Karim Jbbar. 2017. “Rigid Trunk Sewer Deterioration Prediction Models Using Multiple Discriminant and Neural Network Models in Baghdad City, Iraq.” Journal of Engineering 23 (8): 70–83. https://doi.org/10.31026/j.eng.2017.08.06.
- Altarabsheh, Ahmad, Mario Ventresca, and Amr Kandil. 2018. “New Approach for Critical Pipe Prioritization in Wastewater Asset Management Planning.” Journal of Computing in Civil Engineering 32 (5): 04018044–. https://doi.org/10.1061/(ASCE)CP.1943-5487.0000784.
- Ana, E. V., and W. Bauwens. 2010. “Modeling the Structural Deterioration of Urban Drainage Pipes: The State-Of-The-Art in Statistical Methods.” Urban Water Journal 7 (1): 47–59. https://doi.org/10.1080/15730620903447597.
- Ana, E., W. Bauwens, M. Pessemier, C. Thoeye, S. Smolders, I. Boonen, and G. De Gueldre. 2009. “An Investigation of the Factors Influencing Sewer Structural Deterioration.” Urban Water Journal 6 (4): 303–312. https://doi.org/10.1080/15730620902810902.
- Atambo, Daniel Ogaro, Mohammad Najafi, and Vinayak Kaushal. 2022. “Development and Comparison of Prediction Models for Sanitary Sewer Pipes Condition Assessment Using Multinomial Logistic Regression and Artificial Neural Network.” Sustainability 14 (9): 5549. https://doi.org/10.3390/su14095549.
- Bairaktaris, D., V. Delis, C. Emmanouilidis, S. Frondistou-Yannas, K. Gratsias, V. Kallidromitis, and N. Rerras. 2007. “Decision-Support System for the Rehabilitation of Deteriorating Sewers.” Journal of Performance of Constructed Facilities 21 (3): 240–248. https://doi.org/10.1061/(ASCE)0887-3828(2007)21:3(240).
- Bakry, Ibrahim, Hani Alzraiee, Khalid Kaddoura, El Masry Mohamed, Tarek Zayed, and M. Asce. 2016. “Condition Prediction for Chemical Grouting Rehabilitation of Sewer Networks.” Journal of Performance of Constructed Facilities 30 (6): 04016042–. https://doi.org/10.1061/(ASCE)CF.1943-5509.0000893.
- Balekelayi, Ngandu, and Solomon Tesfamariam. 2019. “Statistical Inference of Sewer Pipe Deterioration Using Bayesian Geoadditive Regression Model.” Journal of Infrastructure Systems 25 (3): 04019021. https://doi.org/10.1061/(ASCE)IS.1943-555X.0000500.
- Baur, R., and R. Herz. 2002. “Selective Inspection Planning with Ageing Forecast for Sewer Types.” Water Science & Technology 46 (6–7): 389–396. https://doi.org/10.2166/wst.2002.0704.
- Bhavan, A., and S. Aggarwal. 2018. Stacked Generalization with Wrapper-Based Feature Selection for Human Activity Recognition. Paper presented at the 2018 IEEE Symposium Series on Computational Intelligence (SSCI). Bangalore, India: https://ieeexplore.ieee.org/document/8628830, 18-21 Nov. 2018.
- Breiman, Leo. 1996. “Bagging Predictors.” Machine Learning 24 (2): 123–140. https://doi.org/10.1007/BF00058655.
- Bui, Dieu Tien, Biswajeet Pradhan, Inge Revhaug, and Chuyen Trung Tran. 2014. “A Comparative Assessment Between the Application of Fuzzy Unordered Rules Induction Algorithm and J48 Decision Tree Models in Spatial Prediction of Shallow Landslides at Lang Son City, Vietnam.” In Remote Sensing Applications in Environmental Research, edited by Prashant K. Srivastava, Saumitra Mukherjee, Manika Gupta, and Tanvir Islam, pp. 87–111. Cham: Springer International Publishing. https://doi.org/10.1007/978-3-319-05906-8_6.
- Caradot, N., M. Riechel, M. Fesneau, N. Hernandez, A. Torres, H. Sonnenberg, E. Eckert, N. Lengemann, J. Waschnewski, and P. Rouault. 2018. “Practical Benchmarking of Statistical and Machine Learning Models for Predicting the Condition of Sewer Pipes in Berlin, Germany.” Journal of Hydroinformatics 20 (5): 1131–1147. https://doi.org/10.2166/HYDRO.2018.217.
- Caradot, Nicolas, Mathias Riechel, Pascale Rouault, Antoine Caradot, Nic Lengemann, Elke Eckert, Alexander Ringe, François Clemens, and Frédéric Cherqui. 2020. “The Influence of Condition Assessment Uncertainties on Sewer Deterioration Modelling.” Structure and Infrastructure Engineering 16 (2): 287–296. https://doi.org/10.1080/15732479.2019.1653938.
- Caradot, Nicolas, Hauke Sonnenberg, Ingo Kropp, Alexander Ringe, Stephane Denhez, Andreas Hartmann, and Pascale Rouault. 2017. “The Relevance of Sewer Deterioration Modelling to Support Asset Management Strategies.” Urban Water Journal 14 (10): 1007–1015. https://doi.org/10.1080/1573062X.2017.1325497.
- Chandrashekar, Girish, and Ferat Sahin. 2014. “A Survey on Feature Selection Methods.” Computers & Electrical Engineering 40 (1): 16–28. https://doi.org/10.1016/j.compeleceng.2013.11.024.
- Chen, Wei, Haoyuan Hong, Shaojun Li, Himan Shahabi, Yi Wang, Xiaojing Wang, and Baharin Bin Ahmad. 2019. “Flood Susceptibility Modelling Using Novel Hybrid Approach of Reduced-Error Pruning Trees with Bagging and Random Subspace Ensembles.” Journal of Hydrology 575: 864–873. https://doi.org/10.1016/j.jhydrol.2019.05.089.
- Davis, Jesse, and Mark Goadrich. 2006. “The Relationship Between Precision-Recall and ROC Curves.” In Proceedings of the 23rd International Conference on Machine Learning, 233–240. Pittsburgh, Pennsylvania, USA: Association for Computing Machinery.
- Diab, Y. G. 2000. “Maintenance of Urban Sewers in Europe: Diversity of Approaches, Tools and Strategies.“ National Conference on Environmental and Pipeline Engineering July 23-26, 2000. Kansas City, Missouri, United States. 33–39. https://doi.org/10.1061/40507(282)5.
- Doleac, M. I. C. H. E. A. L. L., S. L. Lackey, and G. N. Bratton. 1980. Prediction of Time-To Failure for Buried Cast Iron Pipe. Paper presented at the Proceedings of American water works association annual conference. Denver, Colorado, United States. 21–28.
- El-Abbasy, Mohammed S., Ahmed Senouci, Tarek Zayed, Farid Mirahadi, and Laya Parvizsedghy. 2014. “Artificial Neural Network Models for Predicting Condition of Offshore Oil and Gas Pipelines.” Automation in Construction 45: 50–65. https://doi.org/10.1016/J.AUTCON.2014.05.003.
- Farkas, Kata, Luke S. Hillary, Shelagh K. Malham, James E. McDonald, and David L. Jones. 2020. “Wastewater and Public Health: The Potential of Wastewater Surveillance for Monitoring COVID-19.” Current Opinion in Environmental Science & Health 17: 14–20. https://doi.org/10.1016/j.coesh.2020.06.001.
- Fugledalen, Thomas, Marius Møller Rokstad, and Franz Tscheikner-Gratl. 2021. “On the Influence of Input Data Uncertainty on Sewer Deterioration Models – a Case Study in Norway.” Structure and Infrastructure Engineering 19 (8): 1064–1075. https://doi.org/10.1080/15732479.2021.1998142.
- Hadzilacos, T., D. Kalles, N. Preston, P. Melbourne, L. Camarinopoulos, M. Eimermacher, V. Kallidromitis, S. Frondistou-Yannas, and S. Saegrov. 2000. “UtilNets: A Water Mains Rehabilitation Decision-Support System.” Computers, Environment and Urban Systems 24 (3): 215–232. https://doi.org/10.1016/S0198-9715(99)00058-7.
- Haixiang, Guo, Li Yijing, Jennifer Shang, Gu Mingyun, Huang Yuanyue, and Gong Bing. 2017. “Learning from Class-Imbalanced Data: Review of Methods and Applications.” Expert Systems with Applications 73: 220–239. https://doi.org/10.1016/j.eswa.2016.12.035.
- Harvey, Robert Richard, and Edward Arthur McBean. 2014. “Comparing the Utility of Decision Trees and Support Vector Machines When Planning Inspections of Linear Sewer Infrastructure.” Journal of Hydroinformatics 16 (6): 1265–1279. https://doi.org/10.2166/HYDRO.2014.007.
- Haugen, Hans Jørgen, and Asplan Viak. 2018. “Datafl yt – Klassifi sering av avløpsledninger.” Norwegian Water BA. 40. https://docplayer.me/211256711-Norsk-vann-rapport-dataflyt-klassifisering-av-avlopsledninger.html.
- Hawari, Alaa, Firas Alkadour, Mohamed Elmasry, and Tarek Zayed. 2018. “Condition Assessment Model for Sewer Pipelines Using Fuzzy-Based Evidential Reasoning.” Australian Journal of Civil Engineering 16 (1): 23–37. https://doi.org/10.1080/14488353.2018.1444333.
- Hawari, Alaa, Firas Alkadour, Mohamed Elmasry, and Tarek Zayed. 2020. “A State of the Art Review on Condition Assessment Models Developed for Sewer Pipelines.” Engineering Applications of Artificial Intelligence 93: 103721. https://doi.org/10.1016/j.engappai.2020.103721.
- Hawari, Alaa, Alkadour Firas, Mohamed Elmasry, and Tarek Zayed. 2016. “Simulation-Based Condition Assessment Model for Sewer Pipelines.” Journal of Performance of Constructed Facilities 31 (1): 04016066–. https://doi.org/10.1061/(ASCE)CF.1943-5509.0000914.
- Hilal, Anwer Mustafa, Fahd N. Al-Wesabi, Masoud Alajmi, Majdy M. Eltahir, Mohammad Medani, Mesfer Al Duhayyim, Manar Ahmed Hamza, and Abu Sarwar Zamani. 2021. “Machine Learning-Based Decision Tree J48 with Grey Wolf Optimizer for Environmental Pollution Control.” Environmental Technology 1–12. https://doi.org/10.1080/09593330.2021.2017491.
- Kabir, Golam, Balekelay Celestin Balek Ngandu, Solomon Tesfamariam, and M. Asce. 2018. “Sewer Structural Condition Prediction Integrating Bayesian Model Averaging with Logistic Regression.” Journal of Performance of Constructed Facilities 32 (3): 04018019–. https://doi.org/10.1061/(ASCE)CF.1943-5509.0001162.
- Khan, Zafar, Tarek Zayed, and Osama Moselhi. 2010. “Structural Condition Assessment of Sewer Pipelines.” Journal of Performance of Constructed Facilities 24 (2): 170–179. https://doi.org/10.1061/(ASCE)CF.1943-5509.0000081.
- Kleiner, Yehuda, and Balvant Rajani. 2001. “Comprehensive Review of Structural Deterioration of Water Mains: Statistical Models.” Urban Water 3 (3): 131–150. https://doi.org/10.1016/S1462-0758(01)00033-4.
- Kritikos, Theodosios, and Tim Davies. 2015. “Assessment of Rainfall-Generated Shallow Landslide/debris-Flow Susceptibility and Runout Using a GIS-Based Approach: Application to Western Southern Alps of New Zealand.” Landslides 12 (6): 1051–1075. https://doi.org/10.1007/s10346-014-0533-6.
- Kuliczkowska, Emilia, Andrzej Kuliczkowski, and Anna Parka. 2022. “Damages in Vitrified Clay Sewers in Service for 130–142 Years.” Engineering Failure Analysis 135: 106103. https://doi.org/10.1016/j.engfailanal.2022.106103.
- Kuncheva, Ludmila I, and Juan J Rodríguez. 2007. An Experimental Study on Rotation Forest Ensembles. Paper presented at the International workshop on multiple classifier systems. Prague, Czech Republic.
- Kursa, Miron B., and Witold R. Rudnicki. 2010. “Feature Selection with the Boruta Package.” Journal of Statistical Software 36 (11): 1–13. https://doi.org/10.18637/jss.v036.i11.
- Laakso, Tuija, Teemu Kokkonen, Ilkka Mellin, and Riku Vahala. 2018. “Sewer Condition Prediction and Analysis of Explanatory Factors.” Water 2018 10 (9): 1239. https://doi.org/10.3390/W10091239.
- Lim, Tjen-Sien, Wei-Yin Loh, and Yu-Shan Shih. 2000. “A Comparison of Prediction Accuracy, Complexity, and Training Time of Thirty-Three Old and New Classification Algorithms.” Machine Learning 40 (3): 203–228. https://doi.org/10.1023/A:1007608224229.
- Lubini, Alain T, and Musandji. Fuamba. 2011. “Modeling of the Deterioration Timeline of Sewer Systems.” Canadian Journal of Civil Engineering 38 (12): 1381–1390. https://cdnsciencepub.com/doi/pdf/10.1139/l11-103.
- Miraki, Shaghayegh, Sasan Hedayati Zanganeh, Kamran Chapi, Vijay P. Singh, Ataollah Shirzadi, Himan Shahabi, and Binh Thai Pham. 2019. “Mapping Groundwater Potential Using a Novel Hybrid Intelligence Approach.” Water Resources Management 33 (1): 281–302. https://doi.org/10.1007/s11269-018-2102-6.
- Mohammadi, Mohammadreza Malek, Mohammad Najafi, Sharareh Kermanshachi, Vinayak Kaushal, and Ramtin Serajiantehrani. 2020. “Factors Influencing the Condition of Sewer Pipes: State-Of-The-Art Review.” Journal of Pipeline Systems Engineering and Practice 11 (4): 03120002. https://doi.org/10.1061/(ASCE)PS.1949-1204.0000483.
- Mohammadi, Mohammadrza Malek, Mohammad Najafi, Amir Tabesh, Jamie Riley, and Jessica Gruber. 2019. “Condition Prediction of Sanitary Sewer Pipes.” Pipelines 2019: Condition Assessment, Construction, and Rehabilitation - Proceedings of Sessions of the Pipelines 2019 Conference. August 21-24, 2005. Houston, Texas, United States: 117–126. doi:10.1061/40800(180)61.
- Mohammadi, Mohammadreza Malek, Mohammad Najafi, Kaushal Vinayak, Serajiantehrani Ramtin, Salehabadi Nazanin, and Ashoori Taha. 2019. “Sewer Pipes Condition Prediction Models: A State-Of-The-Art Review.” Infrastructures 4 (4): 64. https://doi.org/10.3390/infrastructures4040064.
- Najafi, Mohammad, and Guru Kulandaivel. 2005. “Pipeline Condition Prediction Using Neural Network Models.“ Pipelines 2005: Optimizing Design, Operations, and Maintenance. August 21-24, 2005. Houston, Texas, United States. 767–781. doi:10.1061/40800(180)61.
- Nanda, Muhammad Achirul, Kudang Boro Seminar, Akhiruddin Maddu, and Dodi Nandika. 2021. “Identifying Relevant Features of Termite Signals Applied in Termite Detection System.” Ecological Informatics 64: 101391. https://doi.org/10.1016/j.ecoinf.2021.101391.
- Ngandu, Balekelayi, Solomon Tesfamariam, and M. Asce. 2019. “Statistical Inference of Sewer Pipe Deterioration Using Bayesian Geoadditive Regression Model.” Journal of Infrastructure Systems 25 (3): 04019021–.
- Phong, Tran Van, Binh Thai Pham, Phan Trong Trinh, Ly Hai-Bang, Vu Quoc Hung, Lanh Si Ho, Le Hiep Van, Lai Hop Phong, Mohammadtaghi Avand, and Indra Prakash. 2021. “Groundwater Potential Mapping Using GIS-Based Hybrid Artificial Intelligence Methods.” Groundwater 59 (5): 745–760. https://doi.org/10.1111/gwat.13094.
- Rajani, Balvant, and Yehuda Kleiner. 2001. “Comprehensive Review of Structural Deterioration of Water Mains: Physically Based Models.” Urban Water 3 (3): 151–164. https://doi.org/10.1016/S1462-0758(01)00032-2.
- Randall-Smith, M., R. Oliphant, and A. Russell. 1992. Guidance Manual for the Structural Condition Assessment of Trunk Mains. Swindon, UK: Water Research Centre: WRc.
- RIF. 2021. Rådgivende Ingeniørers Forening. Oslo, Norway: Rådgivende Ingeniørers Forening (RIF). https://rif.no/wp-content/uploads/2019/08/Vann-Avl%C3%B8psanlegg.pdf Accessed June 15.
- Rodriguez, Juan José, Ludmila I Kuncheva, and Carlos J Alonso. 2006. “Rotation Forest: A New Classifier Ensemble Method.” IEEE Transactions on Pattern Analysis & Machine Intelligence 28 (10): 1619–1630. https://doi.org/10.1109/TPAMI.2006.211.
- Sahu, S., and B. M. Mehtre. 2015. Network Intrusion Detection System Using J48 Decision Tree. Paper presented at the 2015 International Conference on Advances in Computing, Communications and Informatics (ICACCI) Kochi, India, 10-13 Aug. 2015.
- Salman, Baris, and Ossama Salem. 2012. “Modeling Failure of Wastewater Collection Lines Using Various Section-Level Regression Models.” Journal of Infrastructure Systems 18 (2): 146–154. https://doi.org/10.1061/(ASCE)IS.1943-555X.0000075.
- Sanchez-Pinto, L. Nelson, Laura Ruth Venable, John Fahrenbach, and Matthew M. Churpek. 2018. “Comparison of Variable Selection Methods for Clinical Predictive Modeling.” International Journal of Medical Informatics 116: 10–17. https://doi.org/10.1016/j.ijmedinf.2018.05.006.
- Sempewo, Jotham Ivan, and Lydia Kyokaali. 2019. “Comparative Performance of Regression and the Markov Based Approach in the Prediction of the Future Condition of a Water Distribution Pipe Network Amidst Data Scarce Situations: A Case Study of Kampala Water, Uganda.” Water Practice & Technology 14 (4): 946–958. https://doi.org/10.2166/WPT.2019.075.
- Shahabi, Himan, Ataollah Shirzadi, Kayvan Ghaderi, Ebrahim Omidvar, Nadhir Al-Ansari, John J. Clague, Marten Geertsema, et al. 2020. “Flood Detection and Susceptibility Mapping Using Sentinel-1 Remote Sensing Data and a Machine Learning Approach: Hybrid Intelligence of Bagging Ensemble Based on K-Nearest Neighbor Classifier.” Remote Sensing 12 (2): 266. https://doi.org/10.3390/rs12020266.
- Shirzadi, Ataollah, Karim Solaimani, Mahmood Habibnejad Roshan, Ataollah Kavian, Kamran Chapi, Himan Shahabi, Saskia Keesstra, Baharin Bin Ahmad, and Dieu Tien Bui. 2019. “Uncertainties of Prediction Accuracy in Shallow Landslide Modeling: Sample Size and Raster Resolution.” CATENA 178: 172–188. https://doi.org/10.1016/j.catena.2019.03.017.
- Shirzadi, Ataollah, Karim Soliamani, Mahmood Habibnejhad, Ataollah Kavian, Kamran Chapi, Himan Shahabi, Wei Chen, et al. 2018. “Novel GIS Based Machine Learning Algorithms for Shallow Landslide Susceptibility Mapping.” Sensors 18 (11): 3777. https://doi.org/10.3390/s18113777.
- Syachrani, Syadaruddin, Hyung Seok, David Jeong, and Colin S. Chung. 2013. “Decision Tree–Based Deterioration Model for Buried Wastewater Pipelines.” Journal of Performance of Constructed Facilities 27 (5): 633–645. https://doi.org/10.1061/(ASCE)CF.1943-5509.0000349.
- Tharwat, Alaa. 2021. “Classification Assessment Methods.” Applied Computing & Informatics 17 (1): 168–192. https://doi.org/10.1016/j.aci.2018.08.003.
- Ting, Kai Ming, and Ian H Witten. 1997. “Stacking Bagged and Dagged Models.“ ICML '97: Proceedings of the Fourteenth International Conference on Machine Learning Pages. San Francisco, CA, United States: Morgan Kaufmann. 367–375. https://researchcommons.waikato.ac.nz/handle/10289/1072.
- Tizmaghz, Z., J. E. van Zyl, and T. F. P. Henning. 2022. “Consistent Classification System for Sewer Pipe Deterioration and Asset Management.” Journal of Water Resources Planning and Management 148 (5): 04022011. https://doi.org/10.1061/(ASCE)WR.1943-5452.0001545.
- Tran, Huu Dung. 2007. “Investigation of deterioration models for stormwater pipe systems.” PhD thesis, Victoria University. https://vuir.vu.edu.au/1456/3/TRAN%20Huu%20Dung-thesis_nosignature.pdf.
- Tran, H. D., and A. W. M. Ng. 2010. “Classifying Structural Condition of Deteriorating Stormwater Pipes Using Support Vector Machine.” Pipelines 2010: Climbing New Peaks to Infrastructure Reliability - Renew, Rehab, and Reinvest - Proc. of the Pipelines 2010 Conference. Pipeline Division Specialty Conference 2010August 28 - September 1, 2010. Keystone, Colorado, United States. 386:857–866. https://doi.org/10.1061/41138(386)82.
- Tran, H. D., B. J. C. Perera, and A. W. M. Ng. 2009. “Markov and Neural Network Models for Prediction of Structural Deterioration of Storm-Water Pipe Assets.” Journal of Infrastructure Systems 16 (2): 167–171. https://doi.org/10.1061/(ASCE)IS.1943-555X.0000025.
- Tsai, Chih-Fong, Li Miao-Ling, and Wei-Chao Lin. 2018. “A Class Center Based Approach for Missing Value Imputation.” Knowledge-Based Systems 151: 124–135. https://doi.org/10.1016/j.knosys.2018.03.026.
- Tscheikner-Gratl, Franz, Nicolas Caradot, Frédéric Cherqui, Joao P. Leitão, Mehdi Ahmadi, Jeroen G. Langeveld, Yves Le Gat, et al. 2019. “Sewer Asset Management – State of the Art and Research Needs.” Urban Water Journal 16 (9): 662–675. https://doi.org/10.1080/1573062X.2020.1713382.
- Venkatesh, G., and Helge Brattebø. 2012. “Assessment of Environmental Impacts of an Aging and Stagnating Water Supply Pipeline Network.” Journal of Industrial Ecology 16 (5): 722–734. https://doi.org/10.1111/j.1530-9290.2011.00426.x.
- Vitorino, D., S. T. Coelho, P. Santos, S. Sheets, B. Jurkovac, and C. Amado. 2014. “A Random Forest Algorithm Applied to Condition-Based Wastewater Deterioration Modeling and Forecasting.” Procedia Engineering 89: 401–410. https://doi.org/10.1016/j.proeng.2014.11.205.
- Vladeanu, G., John Matthews, and M. Asce. 2019. “Wastewater Pipe Condition Rating Model Using Multicriteria Decision Analysis.” Journal of Water Resources Planning and Management 145 (12): 04019058–. https://doi.org/10.1061/(ASCE)WR.1943-5452.0001134.
- Yin, Xianfei, Yuan Chen, Ahmed Bouferguene, and Mohamed Al-Hussein. 2020. “Data-Driven Bi-Level Sewer Pipe Deterioration Model: Design and Analysis.” Automation in Construction 116: 103181. https://doi.org/10.1016/j.autcon.2020.103181.