
ABSTRACT
The UK’s abundant municipal water supply has resulted in slow progress with the uptake of rainwater harvesting (RWH) systems within the home. Research has indicated that exploring public preferences for domestic RWH are necessary for increasing demand. Here, we use explicit and implicit tests to investigate public perceptions of RWH for non-potable uses, and compare perceptions of respondents with and without domestic RWH systems. RWH is perceived positively by most respondents indicating an openness and acceptance of this technology (and/or lack of strong negative attitudes). Implicit attitudes are generally more positive than explicit, especially in respondents with RWH systems, implying that the positivity is deep-seated in their subconsciousness. We also reveal differences between subconscious (implicit) beliefs and practical difficulties (explicit opinions). Outdoor uses of rainwater are preferred, hence, more work in promoting indoor uses is needed to maximise the resource potential of UK rainfall and uptake of RWH systems.
1. Introduction
Rainwater and stormwater harvesting are recognised as a potential option to fulfil dual purposes in urban water management by managing stormwater runoff to improve flood resilience while augmenting the water supply to reduce demand placed on other sources (Campisano et al. Citation2017). Consequentially, they have received increasing attention globally in response to a future where urbanisation and climate change impacts (e.g. extreme rainfall events, flooding, heatwaves and drought) put pressure on the environmental quality of cities (IPCC Citation2021). Rainwater harvesting (RWH) is a strategy often examined within integrated flood risk or water resource management, and as a potential source of drinking water within water-scarce regions in the Global South (Staddon et al. Citation2018). It is also a promising technology to increase progress towards the United Nations Sustainable Development Goals (de Sá Silva et al. Citation2022).
RWH describes a variety of different methods for collecting rain- or stormwater at the point of ‘earthfall’ and distributing it as treated or untreated water, suitable for various potable or non-potable uses. This can vary from small-scale collection in externally mounted tanks (rainwater barrels or water butts) for individual untreated garden supply or treated household consumption, to neighbourhood-scale collection, treatment, and pressurised distribution systems (Lee et al. Citation2016; Campisano et al. Citation2017; see also Supplementary Material). In the UK context, where water shortages are generally seasonal and short-lived, a tradition of water butts for garden watering is long-standing but other modes of rainwater use have been supplanted by a plentiful municipal supply for most urban households. RWH systems were reported to be exceptionally scarce in 2001 and by 2011 an estimated 7500 systems were thought to be in place (Fewkes Citation2012).
Motivations for increasing the use of RWH have arisen due to water stress, scarcity, and reducing the use of energy-intensive and costly potable water supply for non-potable uses. Nonetheless, the benefits are hard to justify from these perspectives alone (Way et al. Citation2010). The largest potential for mainstreaming RWH is not related to external water-butts but within the home, where water usage is dominated by non-potable uses (e.g. 30% of water use is for toilet flushing) (POST Citation2000). As the UK adapts to the impacts of climate change, water-meters become more widespread, and new planning requirements to reduce runoff from new developments are implemented, targeted research into RWH is required. Research into the acceptability and preferences relating to RWH systems that supply water for internal uses is key, and the focus of this study.
1.1 Explicit views on RWH
Preferences for use of alternative water sources (including harvested rainwater) vary by location, so it is important to study this issue in context (Hurlimann and Dolnicar Citation2016; Lee et al. Citation2016). Availability of tap water in developed countries contrasts with greater use of wells and boreholes in less developed contexts. Literature in developed economies is focussed on the replacement of tap water with alternatives to mitigate against shortages or to reduce the cost of supply (Fielding et al. Citation2015; Quinn et al. Citation2020). Accordingly, comparisons are not usually made to municipal ‘tap water’ although a study in Australia found consistent preference for tap water over other sources for drinking (Hurlimann and Dolnicar Citation2016). Among alternative sources of drinking water, another study of 1000 households in Australia found rainwater was most accepted over stormwater, desalinated water, and recycled water (Fielding et al. Citation2015). Hurlimann and Dolnicar (Citation2016) noted that across nine countries, the acceptance of alternative water sources was highest for non-personal and non-potable uses. Data-driven hedonic price studies research conducted in Perth, Australia, found that ‘rainwater tanks have an effect similar to that of a home improvement’ (Zhang et al. Citation2015, 20). More examples of published studies are given in the Supplementary Material.
Households in the UK are generally reluctant to accept the use of rainwater for drinking and other potable uses (Egyir, Brown, and Arthur Citation2016; Fewkes Citation2012; Ward et al. Citation2013). Egyir et al. (Citation2016) found in three regions in Scotland that 19–27% of households thought drinking rainwater was acceptable but only 9–16% thought it was likely they would do so. A further 86–96% would use rainwater for car washing, 85–92% for toilet flushing and 66–74% for laundry Egyir et al. (Citation2016.). Ward et al. (Citation2013) found ~25% selected ‘yes’ or ‘maybe’ when asked if they would consider using harvested rainwater for drinking purposes, but 93% would use rainwater for toilet flushing, 92% for general outdoor use, 89% for garden watering, 86% for car washing, 56% for bathing animals and 38% for laundry. Other UK studies focus on rainwater reuse via water butts. Chenoweth et al. (Citation2016), in a high-income population where almost all had gardens and lived in single-unit owner-occupied dwellings, found two-thirds favoured water butts but only 8% said they would consider installing a RWH system that would allow rainwater to be used for internal uses. Adeyeye and Piroozfar (Citation2012) also agree that most homes with gardens have a water-butt and about half were supportive of RWH but only 3% were receptive to installing RWH due largely to perceptions of expense and disruption during installation. Economic and financial constraints were also cited as barriers for UK house building companies to include RWH systems in new build developments (Parsons et al. Citation2010).
1.2 Focus of this study
In this research we are conceptualising RWH as a pro-environmental choice that may be preferred by households for non-potable uses. We allow for the possibility that households may prefer to use rainwater for cost and environmental purposes and explore the difference in respondents’ attitudes. There is less research that sees RWH as a positive pro-environmental choice as opposed to a necessity due to lack of availability of municipal supply or to save on water bills. In this study, we surveyed four small residential developments in England to investigate the acceptance of RWH systems for non-potable uses. We also examined the difference between explicit (stated) attitudes and implicit (subconscious) responses. While previous studies have reflected on barriers to installation of systems based on expressed willingness to use rainwater for non-potable uses, we explored whether this expressed willingness is also embedded in the implicit attitudes revealed by an implicit association test (IAT). Implicit measures can highlight attitudes that people were not consciously aware that they had and many of the external influences and biases associated with measuring explicit attitudes (e.g. trying to be more environmentally aware than one is in practice) can be reduced (Maison, Greenwald, and Bruin Citation2004; Schultz et al. Citation2004).
2. Methods
2.1. UK study sites
Three areas were selected; Elmsbrook in Bicester, Oxfordshire; Hanham, south Gloucestershire, and; Eddington, Cambridge. All contained housing developments that were built with RWH systems installed. In addition, a housing development in Bicester without RWH (Bure Park) was surveyed as a control. As three of the four target areas are eco-towns there may be some bias in responses from working with people who are potentially more environmentally friendly. However, it was essential to includes these groups to determine whether experience living with a RWH system impacted perceptions.
Elmsbrook is the first phase of development of an eco-town in northwest Bicester, designed to create a sustainable net-zero carbon community. There are currently 393 homes and it is reported to be the largest true zero carbon development in the UK (UKGBC Citation2023). RWH was installed in over 300 properties, primarily for toilet flushing with the aim to reduce mains water use to 80 L per person, per day. In the apartments, where water is not being collected for harvesting, water butts have been installed for communal outdoor use (Reed, Citationn.d.). The development at Hanham Hall comprises 186 dwellings ranging from one-bedroom flats to five-bedroom houses within nine hectares and is one of the flagship carbon challenge schemes promoted by the Homes and Communities Agency (now Homes England). It is England’s first large-scale volume house builder scheme to achieve the zero-carbon standard. Permeable paving across the site contributes to a communal RWH facility which is designed to provide enough water to flush one toilet and supply one washing machine in each home (Forterra Citationn.d.). Eddington is the first phase in the northwest Cambridge development, providing housing, community and sports facilities, integrated transport networks and parks and open spaces. It has been designed to encourage sustainable living and is home to the UK’s largest, site-wide water recycling system. Collected rainwater is used in buildings for washing machines and toilet flushing (Eddington Cambridge Citationn.d.). Bure Park is a residential area in northwest Bicester, built in the late 1990s. Specific eco-features were not built into these properties and so it was assumed that most properties would not have a RWH system installed.
2.2. Online survey: explicit test (feeling thermometer)
The survey was initially distributed via social media to the target groups, facilitated by key contacts made at the study sites. Follow-up postcards with a link to the survey were sent out to 1400 households. Informed consent was gained from all respondents via an online check-list and no identifying information was obtained. Ethics approval to undertake the study was granted by the University of Nottingham School of Geography Ethics Committee. The IAT component of the test required the use of a keyboard and could not be carried out on a mobile device. While we recognise that this may have reduced the response rate, the software that we used was unable to adapt to the user interface on mobile devices.
Participants completed three feeling thermometer tests to express their thoughts, 1) on RWH in general, 2) on environmental grounds and 3) on cost. Participants were asked to study six images depicting domestic activities with either a tap or raincloud. The scales ranged from 0 (Unhappy) to 100 (Happy). Averages for the three thermometer scores for tap water use, and three scores for rainwater use, were calculated. The thermometer difference (TD) scores were calculated by subtracting the rainwater scores from the tap water scores for the ‘How do you feel in general using this source of water’ question and then normalised to a −2 to +2 scale for consistency with the IAT. Positive TD-scores indicate a preference for tap water for non-drinking purposes and negative scores reflect a preference for rainwater for non-drinking purposes.
Participants were then asked to rank their opinion on seven categories relating to each water source on a 5-point Likert scale ranging from strongly agree to strongly disagree. The categories were:
I think this source of water is environmentally friendly.
I think this source of water is good for washing my vehicle.
I think this source of water would be good for plants.
I think this source of water would leave my toilet clean.
I think this source of water would make my clothes clean.
I would be happy to clean my pets in this source of water.
I would be happy to use this source of water in a paddling pool.
Respondents were also able to provide free text comments relating to the use of tap water and harvested rainwater.
2.3. Online survey: implicit association test (IAT)
The image-based IAT methodology was adapted from O’Donnell et al. (Citation2020), which followed the method of Greenwald et al. (Citation1998), and used the FreeIAT software (Meade Citation2009). Target-concepts and evaluative attributes were the two stimuli used. The target-concepts were images of six domestic activities with either a water tap or raincloud (denoting tap water and harvested rainwater, respectively). These were the same images that were shown to participants at the start of the feeling thermometer tests. A set of 24 positive and 24 negative words represented the evaluative attributes (Supplementary Material Table S1). These words were selected from an online thesaurus as frequently used English language synonyms for positive and negative concepts.
The IAT consists of five rounds with 20 trials. Each trial is associated with one stimulus, either an image or an evaluative attribute word that are randomly selected in all tests and then entered back into the selection processes. During the test, the randomly selected stimuli are shown, one at a time, in the centre of the screen and participants are asked to categorise each stimulus as quickly as possible using the left (e) and right (i) keys. The categories that the ‘e’ and ‘i’ keys represent are shown at the top of the screen and change over the course of the five rounds. The first two rounds are practice rounds for familiarity with the images and words. The third round is the first combined task, the fourth round is a practice with the combined task reversed, and the fifth round is the reversed combined task. The stimulus is shown on the screen until it is correctly classified into the pre-selected categories. If an incorrect response is given, a red ‘X’ appears and the respondent is required to select the correct response key to continue (Meade Citation2009).
The two combined tasks (rounds 3 and 5) provide a measure of implicit attitudinal difference among the target-concept categories. If a participant differentially associates target-concepts with evaluative attributes then they should find one of the combined tasks easier (or faster to respond to) than the other. The IAT effect (called the ‘difference’ or D-score) is the difference between the average response time across all trials in round 5 minus the average response time in round 3. D-scores were calculated following O’Donnell et al. (Citation2020). As part of the scoring, algorithm trials with response times greater than 10,000 ms, or less than 300 ms for more than 10% of their trials, were first removed. The block mean of correct trials +600 ms was added to trials initially answered incorrectly. A high D-score indicates that tap water use for non-drinking purposes was more closely associated with positive concepts, and/or less closely associated with negative concepts, than rainwater use for non-drinking purposes. D-scores between −0.2 and +0.2 are considered neutral, indicating no preference (Beattie and McGuire Citation2012).
3. Results
A total of 44 usable responses were collected, which is comparable to other peer-reviewed publications using IATs with similar or fewer subjects (e.g. Ames et al. Citation2014; Gattol, Sääksjärvi, and Carbon Citation2011; Riebel, Egloff, and Witthöft Citation2013; Suwartono, Meinarno, and Bawono Citation2017). We acknowledge the value in conducting further studies with larger sample populations and that these findings should be considered as preliminary, but nonetheless, producing valuable and interesting observations for discussion.
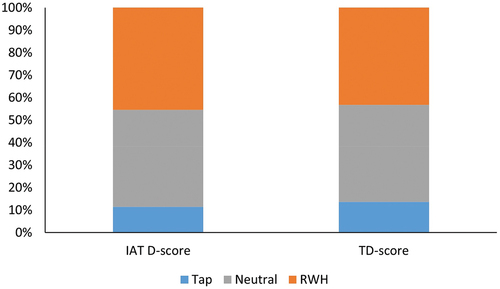
The explicit TD scores ranged from −1.98 to 0.80 (mean = −0.41, s.d. = 0.76), indicating that the sample population has an overall explicit preference for using rainwater above tap water for non-drinking purposes. 43% of respondents preferred rainwater, 43% gave neutral responses and 14% expressed a preference for tap water (). Implicit D-scores ranged from −1.34 to 0.51 (mean = −0.22, s.d. = 0.41) indicating there was also an implicit preference for using rainwater for non-drinking purposes. Forty-five per cent expressed a preference for rainwater, 43% neutral and 11% tap water (). There is a weak but statistically significant correlation between the TD scores and D scores (r = 0.36, p = 0.02), and the TD and D scores were not significantly different (p-value = 0.8 Mann-Whitney U Test).
Figure 1. Comparison of respondents’ preferences (n = 44) for tap water or rainwater for non-drinking domestic uses determined from the implicit association test score (IAT D) and thermometer difference score (TD).
3.1. Feeling thermometer and likert scores
The average scores for the three feeling thermometer subcategories (general perceptions (Gen), environment (Env) and Cost) for both tap water and rainwater were positive, suggesting that respondents were content with both sources of water. Despite this, a greater proportion of respondents scored RWH at the top of the 5-point Likert scale for the three subcategories (Gen = 53%, Env = 73% and Cost = 64%), compared with scores of 41%, 39% and 39%, respectively, for tap water. A Spearman’s rank order correlation was run to determine the relationship between the three subcategories. There was a strong positive correlation between TD (Gen) and TD (Env) (r = 0.583, p < 0.05) and TD (Gen) and TD (Cost) (r = 0.577, p < 0.05) both of which were statistically significant. Opinions from the Likert test on non-potable uses of both tap and rainwater are generally favourable with the average score for each category above 3 (). In four out of the seven categories, the average scores for RWH were higher than for tap water.
Figure 2. Comparison of respondents’ average scores in the Likert tests for the seven categories of non-potable water use. Tap water is represented by blue dots and rainwater harvesting (RWH) by green triangles. Env = whether respondent’s thought this source of water was environmentally friendly.
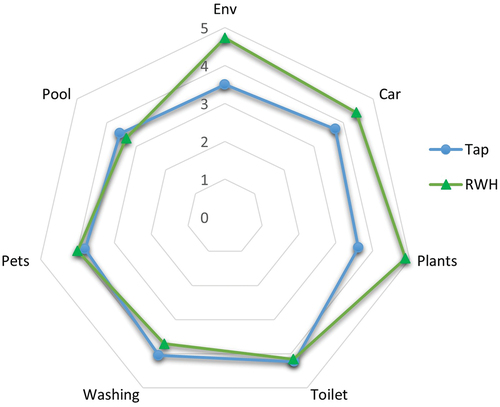
Ninety-eight per cent of respondents strongly agreed or agreed that rainwater is environmentally friendly, compared with 52% who believed this for tap water. In contrast, 25% of respondents disagreed or strongly disagreed that tap water was environmentally friendly compared with 0% for rainwater. Out of the other six feeling thermometer categories, toilet flushing received the most positive scores for tap water with 86% of respondents strongly agreeing/agreeing that this source of water would leave their toilet clean, closely followed by washing clothes at 80%. For RWH, 100% and 91% of respondents strongly agreed/agreed that rainwater could be used to water plants and wash vehicles, respectively, but 30% of respondents would not be happy to use rainwater in a paddling pool. 27% of respondents did not think that tap water would be good for plants.
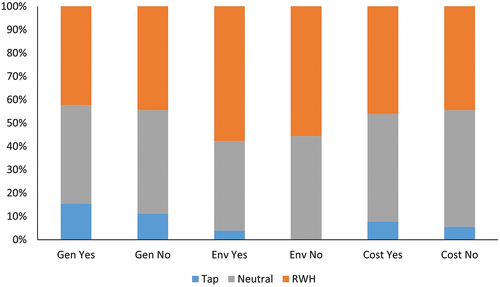
In considering potential relationships between owning a RWH system and respondents’ explicit preferences, there does not appear to be much difference between those with and without a RWH system. In the TD Gen tests (explicit perceptions of general water use) for those with a RWH system, respondents were equally divided between no preference over tap water or harvested rainwater (neutral responses), and a preference for RWH (42% each). Similarly, those without a RWH system were equally divided between no preference regarding general water use and a preference for RWH (44% each). In the thermometer subcategories, respondents both with and without a RWH system felt more positive towards RWH systems on environmental grounds (). Regarding cost, those with a RWH system were either non-committal or favoured RWH and those without were predominantly neutral, suggesting no strong attitudes towards cost of harvested rainwater or tap water. In the Likert tests, those with a RWH system were generally more positive about using RWH for domestic tasks, than those without. In two categories (toilet flushing and clothes washing), those with a system were typically more positive about using rainwater than those without.
Figure 3. Comparison of respondents’ preferences for the subcategories from the thermometer tests for those with ('yes') and without (‘no’) a RWH (rainwater harvesting) system.
3.2. Differences in preferences of respondents with and without RWH systems
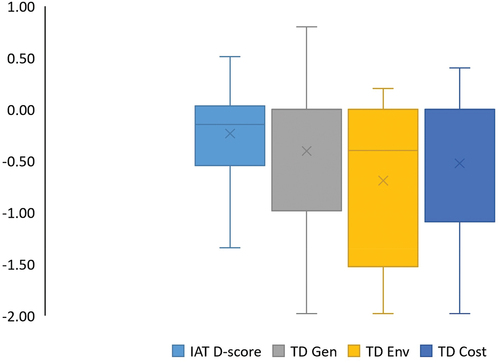
To reiterate, negative D-score and TD-scores suggest that rainwater use for non-drinking purposes are more closely associated with positive concepts, and/or less closely associated with negative concepts. demonstrates that the majority of respondents implicitly and explicitly had a preference for rainwater use, or had no strong preference (neutral response). The highly negative, individual explicit scores for all three sub-categories (general perceptions, environment and cost) confirms this preference for RWH, however, the higher variability for explicit perceptions indicates that not all respondents conform to the common preference ().
Figure 4. Distribution of implicit association test (IAT) D scores and feeling thermometer TD scores for the three subcategories (general (Gen) in grey, environment (Env) in yellow, and cost in blue). The horizontal line represents the median and the box the interquartile range.
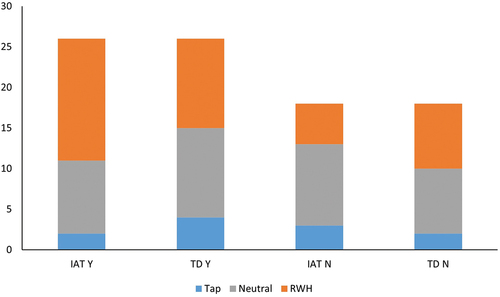
Fifty-eight per cent of respondents with RWH systems expressed an implicit preference for rainwater, with only 8% preferring tap water. Most respondents (56%) without RWH systems had no strong preference for rainwater or tap water, with 28% and 17% preferring rainwater and tap water, respectively (). Our data shows significant differences between those with a RWH system and those without (p = 0.014 Mann Whitney U test). illustrates that there is a greater implicit preference for RWH, compared to explicit preference, for those with a RWH system. In contrast, there is a greater explicit preference for RWH, compared to implicit, for those without a system.
Figure 5. Implicit preferences of respondents with and without a RWH system as determined by the implicit association test (IAT).
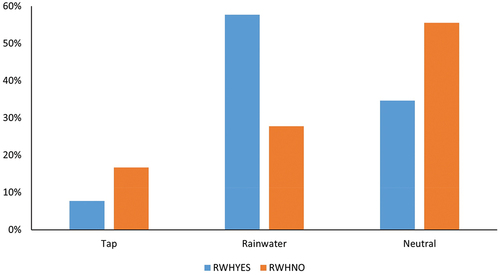
Figure 6. Comparison of implicit (IAT) and explicit (TD) tests for respondents’ preferences for those with (denoted by ‘Y’) and without (denoted by ‘N’) RWH systems.
4. Discussion
Increasing demand for harvested rainwater, rather than improvements in system engineering, has been shown to be the most effective way to increase uptake of RWH systems in the UK (Quinn et al. Citation2020). Consequentially, the first step in increasing demand for rainwater use is to understand preferences. Perceptions of RWH are traditionally explored using explicit measures such as surveys and Likert scale tests where respondents report their stated preferences (e.g. Adeyeye and Piroozfar Citation2012; Egyir, Brown, and Arthur Citation2016; Fredenham et al. Citation2020; Ward et al. Citation2013; Ward, Butler, and Memon Citation2008). Explicit measures assume that individuals are aware of, and can articulate, their beliefs (Schultz et al. Citation2004). However, the assumption that individuals can report their attitudes explicitly has been challenged and new methods developed to assess subconscious attitudes that are outside of conscious control (Cunningham, Preacher, and Banaji Citation2001). A key advantage of the IAT is that it can illustrate attitudes that individuals were unaware that they had (Maison, Greenwald, and Bruin Citation2004). The spontaneous nature of the IAT can also remove issues relating to social desirability bias and self-enhancement bias (e.g. where respondents try to appear more environmentally friendly than they are) that are an acknowledged limitation of explicit tests (Schultz et al. Citation2004). The combination of explicit (feeling thermometer) and implicit (IAT) tests that we present in this paper enhances the knowledge base on perceptions of rainwater usage. We build on previous work that suggests uses of RWH are more accepted the further they are from personal contact (Egyir, Brown, and Arthur Citation2016; Ward et al. Citation2013) and provide a unique insight into subconscious perceptions that have been shown to play an important role in people’s behaviour (White et al. Citation2010). A key finding is that those with RWH systems have a stronger implicit preference for using rainwater whereas the majority of those without RWH systems had no strong implicit beliefs. This difference in perceptions between respondents with and without home RWH systems was not observed in the explicit tests, demonstrating the added value of investigating implicit perceptions. This also suggests that experience with RWH systems has potentially changed people’s internal concepts of RWH, though, for example, greater knowledge of how the system works in practice and confidence in its functionality, which has subsequently influenced their subconscious attitudes. We can infer that the positive explicit attitudes towards rainwater reuse demonstrated in the thermometer responses has not necessarily translated into such strong positive implicit attitudes towards rainwater use, especially for those without systems, suggesting a disconnect between stated and subconscious preferences. Further research is needed to explore how this disconnect might influence people’s behaviours, yet this greater depth of information demonstrates the advantage of coupling explicit tests with IATs.
4.1. Explicit and implicit preferences for RWH for non-drinking purposes
The respondents in our study expressed either an equal preference, along with neutral (explicit) or a marginal preference (implicit) for using rainwater for non-drinking domestic purposes, reflecting a generally positive attitude to this water source. This is in keeping with previous UK studies investigating public receptivity to RWH (Fredenham et al. Citation2020; Ward et al. Citation2013). Almost 90% of respondents gave a positive opinion about the idea of RWH. Positive comments mainly reflected on the benefits to the environment:
I thoroughly support the notion of rainwater harvesting as I believe in sustainable option for a healthy lifestyle and to save the planet.
I think it is a great way to take the pressure off the treated water system and also a way to reduce run-off caused by so much concrete ground where rain can’t sink in.
Perceptions of the benefits of RWH to the environment are evidenced in the high thermometer and Likert scores for this category. The general high level of positivity could be interpreted as a reflection of a strong conscious opinion of resource and environmental awareness, as observed by Fredenham et al. (Citation2020) and given that environmental concerns are currently topical. In other countries where water reuse is much higher (e.g. Germany), the primary drivers for rainwater reuse are environmental Fredenham et al. (Citation2020.).
4.2. Influence of owning a RWH system
General preferences for tap water are demonstrated by 15% of respondents with RWH systems (, based on responses to the thermometer Gen sub-category, and also noting that 8% of respondents with RWH systems preferred tap water on the basis of cost) and the free-text comments suggest that maintenance issues and the economic viability of RWH systems were recognised as problems:
It is an excellent idea to limit use of treated water for domestic use and use the ‘grey’ water for toilet flushing, etc. I do at times, however, wonder if it is economically viable or merely a conservationist project.
It is a great idea and it’s great when it works however we have seen some issues with blocked filters and dirty water. Overall I support it.
I think it is a great idea in theory. In practice, we have had some issues with the system itself.
Poor experiences with RWH systems could be a factor in influencing peoples’ perceptions and may be why some respondents with RWH systems implicitly and/or explicitly preferred tap water.
Conversely, implicit views generally show that those with a RWH system prefer RWH and those without tend towards a more neutral response. Respondents with an implicit preference for tap water, are predominantly those without a RWH system. For this latter group, their explicit views were either neutral or show a preference for RWH and their free comments were all positive. Three of the four target areas used in this study were eco-towns, where measures had been put in place to create more sustainable, environmentally-responsible living, including the inclusion of RWH systems. It is possible that the people that chose to live in these locations do so because they are environmentally aware and that the implicit preference for RWH comes from a deep-seated belief to do the right thing environmentally. In developments where RWH systems are not in place, there may be an openness to the idea of RWH, given the high percentage of neutral respondents (i.e. no strong negative opinions of RWH). We did not explore residents’ willingness to pay for RWH systems, however we deduce from the lack of a strong preference for RWH that most households would not be prepared to invest their time or money. This is an avenue of future research.
In developed countries, tap water is cheap and easily accessible and people feel safe using it. There is also the perception that we waste water and that using high quality drinking water for some domestic situations is unnecessary (Fredenham et al. Citation2020). The acceptance of other water sources for non-potable uses in other countries has been previously noted (Hurlimann and Dolnicar Citation2016). In addition, other studies have investigated what people would feel comfortable using rainwater for and found that the risk associated with the different uses increased as personal contact with the water increased (Ward et al. Citation2013). The domestic activities included in this study were predominantly considered ‘low-risk’ (Ward et al. Citation2013) and could account for our respondents feeling comfortable with using RWH for such purposes. Our findings reveal there are few attitudinal barriers to implementing RWH systems for non-potable use within new developments and that residents would be likely to use the water for a variety of non-potable purposes.
4.3. Limitations
While the IAT can provide key insights into implicit attitudes that ultimately influence peoples’ behaviours, there are limitations to this approach. The method does not allow one to discern whether respondents have a positive association with one target-concept and/or a negative association with the other (in this case, a negative D-score could imply that rainwater use for non-drinking purposes are more closely associated with positive concepts, and/or that tap-water is more closely associated with negative concepts), this is acknowledged in the literature, e.g. Greenwald et al. (Citation1998) and Gregg and Klymowsky (Citation2013). The low number of responses in this study may be due to the necessity to conduct the IAT on a computer/tablet keyboard as the FreeIAT software could not be used on a mobile device which, for many, is the chosen platform for internet access. For future investigations we would seek to use IAT software compatible with mobile devices, e.g. Inquisit Web. We also (purposely) did not define what we meant by ‘rainwater harvesting’ to avoid influencing respondents’ perceptions which may have led to some confusion to the scale of RWH we were assessing, as noted by one respondent:
You haven’t defined RWH but I’m taking it as anything from a water butt to a more complicated and expensive community scale capture system. (which would require treatment).
Further limitations are common to research using feeling thermometers, such as the starting position of the slider and the words used in describing the concepts and attributes. IATs and feeling thermometer tests are also unable to explain why certain attitudes and preferences are held, which would require more extensive research.
5. Conclusion
Understanding public perceptions of rainwater harvesting (RWH) systems is required to address the barriers affecting uptake of this technology to reduce personal water consumption, reduce risks of water stress and facilitate flood risk management in the UK. The image based implicit association test (IAT) that is presented here investigates unconscious perceptions of RWH. Combined with the explicit feeling thermometer tests, the IAT provides complementary information on public preferences of RWH amongst those with and without a RWH system installed in their homes.
The IAT provides insight that cannot be gained from the explicit, stated preference tests. RWH is perceived positively amongst the respondents, indicating an openness and acceptance of this technology (and/or lack of strong negative attitudes). Implicit attitudes are generally more positive than explicit, especially in respondents with RWH systems, implying that the positivity is deep-seated. Use of IATs is often designed to detect social desirability bias but in this case, we are perhaps revealing the difference between subconscious beliefs (implicit) and practical difficulties (as expressed by explicit opinions) which are important to understand. As outdoor uses of rainwater are the most preferred there may be some way to go to incentivise the indoor use of harvested rainwater. However, those with RWH systems see them as better than tap water for toilet flushing and washing clothes. Increased awareness of non-potable uses of recycled rainwater amongst those without systems might be beneficial and increase support for this technology. Our findings are positive for the future acceptance and adoption of RWH where it is justified to install them.
Acknowledgements
This research was performed as part of an interdisciplinary project undertaken by the Urban Flood Resilience Research consortium (www.urbanfloodresilience.ac.uk).
We express our thanks to the respondents who completed these tests and to Larry Neylon and Robyn Ward for assistance in modifying and updating the original IAT and making it work
Disclosure statement
No potential conflict of interest was reported by the author(s).
Data availability statement
The participants of this study did not give written consent for their data to be shared publicly, so due to the sensitive nature of the research supporting data is not available.
Additional information
Funding
References
- Adeyeye, K., and P. Piroozfar 2012. User Attitudes and Preferences—A Study for Water Efficiency in UK Homes. In: Proceedings of the Joint Cib International Symposium of W055, W065, W089, W118, TG76, TG78, TG81 and TG84, Montreal, QC, Canada, 26–29 June 2012; 406–417.
- Ames, S. L., J. L. Grenard, Q. He, A. W. Stacy, S. W. Wong, L. Xiao, G. Xue, and A. Bechara. 2014. “Functional imaging of an alcohol‐Implicit Association Test (IAT).” Addiction Biology 19 (3): 467–481. https://doi.org/10.1111/adb.12071.
- Beattie, G., and L. McGuire. 2012. “See No Evil? Only Implicit Attitudes Predict Unconscious Eye Movements Towards Images of Climate Change.” Semiotica 2012 (192): 315–339. https://doi.org/10.1515/sem-2012-0066.
- Campisano, A., D. Butler, S. Ward, M. J. Burns, E. Friedler, K. DeBusk, L. N. Fisher-Jeffes, et al. 2017. “Urban Rainwater Harvesting Systems: Research, Implementation and Future Perspectives.” Water Research 115:195–209. https://doi.org/10.1016/j.watres.2017.02.056.
- Chenoweth, J., A. López-Avilés, S. Morse, and A. Druckman. 2016. “Water Consumption and Subjective Wellbeing: An Analysis of British Households.” Ecological Economics 130:186–194. https://doi.org/10.1016/j.ecolecon.2016.07.006.
- Cunningham, W., K. Preacher, and M. Banaji. 2001. “Implicit attitude measures: consistency, stability, and convergent validity.” Psychological Science 12:163–170. https://doi.org/10.1111/1467-9280.00328.
- de Sá Silva, A. C. R., A. M. Bimbato, J. A. P. Balestieri, and M. R. N. Vilanova. 2022. “Exploring Environmental, Economic and Social Aspects of Rainwater Harvesting Systems: A Review.” Sustainable Cities and Society 76:103475. https://doi.org/10.1016/j.scs.2021.103475.
- Eddington Cambridge n.d. Eddington Cambridge. Available at https://eddington-cambridge.co.uk. ( accessed 06.03.23).
- Egyir, S. N., C. Brown, and S. Arthur. 2016. “Rainwater as a Domestic Water Supplement in Scotland: Attitudes and Perceptions.” British Journal of Environment and Climate Change 6 (3): 160–169. https://doi.org/10.9734/BJECC/2016/23723.
- Fewkes, A. 2012. “A review of rainwater harvesting in the UK.” Structural Survey 30 (2): 174–194. https://doi.org/10.1108/02630801211228761.
- Fielding, K. S., J. Gardner, Z. Leviston, and J. Price. 2015. “Comparing Public Perceptions of Alternative Water Sources for Potable Use: The Case of Rainwater, Stormwater, Desalinated Water, and Recycled Water.” Water Resources Management 29:4501–4518. https://doi.org/10.1007/s11269-015-1072-1.
- Forterra n.d. Case Study Hanham Hall. Available at https://www.forterra.co.uk/case-studies/hanham-hall/. ( accessed 06.03.23).
- Fredenham, E., M. Longshaw, S. Ballinger, and S. Stephenson, (2020). Independent Review of the Costs and Benefits of Rainwater Harvesting and Grey Water Recycling Options in the UK. Final Report for Waterwise – WEStrategy002.
- Gattol, V., M. Sääksjärvi, and C. C. Carbon. 2011. “Extending the Implicit Association Test (IAT): Assessing Consumer Attitudes Based on Multi-Dimensional Implicit Associations.” PloS One 6 (1): e15849. https://doi.org/10.1371/journal.,pone.0015849.
- Greenwald, A. G., D. E. McGhee, and J. L. Schwartz. 1998. “Measuring individual differences in implicit cognition: the implicit association test.” Journal of Personality and Social Psychology 74 (6): 1464. https://doi.org/10.1037/0022-3514.74.6.1464.
- Gregg, A., and J. Klymowsky. 2013. “The Implicit Association Test in Market Research: Potentials and Pitfalls.” Psychology & Marketing 30 (7): 588–601. https://doi.org/10.1002/mar.20630.
- Hurlimann, A., and S. Dolnicar. 2016. “Public Acceptance and Perceptions of Alternative Water Sources: A Comparative Study in Nine Locations.” International Journal of Water Resources Development 32 (4): 650–673. https://doi.org/10.1080/07900627.2016.1143350.
- IPCC 2021 Summary for Policymakers. In: Climate Change 2021: The Physical Science Basis. Contribution of Working Group I to the Sixth Assessment Report of the Intergovernmental Panel on Climate Change (IPCC). Cambridge University Press.
- Lee, K. E., M. Mokhtar, M. M. Hanafiah, A. A. Halim, and J. Badusah. 2016. “Rainwater Harvesting as an Alternative Water Resource in Malaysia: Potential, Policies and Development.” Journal of Cleaner Production 126:218–222. https://doi.org/10.1016/j.jclepro.2016.03.060.
- Maison, D., A. G. Greenwald, and R. H. Bruin. 2004. “Predictive Validity of the Implicit Association Test in Studies of Brands, Consumer Attitudes, and Behavior.” Journal of Consumer Psychology 14 (4): 405–415. https://doi.org/10.1207/s15327663jcp1404_9.
- Meade, A. W. 2009. “FreeIat: An Open-Source Program to Administer the Implicit Association Test.” Applied Psychological Measurement 33:643–643. https://doi.org/10.1177/0146621608327803.
- O’Donnell, E., S. Maskrey, G. Everett, and J. Lamond. 2020. “Developing the Implicit Association Test to Uncover Hidden Preferences for Sustainable Drainage Systems.” Philosophical Transactions of the Royal Society A 378 (2168): 20190207. https://doi.org/10.1098/rsta.2019.0207.
- Parsons, D., S. Goodhew, A. Fewkes, and P. De Wilde. 2010. “The Perceived Barriers to the Inclusion of Rainwater Harvesting Systems by UK House Building Companies.” Urban Water Journal 7 (4): 257–265. https://doi.org/10.1080/1573062X.2010.500331.
- POST. 2000. “Water Efficiency in the Home.” In: Parliamentary Office of Science and Technology Note 135. London: Parliamentary Office of Science and Technology. https://post.parliament.uk/research-briefings/post-pn-135/.
- Quinn, R., P. Melville-Shreeve, D. Butler, and V. Stovin. 2020. “A Critical Evaluation of the Water Supply and Stormwater Management Performance of Retrofittable Domestic Rainwater Harvesting Systems.” Water 12 (4): 1184. https://doi.org/10.3390/w12041184.
- Reed, K., n.d. North West Bicester Eco Town: Rainwater Harvesting and SuDs. Available at https://twenty65.ac.uk/files/vajkeuq2ifqg8x7tmgni/Bicester.pdf. ( accessed 06.03.23).
- Riebel, K., B. Egloff, and M. Witthöft. 2013. “The Implicit Health-Related Self-Concept in Somatoform Disorders.” Journal of Behavior Therapy and Experimental Psychiatry 44 (3): 335–342. https://doi.org/10.1016/j.jbtep.2013.02.001.
- Schultz, P. W., C. Shriver, J. J. Tabanico, and A. M. Khazian. 2004. “Implicit Connections with Nature.” Journal of Environmental Psychology 24 (1): 31–42. https://doi.org/10.1016/S0272-4944(03)00022-7.
- Staddon, C., J. Rogers, C. Warriner, S. Ward, and W. Powell. 2018. “Why Doesn’t Every Family Practice Rainwater Harvesting? Factors That Affect the Decision to Adopt Rainwater Harvesting as a Household Water Security Strategy in Central Uganda.” Water International 43 (8): 1114–1135. https://doi.org/10.1080/02508060.2018.1535417.
- Suwartono, C., E. A. Meinarno, and G. Bawono. 2017. “Development of the National Identity Measurement Using the Implicit Association Test Method.” ANIMA Indonesian Psychological Journal 32 (2): 76–89. https://doi.org/10.24123/aipj.v32i2.586.
- UKGBC (UK Green Building Council) 2023 Case Study: Elsbrook. Available at https://www.ukgbc.org/solutions/case-study-elmsbrook/. ( last accessed 06.03.23).
- Ward, S., S. Barr, F. Memon, and D. Butler. 2013. “Rainwater Harvesting in the UK: Exploring Water-User Perceptions.” Urban Water Journal 10 (2): 112–126. https://doi.org/10.1080/1573062X.2012.709256.
- Ward, S., D. Butler, and F. Memon, (2008). A Pilot Study into Attitudes Towards and Perceptions of Rainwater Harvesting in the UK. BHS 10th National Hydrology Symposium, Exeter. UK (2008).
- Way, C. M., D. B. Martinson, S. E. Heslop, and R. S. Cooke. 2010. “Rainwater Harvesting: Environmentally Beneficial for the UK?” Water Science and Technology: Water Supply 10 (5): 776–782. https://doi.org/10.2166/ws.2010.189.
- White, M., A. Smith, K. Humphryes, S. Pahl, D. Snelling, and M. Depledge. 2010. “Blue Space: The Importance of Water for Preference, Affect, and Restorativeness Ratings of Natural and Built Scenes.” Journal of Environmental Psychology 30:482–493. https://doi.org/10.1016/j.jenvp.2010.04.004.
- Zhang, F., M. Polyakov, J. Fogarty, and D. J. Pannell. 2015. “The Capitalized Value of Rainwater Tanks in the Property Market of Perth, Australia.” Canadian Journal of Fisheries and Aquatic Sciences 522:317–325. https://doi.org/10.1016/j.jhydrol.2014.12.048.