
Abstract
This article highlights recent developments in flood risk management in the Netherlands and presents approaches for reliability analysis and asset management for flood defences and hydraulic infrastructure. The functioning of this infrastructure is of great importance for the country as large parts of it are prone to flooding. Based on a nationwide flood risk assessment, new safety standards for flood defences have been derived in the form of maximal acceptable failure probabilities. A framework for the reliability-based analysis of the performance of hydraulic infrastructure is introduced. Within this context, various challenges are discussed, such as the dynamic nature of loads, resistance and reliability requirements over time. Various case studies are presented to highlight advances and challenges in various application fields. The first case illustrates how structural health monitoring contributes to a better characterisation of the reliability of the defences and how innovative measures can enhance the reliability. The second case discusses how the river system can be managed in the context of the new safety standards. The third case shows how upgrades and reinforcements of hydraulic structures can be evaluated taking into account (uncertain) future developments, such as sea level rise.
1. Introduction
Large parts of the Netherlands are at risk from coastal and river floods. These flood prone areas are protected by a system of flood defences consisting of dikes, dunes and storm surge barriers. The management, maintenance and reinforcement of this system require continuous attention and knowledge development. In addition, several other types of hydraulic infrastructure are present in the country, such as sluices and gates for purposes of navigation and water management. In many cases, these structures are ageing and need to be changed or upgraded to account for new (safety) standards and changing requirements related to reliability and availability. In addition, demands on the infrastructure are changing, e.g. due to expected sea level rise, more stringent standards and/or more intense use.
The aim of this paper is to provide an overview of recent developments in the flood risk management in the Netherlands and approaches for reliability analysis and asset for flood defences and hydraulic infrastructure. The article will present approaches developed for flood defences (dikes, dams and barriers) and other hydraulic structures along the rivers and coast. The focus is on aspects related to risk- and reliability-based management of these systems. Risk refers to the combination of probabilities and consequences of a set of undesired events (following the definition of Kaplan and Garrick (Citation1991)). Reliability refers to the likelihood that a system will fulfil its functions for a specified time. A directly related concept also used in this article is the probability of failure, which is generally expressed per unit of time, for example per year.
The article is structured as follows. Section 2 will provide an overview of the various application fields (flood defences and other hydraulic structures) and highlight a number of developments and challenges. Section 3 introduces a general framework for the consideration of the reliability of hydraulic infrastructure throughout the life time and discusses a number of specific issues in the Dutch field. Section 4 presents three illustrative case studies focusing on reinforcement of flood defences, implementation of nature-based approaches for river management, and optimisation of the expansion of a large hydraulic structure. Finally, Section 5 gives some closing remarks.
2. Developments in flood management in the Netherlands
This section gives an overview of recent advances in flood risk management in the Netherlands and challenges in the management of hydraulic structures. Parts of this section are based on (Jonkman & Schweckendiek, Citation2015).
2.1. Overview of the flood defence system and background
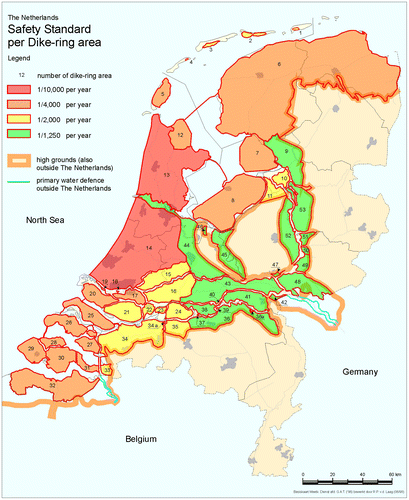
The issue of flood risk management is of particular importance for the Netherlands, since most of the country is prone to flooding and protected by a system of primary flood defences of a length of almost 3800 km, see Figure for an overview of primary defences and the (now old) standards that have been used until the year 2016. These defences consist of earthen dikes (levees), dunes, dams and storm surge barriers. The old standards were formulated in terms of a probability of exceedance of hydraulic load conditions (water levels, waves) that a flood defence should be able to withstand safely.
Figure 1. Overview of flood defences and old safety standards used until the year 2016. Source: Public information from the Dutch government (Rijkswaterstaat).
Over the past decades significant progress has been made in developing methods for risk and reliability analysis for flood defence systems in the Netherlands (Jongejan & Maaskant, Citation2015; Vrijling, Citation2001). Recently, the results of a nationwide flood risk analysis have been published providing detailed insights in failure probabilities, consequences and risk levels for all major flood prone areas (Rijkswaterstaat, Citation2015; – also see next section). The nationwide risk assessments have been used as a basis for the recent decision of the Dutch government to adopt new safety standards in the form of a maximal acceptable failure probability for a reach of flood defences. The following sections provide background on the flood risk assessment and the new safety standards.
2.2. Flood risk analysis
The aim of a flood risk analysis is to assess the probabilities and consequences of flooding as a basis for risk evaluation and decision-making. In the Netherlands a nationwide flood risk analysis has been performed for all primary flood defences along the coasts, rivers and lakes in the project VNK (Veiligheid Nederland in Kaart) (VNK, Citation2014). The approach follows the following five steps:
| (1) | Flood hazard analysis: determination of frequencies of hydraulic loads. The frequencies of hydraulic loads, such as water levels and waves are assessed by means of statistical analysis and hydraulic modelling. | ||||
| (2) | Reliability analysis of the flood defence system: Determination of the initiation of a failure mechanism. Various failure mechanisms are taken into account, such as instability, piping or overtopping. | ||||
| (3) | Breaching analysis and hydrodynamic simulation of flood scenarios: the development of breach(es) after occurrence of the initial failure mechanism (step 2) and overland flow by means of 2D hydrodynamic models. | ||||
| (4) | Damage and life loss estimation: damages are assessed as a function of local flood conditions and land use and stage damage functions are utilised (Jonkman, Bočkarjova, Kok, & Bernardini, Citation2008). A similar approach is used for the analysis of potential loss of life, also taking into account possibilities for shelter and evacuation. | ||||
| (5) | Risk quantification and mapping using different risk metrics (see below). | ||||
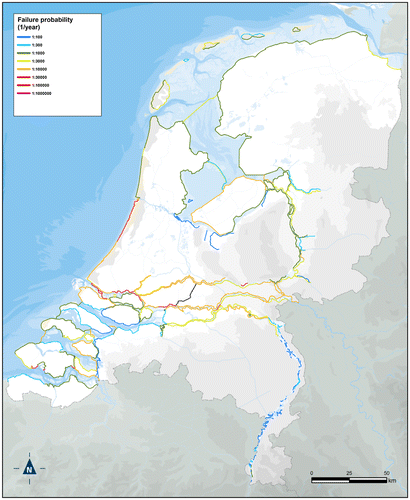
Figure illustrates an example of the results for the flood protection system (dike ring) ‘Land van Heusden/de Maaskant’, in the south-east of the country bordering the river Meuse. The population is about 420,000 inhabitants and the area contains cities such as Oss and ‘s-Hertogenbosch. The total length of flood defences is about 100 km and the area 66,600 ha. Analysis of the failure probability leads to an estimate of the probability of flooding of more than 1/100 per year. Figure contains the failure probability estimates of the individual dike sections. The main threat is the piping failure mechanism (backward internal erosion), which contributes to 80% of the failure probability. The second largest contribution (15%) stems from hydraulic structures located in the defence line. It should be noted that the outcomes should not be considered as absolute values, but they provide insight in relatively weak links, the most important mechanisms and areas with higher risks. Moreover, the risk estimates are dependent on the physical models that are implemented. For example, a somewhat conservative approach is used to assess the failure mechanism of piping, thus explaining part of the relatively high failure probabilities presented above.
Figure 2. Failure probabilities of dike sections in ‘Land van Heusden/de Maaskant’ (VNK, Citation2014). Source: Public information from the Dutch government (Rijkswaterstaat).

By combining the computed failure probabilities with flood scenarios, damage and life loss assessments, risk levels can be determined and expressed in various ways. Economic risk can be used to express the likelihood of economic damages. Societal risk is generally expressed by means of a so-called FN-curve. It shows the probability of exceedance of events (F) with certain numbers of fatalities (N). A third risk metric is the individual risk (IR): the annual probability of being killed by a flood at a certain location, including the effects of evacuation.
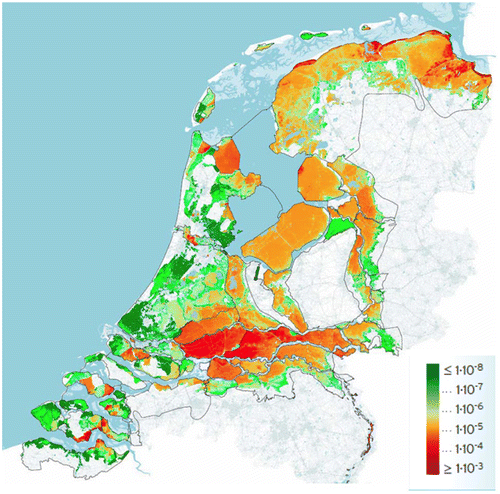
Figure depicts a nationwide estimate of the individual risk level with the current state of the flood defences. It shows that large parts of the country, the areas in orange, are characterised by IR levels higher than 10−5 per year. This is mainly due to the fact that the estimated failure probabilities of the defences along the main rivers are estimated to be rather high (in the order of magnitude of 1/100 per year especially due to the influence of geotechnical failure mechanisms).
Figure 3. Estimated individual risk for flooding for the Netherlands (Rijkswaterstaat, Citation2015). Source: Public information from the Dutch government (Rijkswaterstaat).
2.3. New risk-based safety standards
2.3.1. Background: old vs. new standards
The previous (or old) standards for flood defences have been in formulated in terms of a probability of exceedance of hydraulic load conditions (water levels, waves) that a flood defence should be able to withstand safely. This is in essence an approach based on design loads. The standards differ between areas. For example, the flood defences in the densely populated dike ring of South Holland along the Dutch coast have a safety standard of 1/10,000 per year. For other areas with somewhat lower potential damages, safety standards range from 1/1250 per year to 1/4000 per year. Some smaller dike rings along the river Meuse have safety standards of 1/250 per year (not shown in Figure ). These standards were derived several decades ago and mostly refer to the frequency of the design load conditions.
The Dutch government has proposed new safety standards in the form of acceptable failure probabilities for sections of flood defences. The change has been motivated by two main reasons. Firstly, the protected values and size of the population in the flood prone areas has grown rapidly. Secondly, new insights in failure mechanisms and failure probabilities of flood defences have been obtained in the studies on flood risk and levee reliability from the past decades (see previous sections).
2.3.2. Acceptable risk
These new standards have been derived in a risk-informed way, i.e. outcomes of the nationwide flood risk assessment (see Section 2.2) have been used to determine the new safety standards. These refer to an acceptable failure probability (or equivalent reliability). The values of the new standards have been chosen such that the risk levels would become acceptable and the policy analysis has taken place as part of the Dutch Delta Program (Citation2014). Three criteria have been considered (Jonkman, Jongejan, & Maaskant, Citation2011; Vrijling, van Hengel, & Houben, Citation1998):
| • | Individual risk: the government has proposed that areas with individual risks higher than 10−5 per year are insufficiently safe. For these areas dike higher safety standards and thus reinforcements are required (or other forms of risk reduction). | ||||
| • | Societal risk: no explicit limits (FN limit lines) have been proposed. Alternatively, it was investigated which areas have the highest contribution to the societal risk at the national level. For the systems with the highest contribution to societal risk at a national level, a somewhat higher protection level was proposed. | ||||
| • | Economic risk/cost benefit analysis: For every flood protection system, an optimal level of protection was determined (Deltares, Citation2014; Eijgenraam, Citation2006). This approach takes into account the increasing reinforcement costs and decreasing risk as a function of the failure probability. Since both costs and risks are expressed in monetary terms, an optimum can be determined where the sum of the two is minimal. | ||||
2.3.3. New safety standards
The resulting new safety standards are shown in Figure . A first major change is that these standards refer to the maximal acceptable failure probability of a flood defence system, whereas the old standards referred to the probability of exceedance of design loads. This implies that for the new standards multiple failure mechanisms and the contribution of multiple elements and dike sections within a system need to be incorporated in the design and safety assessment. The second change concerns the protection levels and distribution over the country. In the old safety standards the highest protection levels were found in the west of the country (1/10,000 per year for South Holland). In the new safety standards high protection levels are also assigned to riverine areas. One may argue that the recent insights from reliability and risk analyses have led to more attention being paid to flood risk originating from the large rivers compared to the last decades where the focus was on coastal flooding after the 1953 coastal flood disaster.
Figure 4. New safety standards for flood defences in the Netherlands, in the form of maximal acceptable failure probabilities (Ministerie van Infrastructuur en Milieu, Citation2016a). Source: Public information from the Dutch government (Rijkswaterstaat).
In the coming years, these new safety standards will be incorporated in dike reinforcements and safety assessments. One important question that has received limited attention is how these new standards can be met through dike reinforcements and other system interventions. For the purposes of design and safety assessment of levees, it will be necessary to relate the target failure probabilities to design properties of the flood defence (e.g. height, width, etc.). Therefore, a conversion of the standards (failure probabilities) into (semi-probabilistic) design codes and rules for various (geotechnical) failure mechanisms is needed. For this purpose, the distribution of target failure probability over various mechanisms and over the length of the system needs to be considered. The latter so-called length-effect is the phenomenon that the probability of failure of a statistically homogeneous dike section grows with its length (see also Schweckendiek, Vrouwenvelder, Calle, Jongejan, & Kanning, Citation2013). The explanation is that with variable ground conditions, the probability of encountering a weak spot becomes larger if a longer section is considered. Finally, generically applicable partial safety factors need to be derived by means of calibration studies. These need to ensure that a design meeting the semi-probabilistic requirements using these factors is at least as safe as the required target probability. Schweckendiek (Citation2013) and Jonkman and Schweckendiek (Citation2015) provide further information on the derivation of design codes and partial safety factors.
The challenges for implementation include the reinforcement of a large number of dikes based on the new probabilistic requirements. Additionally, new strategies, such as nature-based solutions are gaining increasing attention. Examples are large-scale nourishments along the coast (e.g. the sand engine) and the room for rivers programme. These nature-based solutions are more dynamic with respect to their performance and development over time and are thereby characterised by larger uncertainties than typical structural solutions. This may hamper acceptance amongst end users and therefore hinder inclusion of nature-based solutions in the national flood protection programme, therefore, it is important to assess and incorporate these types of solutions in the new probabilistic framework for flood risk management. See Sections 3 and 4 for a further discussion of challenges and examples.
2.4. Hydraulic structures
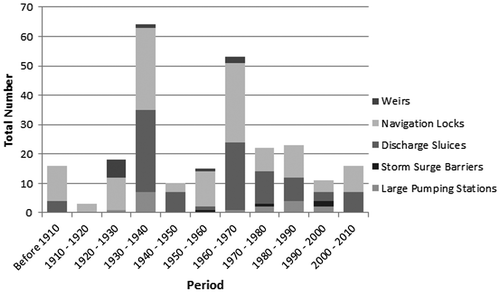
Several hydraulic structures are part of the flood defence system (e.g. dams), the water management system (e.g. weirs) and the navigation system (e.g. sluices). Many of these structures have multiple functions. For example, a sluice could also be part of the flood defence system. A large part of this infrastructure has been constructed in the 1930s and after the Second World War (see Figure ). Over the last decade two types of challenges have become emergent. Firstly, many structures are close to the end of the technical or functional lifetime. One of the key challenges concerns the renewal, adaptation or upgrade of these structures. In these upgrades future requirements (e.g. new safety standards) and other demands (e.g. increasing discharge volumes or increase of shipping traffic) have to be considered.
Figure 5. Construction year of various hydraulic structures in the Netherlands (source: Rijkswaterstaat).
A second challenge concerns the management and maintenance of existing structures. Especially in the field of storm surge barriers, some events and incidents have raised attention for management and maintenance aspects. For example, in the year 2013 it appeared that the bottom protection to prevent scour near the Easter Scheldt barrier (a storm surge barrier in the Southwest of the country) was eroding, whereas this was not noticed by the local management organisation. Also, the reliability of the Maeslant barrier near Rotterdam appeared somewhat lower than expected, and this resulted in the consideration of upgrades and reinforcements of flood defences behind the barrier. Events like these have demonstrated the complexity of the operation of these complex structures. Probabilistic models could also assist to optimise management and maintenance, see e.g. Willems and Webbers (Citation2003).
3. Framework for reliability-based analysis of the performance of hydraulic infrastructure
3.1. General description
This section discusses a general framework for the consideration of the reliability of hydraulic infrastructure throughout the lifetime and introduces a number of specific issues in the Dutch practice in hydraulic engineering. The previous section has described how – based on risk assessment – new safety standards in the form of an acceptable failure probability (or equivalent reliability) have been defined. The standards will form the basis for management of the hydraulic infrastructure in the coming decades. Depending on the type of hydraulic infrastructure under consideration, different types of limit states for various functions can be defined. For example, breaching is the crucial limit state for flood defences. For other hydraulic structures the key requirement can also refer to another function, such as the available discharge capacity of a discharge sluice or the availability of a navigation lock.
Once an acceptable failure probability or equivalent target reliability (β) is known for a certain function, the challenge is to characterise uncertainties in resistance (R) and load (S) and their development over time. The ‘classical’ Figure illustrates the development of strength and load over time. In order to estimate reliability and optimise interventions a thorough understanding of these uncertainties, their development in time and their reducibility is necessary (Kiureghian & Ditlevsen, Citation2009).
Figure 6. Schematic development of strength and load over time.
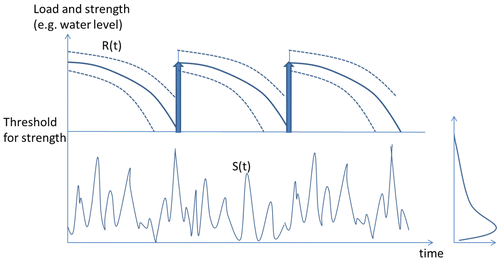
The loads (e.g. water levels) fluctuate over time and they are characterised by a probability density function. The strength of the system is assumed to decrease over time, due to various degradation processes. Examples are the subsidence of a flood defence, leading to an increased probability of failure due to overtopping, or ageing of a navigation lock – leading to a reduction of availability.
The above framework is well known and used for various applications in civil engineering, for example for highway bridges (Frangopol, Kong, & Gharaibeh, Citation2001), but has been applied to a limited extent for the management of hydraulic infrastructure. However, Figure is simplified. A number of general challenges are discussed below, exemplified by means of examples in the focal field of this paper.
3.2. Changes in target reliability values and thresholds
In Figure a threshold value for the strength is indicated. As long as the actual strength of the system is higher than the threshold, it can be assumed that the reliability is sufficient. In the figure, it is assumed that the threshold value for strength does not change over time. In case of changes in load conditions, or increasing risk values over time, a dynamic or moving threshold value will apply. For example, a flood defence will have to be heightened to account for sea level rise. Moreover, if the economic values in the protected increase over time, the reliability will have to be increased over time to compensate for the increase in damages.
In such cases a dynamic optimisation model with changing requirements over time can be implemented, see e.g. Eijgenraam (Citation2006) and Kind (Citation2014) for the case of the Dutch flood defences under sea level rise and economic growth. The optimal failure probability will decrease over time due as economic growth leads to an increase of the potential damage. Also, decision-makers may change target reliability levels at certain points in time, for example when new insights in risk levels are available or when accidents or disasters occur and policies are modified. This could lead to sudden jumps in the target reliability and changes to the requirements of the infrastructure under consideration.
3.3. Changes in strength
Several factors could lead to uncertainties in strength, both at the present time as well as in the future (see dashed lines in Figure ). In the field of flood risk management models for the geotechnical failure mechanisms (e.g. stability and piping) are inherently uncertain. Moreover, there is limited information, e.g. a limited sample of soil borings, to characterise the strength. Health monitoring, and reliability-based updating can be used to improve the characterisation (see below). In addition, the effect of interventions affecting strength could be uncertain, especially for innovative measures (measures that are not widely used yet such as a geotextile screen to prevent piping) for which limited empirical evidence and modelling tools are available. Finally, the future development of the resistance over time will be uncertain and will depend on several degradation processes. An example is the future development of the strength of a dike for overtopping. The strength is dependent on the rate of subsidence (which lowers the dike) and the degradation of the quality of grass cover over time (which leads to a lower tolerable overtopping discharge).
3.4. Changes in loads
Loads are generally inherently uncertain and can be described by means of a statistical distribution. Over time, there can be longer term trends that change these load distributions, e.g. sea level rise can increase the loads on flood defences, and reduce capacity of discharge sluices on the coast. In addition, changes in transportation intensity over time could affect the demand for the use of a navigation sluice. The occurrence of extreme events could lead to updates of the statistical distribution of loads. For example, after high discharges in the river Rhine in 1993 and 1995, the statistical distribution function was updated and the design discharge corresponding to the 1250 year return period was suddenly increased. Note that also in the field of strength, sudden ‘jumps’ can occur, for example when a new strength model is adopted to reflect a change in the engineer’s assessment of strength. In these cases further research can be commissioned to reduce the uncertainties in the modelling. Finally, changes in other parts of the infrastructure system could affect loads in other parts of the system. For example, a change in the operation of a storm surge barrier will affect the (distribution of) loads on the dikes behind the barrier. Also, changes in the transportation infrastructure, such as the construction of a new canal or road, could affect demands and corresponding loads in other parts of the system. Consideration of loads in a time-dependent systems perspective is therefore necessary.
3.5. Implementation in the Netherlands
The above elaboration highlights a number of generic challenges in the field of hydraulic infrastructure in the Netherlands. In recent years a number of techniques have been developed to address some of these challenges in these fields. These will contribute to a better characterisation of reliability and the formulation of more effective interventions. Examples of relevant developments include:
| • | Several techniques have been developed to characterise strength and reliability of flood defences. Structural health monitoring and reliability-based updating could lead to a better assessment of existing systems (Schweckendiek, Vrouwenvelder, & Calle, Citation2014). Probabilistic techniques can also be used to assess the contribution to safety of innovative interventions that have not been tested previously (Klerk et al., Citation2017). Moreover, full probabilistic and semi-probabilistic guidelines are under development for the design and safety assessment of defences based on the new safety standards (Slomp et al, Citation2016). | ||||
| • | There is a growing attention for nature-based solutions in the field of flood management (van Slobbe et al., Citation2013). These include sand nourishments along the coast, the use of foreshores for flood defences, and ‘room for river’ interventions to increase nature values and discharge capacity. In general, nature based has a more dynamic and therefore uncertain nature than structural interventions. This may hamper acceptance amongst end users and therefore hinder inclusion of nature-based solutions in the national flood protection programme. In recent years progress has been made in characterising the effects of nature-based interventions on safety in a probabilistic framework (Vuik, Jonkman, Borsje, & Suzuki, Citation2016). This will allow a direct assessment of the contribution of nature-based solutions to reducing the failure probability and meeting the new (probabilistic) safety standards. | ||||
| • | There is a growing attention for probabilistic management and maintenance of hydraulic structures, such as storm surge barriers, sluices and dams (Willems & Webbers, Citation2003). Probabilistic models have been developed for management and maintenance. When upgrades of large structures are required, an optimisation based on life cycle costs can lead to the selection of a ‘future proof’ strategy – see the example of the Afsluitdijk (closure dam) in the next section of this paper and Voortman et al., (Citation2017). | ||||
4. Case studies
This section will highlight a number of cases that show how specific challenges are addressed for various application fields in hydraulic engineering and flood protection. The first two cases concern dike reinforcements (4.1) and river management (4.2) and will show how reliability-based concepts are implemented. The third case (4.3) will highlight how upgrades of large hydraulic structures are assessed.
4.1. Dike reinforcements
Due to the change in safety standards and new insights in geotechnical failure mechanisms such as slope stability and piping, a large number of dikes in the Netherlands have to be reinforced before 2050. As large parts of the Netherlands are densely populated, reinforcement projects are complex, resulting in high reinforcement costs per km, ranging up to 15 to 20 M€/km for the more complex projects. The Dutch Flood Protection Program aims to reduce these costs to around 6 M€/km. For this purpose, investments are made in (applied) research to reduce uncertainties, promote innovative techniques for reinforcements, and developed reliability-based asset management.
An example of a field that has received increasing attention is the development and application of structural health monitoring of dikes, for instance by infrared cameras for detecting seepage or monitoring of hydraulic heads to improve reliability estimates for slope stability (Klerk et al., Citation2017). An example is the LiveDijk XL project (Nieuwenhuis et al., Citation2016), where for a duration of 3 years different types of monitoring instruments as well as full-scale tests were executed, resulting in an estimated saving of 40% in reinforcement costs. This form of structural health monitoring helped to increase the insight in the strength of the flood defences by a better characterisation of the phreatic lines and the effect on failure mechanisms such as piping and instability. Furthermore, the associated uncertainties will be reduced by better knowledge, leading to a better assessment of reliability and – in many cases – to a less conservative and costly reinforcement.
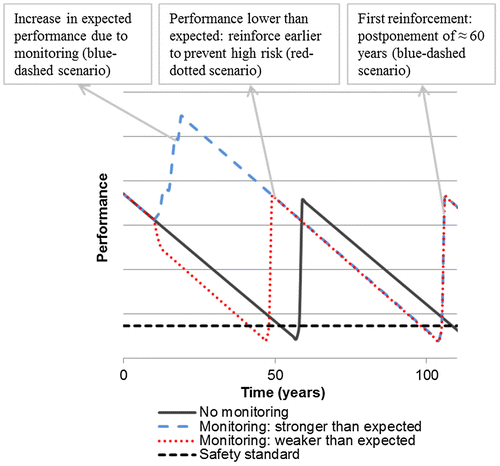
Information is also available from actual performance observations, Schweckendiek et al. (Citation2014) show that reliability updating using survived extreme events can also yield significant increases in reliability estimates, resulting in a reduction of the scope and size of reinforcement projects. However, there is a major challenge in this topic: as safety standards are very stringent it is hard to get an actual stress test with very high loads which gives actual information about the Ultimate Limit State (ULS) of the flood defence. For instance, in the case studied by Klerk et al. (Citation2017) for a dike in the north of the Netherlands, a very high water level was observed, providing a wealth of information. When putting this into perspective, this would be represented by the red line in Figure , where an observation results in a sudden increase in performance (or decrease, represented by the grey line). However, the return on investment in such cases is highly dependent on the observed loads, and is often small for situations with high variability of loads. In order to depend less on the variability of the loads that are given by nature, research is on-going into how to do stress tests on levees in circumstances close to their (required) ULS. In principle, this concerns an application of the observational method (Peck, Citation1969) to levees. It is expected to yield benefit to the practice of levee design, particularly due to the large uncertainties and stringent reliability requirements.
Figure 7. Influence of structural health monitoring on performance estimates.
In some cases the observed loads and ULS conditions are much closer to each other than in other cases, so historical loads might yield useful information. A case with high potential is for regional levees along canals, where extreme and daily circumstances are fairly similar. Roscoe (Citation2017) showed that for such a case, using survival observations from historic data, for a regional levee system estimated failure probabilities dropped by more than a factor 100. However, for primary flood defences such observations close the ULS are rare. In these cases controlled stress tests can contribute insights.
A second major development is the introduction of new innovative techniques for reinforcements. These are mostly aimed at reducing the probability of geotechnical failure mechanisms such as slope stability and piping. Examples are a vertical geotextile to prevent piping and various methods to control and lower the level of the phreatic line (i.e. water level) inside the levee, such as relief wells (Miranda, Teixeira, Huber, & Schweckendiek, Citation2014) and the DMC system discussed below. However, as the performance of such measures is uncertain, often a conservative approach is taken when determining their effectiveness, which hampers their implementation.
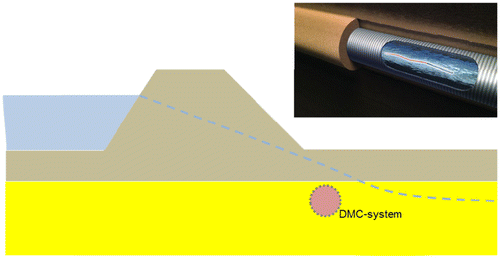
An example of such a measure is the DMC-system (Dike Monitoring and Conditioning system). The DMC-system is designed as a measure against slope stability and piping. It can replace a conventional earthen berm as a measure, thus preventing removal of houses as part of the reinforcement. The DMC-system consists of a fibreglass cable surrounded with a sandy core and connected to a pump which is inserted in the aquifer relevant for failures, see Figure . It monitors and controls phreatic levels by inserting or extracting water, thus reducing the probability of failure for geohydraulic failure mechanisms, in this case piping. In the assessment of the reliability, the likelihood of failure of the DMC system has to be considered. The total failure probability of the system can be calculated as:(1)
Figure 8. Schematic representation of a DMC-system as a piping measure: it is located in the aquifer where it can influence piezometric levels.
where P(F) is the probability of failure of the dike [–/year] which is determined by combinations of the failure probability of the DMC-system and the levee given that the DMC-system functions or not.
As part of the conventional design process for the reinforcement various conservative assumptions are applied. Firstly, it is assumed that the DMC-system has to be active to control the water level, meaning that the failure probability is determined by, amongst others, the failure probability of the pumps. However, in this case, the DMC-system was designed in such a way that it can also passively (i.e. without pumping) guarantee a sufficiently low phreatic level. Every month the system is tested with a pump test, meaning that the reliability of the pump can be frequently evaluated. The replacement time of a pump is estimated at 4 h, which is much shorter than the lead time of a high river discharge, which is in the order of 5 days. Another failure mechanism is that the sandy core can be clogged by siltation, reducing the discharge capacity. However, revitalisation of the sandy core can take place in less than 2 days, which is also less than the lead time. The cost-effectiveness of the DMC-system can be evaluated by comparing the Net Present Value (NPV) for a given time period to the NPV of a reinforcement with a conventional earthen berm. The NPV consists, in this case, of the total costs and risks (expected yearly damage) over the considered period. Figure illustrates the influence of the assumption for the failure probability of the DMC-system (i.e. P(DMC fails)). It shows the cumulative Net Present Value of total costs (i.e. sum of discounted costs and annual risk) over 200 years for a dike section of 150 m where the DMC-system is used, compared to a case where a conventional earthen berm is used. The total costs for the DMC system are lower (and thus better) than for the conventional reinforcement for small failure probabilities of the DMC system.
Figure 9. Net present value for a conventional earthen berm (red) and a DMC-system (black) with different values of P(DMC fails).
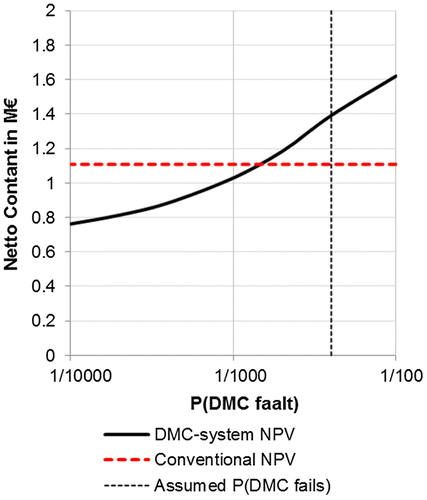
The assumed failure probability for the DMC-system is 1/250 per demand. For that failure probability the conventional reinforcement is cheaper in the long term. However, if the failure probability of the DMC-system is lower, which is likely given the aforementioned factors, the economic feasibility of the DMC-system also increases.
The above example is one case in which a new technique has been applied. A more advanced reliability analysis showed that the effectiveness of the DMC system was likely underestimated in the initial design. In order to reduce the reinforcement costs of the Dutch Flood Protection Program more types of innovative interventions are explored, such as the application of structural anchors for dike stabilisation and the inclusion of nature-based solutions.
The main challenge is to estimate costs and benefits for measures with large uncertainties. By dealing with these innovative solutions at the national level in a portfolio-based approach, the knowledge generated can be shared amongst different users. In addition, the risks of unsuccessful (and thus costly) interventions risks are spread across the programme.
4.2. River management
4.2.1. River maintenance in the present situation
River maintenance is aimed to keep the river system functional and in compliance with laws and regulations. River maintenance activities, such as the management of sediment and floodplain vegetation, are however costly. The flood conveyance function can deteriorate over time as vegetation will grow and channels will gradually silt up. Without proper maintenance, these processes may eventually result in an increase of flood risks.
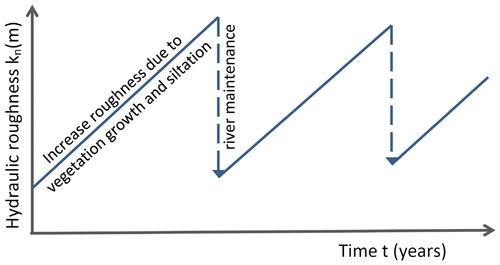
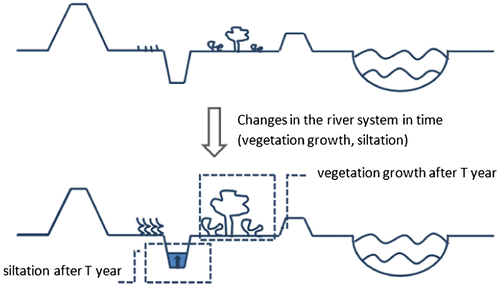
Maintenance in the rivers Rhine and Meuse in the Netherlands has become an increasingly important concern in recent years and several guidelines have been published (Ministerie van Verkeer en Waterstaat, Citation2016b; Rijkswaterstaat Water, Verkeer en Leefomgeving, Citation2017). Traditionally, the floodplains along the Rhine and Meuse have been used as farmlands. The decline of the agricultural function of the floodplains in exchange for more nature has changed the appearance of the floodplains in the last decades. After implementation of the landscaping projects in the context of Room for the River and the Water Framework Directive even more farmland will be replaced for native vegetation in the coming decades. This new form of meadow vegetation causes an increase of the hydraulic roughness (usually expressed with Manning’s coefficient n [s/(m1/3)]) (see Figure ). This may result in an increase of flood levels.
Figure 10. Hydraulic roughness increases in time as vegetation will grow and channels will gradually silt up. By removal of vegetation and/or sediment the hydraulic increase of the hydraulic roughness will be counterbalanced.
In addition to changes to floodplain vegetation, the river itself will be widened through the construction of side channels and other interventions. Siltation of these side channels may also exacerbate flood levels. The above processes will lead to an increase of design water levels that correspond to the (old) safety standards. These refer to the probability of exceedance of hydraulic load conditions (water levels, waves) that a flood defence should be able to withstand safely (see Section 2). Rijkswaterstaat, as part of the Dutch Ministry of Infrastructure and Environment, has the responsibility to maintain the river in such a way that the design water levels do not increase.
On yearly basis the actual state of the river system is monitored (Figure ), after which an assessment of the design water levels takes place. If the hydraulic roughness has increased, design water levels will also increase and removal of vegetation and/or sediment will take place to counterbalance the negative impacts.
Figure 11. Changes in the river system in time due to vegetation growth and siltation of side channels.
4.2.2. Towards new safety standards
The safety standards for flood defences in the Netherlands have been revised recently (see Section 2) and – as of the year 2016 – are expressed as an acceptable probability of flooding (see Section 2). As a consequence of change from (old) safety standards based on a certain probability of exceedance of water levels to (new) safety standards based on a probability of flooding, the design water levels may become less important. Another complicating factor is the fact that there is a strong spatial differentiation in new safety standards: The values for the flood defences along the rivers range between 1/300 and 1/30,000 per year (see also Figure ).
In the new approach, one should account for the fact that flooding cannot only occur due to overflow and wave overtopping (here indicated as overflow), but also due to other failure mechanisms, such as instability and piping. The probability of failure for each dike failure mechanism can be determined using: (1) the probability density function (pdf) of water levels, describing the probability that a certain water level occurs, and (2) the conditional probability of failure given a water level (a so-called fragility curve). If both are integrated over the whole range of water levels, the total probability of failure results. The figures below illustrate the assessment of the probability of failure for the failure mechanisms of overflow (Figure ) and piping (Figure ). Both figures also illustrate the impact of an increase of the water level over the entire range of water levels and discharges, due to growth of vegetation growth and siltation processes in the flood plains. These processes will leads to a shift of the pdf of loads to the right.
Figure 12. Probability of failure for failure mechanism overflow and the impact of an increase of water levels due to the growth of vegetation and siltation processes in the flood plains.
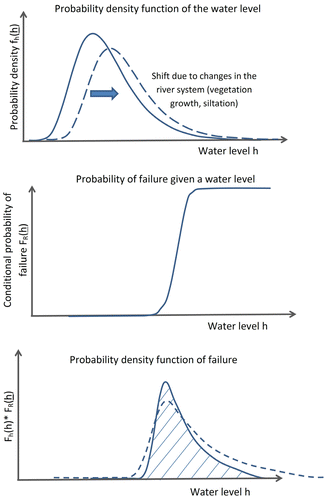
Figure 13. Probability of failure for the failure mechanism of piping and the impact of an increase of water levels due to growth of vegetation and siltation processes in the flood plains.
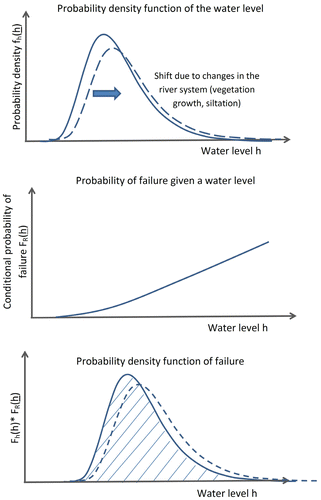
The figures show that the most likely conditions under which failure occurs (also referred to as the design point) differ between the failure mechanisms. For the mechanism of overflow, failure is most likely for water levels approaching the crest level. For piping (and other geotechnical failure mechanisms such as instability) failure most likely occurs at lower water levels. This implies that multiple discharge and water levels contribute to the probability of flooding. If river interventions or deterioration processes do not affect design water levels, but only the water levels at lower discharges, these may nevertheless be a negative effect on the probability of failure.
Figures and also illustrate the impact of changes in the river system (for instance growth of vegetation and siltation of side channels) on the probability density functions of failure. For the mechanism of overflow the peak of probability density function of failure (indicating the hydraulic loads most important to the occurrence of failure) is not expected to change much. For the mechanism of piping, the peak of pdf of failure will shift to the right side, indicating that higher water levels will have a larger contribution to the probability of failure (Figure ).
4.2.3. Revision of the river maintenance practice in light of new safety standards
The current river maintenance practice has a strong focus on design water levels and thus mostly on the failure mechanism of overflow. In the new approach for safety standards, the impact of new land use developments and deterioration processes, such as changes in floodplain vegetation and silting of side channels, should be considered with respect to their impact on the overall probability of failure of river dikes. A revision of the current river maintenance practice is required.
Rijkswaterstaat will define new rules and guidelines to properly deal with new river interventions and deterioration processes in the Dutch river system (Rijkswaterstaat, Citation2017). The development of these new rules and guidelines is in progress. There is a strong wish to keep the assessment of the impact of river interventions and other changes in the river system (vegetation growth and siltation) on hydraulic conditions simple and easy-to-explain. The question is how future river interventions and deterioration processes should be evaluated with respect to their effect on flood risks. Two main alternatives can be distinguished:
| (1) | Evaluation based on design water levels. Interventions and deterioration processes are not allowed to induce an increase of the water levels during these conditions. This results in one or a few reference water level line(s). | ||||
| (2) | Evaluation based on the impact of the probability of failure. In this alternative, the impact of interventions and deterioration processes will be assessed by means of a reliability analysis. | ||||
The question is which alternative will be preferred. Rijkswaterstaat will act as a as a river manager, but other management organisations (water boards) will be responsible for the strength of the river dikes. Coordination between these organisations is needed as the failure probability of the system will be determined by both the river water levels (the loads) and dike strength. Rijkswaterstaat will be solely responsible for the maintenance of water level conditions and should prevent the occurrence of unacceptable water level changes insofar it lies within her sphere of influence.
Together with the wish to keep the assessment of the impact of river interventions and other changes simple and easy-to-explain, the first alternative turns out to be the most appropriate one. The issue is then to choose the hydraulic conditions under which the impact of interventions and deterioration processes will be assessed, in such a way that the probability of failure is not affected. Since the probability of failure is determined by various water levels (see previous section), it is proposed to evaluate the impact of interventions and deterioration processes for different conditions. These would include a representative low water level L, a representative high water level H, and if necessary a water level in between. Figure displays a cross-section of the ‘present-day’ appearance of a river in the Netherlands and the levels L and H.
Figure 14. A typical cross-section of the ‘present-day’ appearance of a river in the Netherlands: a single main channel, low levees (‘summer dikes’), flat floodplains and river dikes.

The values of these water levels could be derived using the following considerations. The value of the high water level H will be related to mechanism overflow (and the corresponding crest level of the dike) and will be in the same range of the safety standard, so mostly in the range of 1000 to 10,000 years return period. The lower water level L will be related to piping and other geotechnical failure mechanisms. For these mechanisms water levels with return periods in the order of magnitude of 100 year play an important role (VNK, Citation2014). This means that the flood plains are inundated significantly. In addition, the duration of the high water event will be relevant, as it will determine the development of the phreatic line in the dike. In general, conservative (and deterministic) estimates are used for the duration of the loads and the resulting phreatic line. Using this approach, the values of L and H can be determined for various parts of the Dutch river system. This approach couples the physical function of the river system to the new reliability-based standards for the flood defences.
4.3. Adaptation of hydraulic infrastructure
This section presents the case of the adaptation of the dam and discharge sluices in the 32 km Closure Dam. This case highlights the issues and approaches in adaptation and renewal of hydraulic structures. Parts of this section are also included in Voortman et al. (Citation2017).
4.3.1. Overview
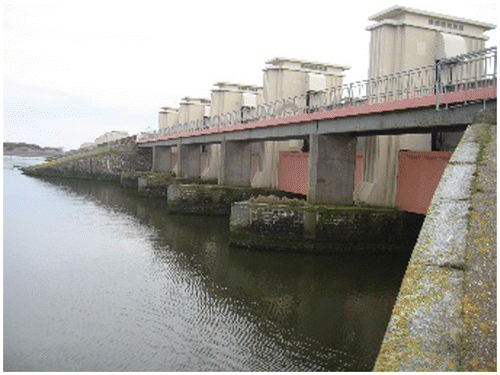
The Zuiderzee (Southern Sea) was a 4000 km2 estuary that penetrated deeply into the Dutch Delta. Already several centuries ago, Dutch engineers and scientists considered this estuary to be a candidate for land reclamation. The earliest studies into the closure of the estuary date back to the 1600’s (Stevin, Citation1667). In the second half of the nineteenth century several studies were undertaken that ultimately lead to the construction of the closure dam in 1932 (Thijsse, Citation1972). Since then, the estuary is turned into a fresh water lake in which several polders have been constructed, also see (Stive & Waterman, Citation2002) for an overview. The remaining lake of 2000 km2 is a fresh water reserve of which the level is artificially controlled. Water from the river Ijssel enters into the lake. At low tide, excess water is discharged into the sea through two complexes of discharge sluices constructed in the dam (Figure ).
Figure 15. Working principle of a discharge sluice.
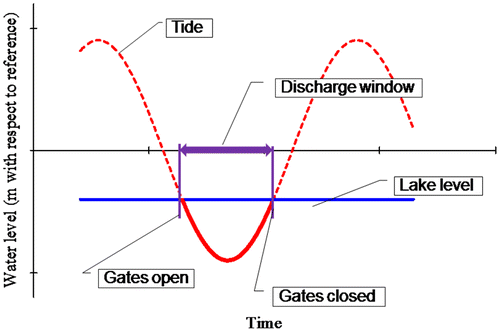
4.3.2. Maintenance strategy and ageing
The discharge sluices became operational immediately after closure of the dam in 1932. Their working principle rests on the water level differences that exist between the lake and the sea. The lake level is maintained slightly higher than low tide, so that a 4 h window is available to discharge water into the sea through the discharge sluice during every ebb tide (Figure ).
Figure 16. Discharge sluice in the closure dam (built 1932; source: beeldbank RWS).
Regular maintenance has kept the facilities operational until today. Several relatively smaller replacements and renovations have been executed to achieve this. At the same time, the structures are ageing on a much longer timescale due to sea level rise. During the design of the closure and the discharge facilities in the early twentieth century, the phenomenon of sea level rise was unknown or people were not fully aware of the consequences.
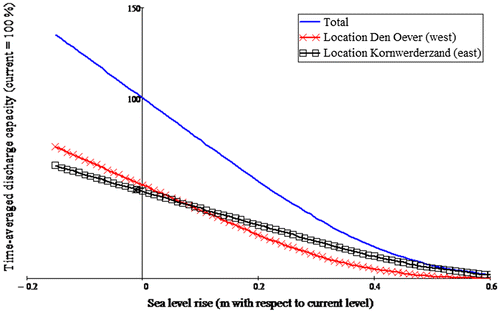
It is a fact that sea levels at the closure dam have been rising for over a century at a pace of 0.18 m per century. Despite this relatively low rate of rise, the consequences for the functioning of the discharge sluices are quite significant. A rising sea level implies a shorter discharge window and a lower head difference available for discharging excess water from the lake. Indicative calculations show that, due to sea level rise, 40% of discharge capacity has been lost with respect to the situation before 1932 (Voortman, 2017), although the tidal reach has increased (Rijkswaterstaat, Citation2009). The relationship between discharge capacity and sea level rise is given in Figure .
Figure 17. Relative discharge capacity as a function of sea level.
An extensive study was undertaken to find an appropriate way of controlling the lake levels in the future (Voortman & van der Kolk, Citation2013; Voortman et al., Citation2017). Important questions in the design of interventions concern the limits of acceptable lake level and the reference year until which a solution should work. After careful consideration, it was decided to:
| • | Maintain current lake level management until the year 2050. | ||||
| • | Keep the existing discharge sluices functional until at least 2050. This would require considerable renovation (see below). | ||||
| • | Replace the existing discharge sluices around the year 2050. | ||||
Maintaining current lake levels with increasing sea levels and changed patterns of river discharge involves expanding the discharge capacity at the closure dam. Several options were considered for this expansion:
| • | The construction of a new discharge sluice in the closure dam. | ||||
| • | The construction of a pumping station in the closure dam. | ||||
| • | Retro-fitting a part of the existing discharge sluices with high-capacity pumps. | ||||
| • | The construction of a hybrid discharge sluice, i.e. a discharge sluice designed to be (partially) turned into a pumping station when necessary. | ||||
The choice between the options turned out to depend heavily on the actual occurring sea level rise in the 40 years to come. As stated above, the current rate is 0.18 m per century and so far there have not been direct observations of acceleration. On the other hand, based on projections of future climate, acceleration is expected. At the current pace of sea level rise, a discharge sluice with relatively small dimensions would suffice to control the lake level well beyond the year 2050 (see Figure ). However, if a rapid increase of sea level takes place in the near future, all discharge sluices (including the new one) would rapidly become dysfunctional (see Figure ) and then (in hindsight) the construction of a pumping station would have been a good idea.
Figure 18. Development of the capacity if a new discharge sluice is constructed in 2017.
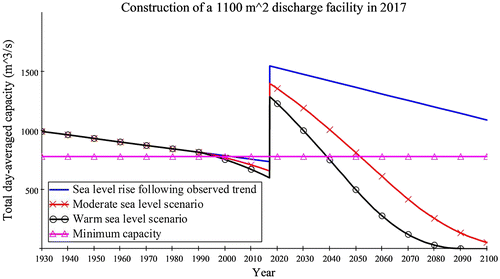
Several options were analysed in terms of life cycle cost for three scenarios of sea level rise (Voortman & van der Kolk, Citation2013; Voortman et al., Citation2017). As part of the life cycle costs, construction, maintenance, renewal and removal costs were considered. Since the available discharge capacity needs to be maintained above a certain threshold, repeated expansions of discharge and/or pumping facilities are necessary in most scenarios. Based on this study the option of retro-fitting part of the existing facilities with high-capacity pumps was selected as the preferred option. Twelve pumps will be installed in the existing discharge sluices around 2020. Thereby a part of the capacity of the discharge sluices will be reduced, but there will be greater pumping capacity and flexibility to deal with sea level rise.
5. Conclusions
This paper has summarised recent advances in the risk assessment and reliability-based management of flood defences and hydraulic structures in the Netherlands. Based on a nationwide risk assessment (including risk to life and economic risk) new safety standard have been derived for flood defences in the Netherlands. These standards are formulated in the form of an acceptable failure probability.
Several advances have been made to better characterise the reliability of hydraulic structures and to optimise interventions. Probabilistic approaches have been developed to better characterise strength, load and reliability. The case studies have highlighted a number of developments. In the field of flood defences, structural health monitoring and reliability-updating based on performance observations contribute to a better characterisation of reliability. Also, it has been shown how probabilistic analysis can be applied to evaluate innovative interventions.
The second case has shown how river management activities and frameworks can be linked to the new probabilistic safety standards. Representative low and high design water levels are derived from the results of probabilistic analyses, for the assessment of geotechnical failures and overflow. Future developments and interventions can be evaluated within this framework. The third case has shown how upgrades and reinforcements of hydraulic structures can be evaluated taking into account (uncertain) future developments such as sea level rise. Life cycle costs of various interventions strategies can be evaluated as a basis for decision-making.
There are several challenges ahead. Most of the examples and approaches focus on analysing a single structure and/or single uncertainty. The challenge is to come to an integral characterisation of multiple relevant uncertainties and to study problems with multiple degrees of freedom. An example of such a problem is the optimisation of the maintenance and intervention strategy along the river Meuse with multiple weirs that have been constructed several decades ago.
Now that risk and reliability have become more central concepts in the management and design of hydraulic infrastructure in the Netherlands, there is also a greater need for experts who have a thorough understanding of these concepts. This requires training and education programmes at the academic and post-academic level. At the same time, not in all cases, a complete probabilistic analysis will be desired or efficient for all users. It is therefore relevant to derive threshold values for design and management in a semi-probabilistic analysis. It is however important these derived values are rooted in the probabilistic analysis and calibrated. A specific aspect that requires attention in the assessment of hydraulic structures is that structural codes (e.g. Eurocode (CEN, Citation2002)) sometimes lead to different design values and outcomes than the codes and requirements in hydraulic engineering (e.g. design guidelines for flood defences structures). Further harmonisation is recommended.
Finally, with an ageing population of hydraulic structures and the recent adoption of more strict standards for flood defences in the Netherlands, the characterisation of the reliability of existing structures and proposed interventions will become even more important. The various challenges in the field can also be utilised for further methodological development and the formulation of the future research agenda.
Disclosure statement
No potential conflict of interest was reported by the authors.
Funding
This work was supported by the NWO TTW project SAFElevee (project number 13861) and the FAIR project, funded by the EU INTERREG North Sea Region (NSR) Programme.
Acknowledgements
The authors acknowledge the support of the NWO TTW project SAFElevee (project number 13861) and the FAIR project, funded by the EU INTERREG North Sea Region (NSR) Programme.
References
- CEN. (2002). EN 1990:2002 Eurocode – Basis of structural design. Brussels, Belgium: European Committer for Standardization.
- Delta Program. (2014). Working on the delta – Decisions to keep the Netherlands safe and liveable. The Hague: Dutch Ministry of Infrastructure and the Environment.
- Deltares. (2014) Technisch-inhoudelijke uitwerking DPV 2.1 (Working paper Deelprogramma Veiligheid. Concept of 26-02-2014). Delft: Deltares.
- Eijgenraam, C.J.J. (2006). Optimal safety standards for dikering areas. Paper presented at CPB discussion, paper 62.
- Frangopol, S.M., Kong, J.S., & Gharaibeh, E.S. (2001). Reliability-based life-cycle management of highway Bridges. Journal of Computing in Civil Engineering, 15(1), 27–34. doi:10.1061/(ASCE)0887-3801(2001)15:1(27)
- Jongejan, R.B., & Maaskant, B. (2015). Quantifying flood risks in the Netherlands. Risk Analysis, 35(2), 252–264. doi:10.1111/risa.12285
- Jonkman, S.N., & Schweckendiek, T. (2015). Developments in levee reliability and flood risk analysis in the Netherlands. In T. Schweckendiek, et al. (Eds.), Geotechnical safety and risk V, proceedings of the ISGSR conference in Rotterdam (pp. 50–60). Amsterdam: IOS Press. doi:10.3233/978-1-61499-580-7-50
- Jonkman, S.N., Bočkarjova, M., Kok, M., & Bernardini, P. (2008). Integrated hydrodynamic and economic modelling of flood damage in the Netherlands. Ecological Economics, 66, 77–90.10.1016/j.ecolecon.2007.12.022
- Jonkman, S.N., Jongejan, R.B., & Maaskant, B. (2011). The use of individual and societal risk criteria within the dutch flood safety policy-nationwide estimates of societal risk and policy applications. Risk Analysis, 31(2), 282–300. doi:10.1111/j.1539-6924.2010.01502.x
- Kaplan, S., & Garrick, B.J. (1991). On the quantitative definition of risk. Risk Analysis, 1, 11–27.
- Kind, J.M. (2014). Economically efficient flood protection standards for the Netherlands. Journal of Flood Risk Management, 7(2), 103–117. doi:10.1111/jfr3.12026
- Kiureghian, A., & Ditlevsen, O. (2009). Aleatory or epistemic? Does it matter? Structural Safety, 31(2), 105–112. doi:10.1016/j.strusafe.2008.06.020
- Klerk, W.J., Kanning, W., vander Meer, M.T. & Nieuwenhuis, J.W. (2017). Structural health monitoring for life-cycle management of dikes: A case study in the north of the Netherlands. In J. Bakker, D.M. Frangopol, & K. van Breugel (Eds.), Life-Cycle of engineering systems: Emphasis on sustainable civil infrastructure (IALCCE 2016) (p. 438). Leiden: CRC Press/Balkema.
- Ministerie van Infrastructuur en Milieu. (2016a). Achtergronden bij de normering van de primaire waterkeringen in Nederland. Report, 2016.
- Ministerie van Verkeer en Waterstaat. (2016b). Beleidslijn Grote Rivieren. Publicatie van het Ministerie van Verkeer en Waterstaat (Directoraat-Generaal Water) en het Ministerie van Volkshuisvesting, Ruimtelijke Ordening en Milieu (Directoraat-Generaal Ruimte).
- Miranda, C., Teixeira, A., Huber, M., & Schweckendiek, T. (2014). Probabilistic design of relief wells systems as piping mitigation measure. In Proceedings of the 12th International Probabilistic Workshop (IPW2014). Weimar, Germany. Retrieved from http://resolver.tudelft.nl/uuid:2e2e6048-1578-460a-961a-ae6d0bfadbb7
- Nieuwenhuis, J.W., van der Meer, M.T., Bakkenist, S., Pluijmers, Y., Clemens, R., & Zomer, W. (2016). LivedijkXL Noorderzijlvest: State of the Art 2015. Groningen: Stichting FloodControl IJkdijk.
- Peck, R.B. (1969). Advantages and limitations of the observational method in applied soil mechanics. Géotechnique, 19(2), 171–187. doi:10.1680/geot.1969.19.2.17110.1680/geot.1969.19.2.171
- Rijkswaterstaat. (2009). Hydrologsche trends Ijsselmeer. Rijkswaterstaat report 16 December 2009, edited by D. Vlag. Lelystad, the Netherlands.
- Rijkswaterstaat. (2015). The national flood risk analysis for the Netherlands. Utrecht: Rijkswaterstaat.
- Rijkswaterstaat Water, Verkeer en Leefomgeving. (2017). Rivierkundig Beoordelingskader voor ingrepen in de Grote Rivieren. Versie 4.0, Lelystad, the Netherlands, Rijkswaterstaat.
- Roscoe, K.L. (2017). Bayesian Networks for levee system reliability: Reliability updating and model verification ( Doctoral Dissertation). Delft: University of Technology.
- Schweckendiek, T., Vrouwenvelder, A.C.W.M., Calle, E.O.F., Jongejan, R.B., & Kanning, W. (2013). Partial Factors for Flood Defences in the Netherlands. In G.A. Fenton, et al. (Eds.), Modern Geotechnical Codes of Practice – Development and Calibration. Special Geotechnical Publication, Taylor & Francis.
- Schweckendiek, T., Vrouwenvelder, A.C.W.M., & Calle, E.O.F. (2014). Updating piping reliability with field performance observations. Structural Safety, 47, 13–23. doi:10.1016/j.strusafe.2013.10.002
- van Slobbe, E., de Vriend, H.J., Aarninkhof, S., Lulofs, K., de Vries, M., & Dircke, P. (2013). Building with nature: In search of resilient storm surge protection strategies. Natural Hazards, 66(3), 1461–1480. doi:10.1007/s11069-012-0342-y
- Slomp, R., Knoeff, H., Bizzarri, A., Bottema, M., & de Vries, W. (2016). Probabilistic flood defence assessment tools. In Proceedings of Flood Risk 2016 (Vol. 7, p. 03015). doi:10.1051/e3sconf/2016070315
- Stevin, H. (1667). Wiscontisch Filosfisch Bedrijf (in Dutch). Leiden: Philips de Cro-Y.
- Stive, M.J., & Waterman, R.E. (2002). The Netherlands: The Zuyder Zee project. In J. Chen, et al. (Eds.), Engineered Coasts (pp. 279–290). Kluwer Academic Publishers.
- Thijsse, J.T. (1972). Een halve Eeuw Zuiderzeewerken (in Dutch). Groningen: H.D. Tjeenk Willink.
- VNK – Veiligheid Nederland in Kaart. (2014). Eindrapportage Veiligheid Nederland in Kaart (Rapport HB 2540621). Nieuwegein: Rijkswaterstaat Projectbureau VNK.
- Voortman, H.G., & van der Kolk, H. (2013). Adaptive design as an answer to climate uncertainty. In R.D.J.M. Steenbergen, P.H.A.J.M. van Gelder, S. Miraglia, & A.C.W.M. Vrouwenvelder (Eds.), Proceedings of ESREL 2013: Safety, reliability and risk analysis: Beyond the Horizon (pp. 3303–3309). London: Taylor & Francis Group. doi:10.1201/b15938-50210.1201/b15938
- Voortman, H., Tuin, H., Seinen, W., & Jonkman, S.N. (2017). Lifecycle optimization of portfolios of hydraulic structures. In J. Bakker, D.M. Frangopol, & K. van Breugel (Eds.), Life-cycle of engineering systems: Emphasis on sustainable civil infrastructure (IALCCE 2016) (p. 110). Leiden: CRC Press/Balkema.
- Vrijling, J.K. (2001). Probabilistic design of flood defence systems in the Netherlands. Reliability Engineering and System Safety, 74(3), 337–344.10.1016/S0951-8320(01)00082-5
- Vrijling, J.K., van Hengel, W., & Houben, R.J. (1998). Acceptable risk as a basis for design. Reliability Engineering and System Safety, 59(1), 141–150. doi:10.1016/S0951-8320(97)00135-X
- Vuik, V., Jonkman, S.N., Borsje, B.W., & Suzuki, T. (2016). Nature-based flood protection: The efficiency of vegetated foreshores for reducing wave loads on coastal dikes. Coastal Engineering, 116, 42–56.10.1016/j.coastaleng.2016.06.001
- Willems, A., & Webbers, P. (2003). Modelling a probabilistic safety management system for the Eastern-Scheldt storm surge barrier, the basin and the surrounding dikes. In T. Bedford & P.H.A.J.M. van Gelder (Eds.), Safety & reliability: Proceedings of ESREL 2003, Vol. 2 (pp. 1713–1719). Lisse: A.A. Balkema.