
 ?Mathematical formulae have been encoded as MathML and are displayed in this HTML version using MathJax in order to improve their display. Uncheck the box to turn MathJax off. This feature requires Javascript. Click on a formula to zoom.
Abstract
The optimal moment at which maintenance activities should be performed on structures with long service-life to guarantee the required quality of service is hard to define, due to uncertainties in their deterioration processes. Most of the developed methods and concepts use historical data to predict the deterioration process with deterministic values as a result. Some researchers recognise that probabilistic deterioration models are required for life-cycle models but in practice, however, historical data are often scarce. Moreover, the available data often only inform about a short period of time, while maintenance strategies, technologies, materials and external circumstances change over time. Therefore, the required probabilistic deterioration models cannot be retrieved and remain unproven in life-cycle modelling so far. Hence, this article introduces an expert judgement based Condition Over Time Assessment method that quantifies the uncertainty regarding the period that is required for structural assets to deteriorate to a given condition. The proposed method utilises Cooke’s classical model, which makes use of knowledge and experience of experts, who are weighed according to their performance in judging uncertainty, to assess this period. A bridge-based experiment shows that the proposed method has the potential to provide a means to effectively plan maintenance.
1. Introduction
Large investments have been made in most countries to construct infrastructure networks in the second half of the twentieth century. The development and building of infrastructure networks contributes to the delivery of essential services, the support of social needs and, most importantly, economic development (Too, Betts, & Kumar, Citation2006). With limited budget and a lot of infrastructure constructed in a short amount of time, the challenge in the infrastructure industry has now shifted from funding new infrastructure to funding the maintenance and replacements of existing infrastructure (Neves & Frangopol, Citation2005).
The infrastructure networks are characterised by structural assets with a long service-life in which a complex, often invisible and highly uncertain deterioration process is present (Kumar & Gardoni, Citation2013). Asset deterioration is an ongoing process where the value and performance of structural assets reduce over time due to stressful conditions, characterised by aggressive chemical attacks and other physical damage mechanisms. Factors like increasing use, climate change, higher loads, heavier rainfall and stronger winds strengthen this process (Klatter & Roebers, Citation2017). Deterioration factors are thoroughly described by Biondini and Frangopol (Citation2016). However, knowledge about the way structural assets deteriorate over time and how the deterioration affects the life-cycle costs, risks, and performance is still lacking completeness (Parlikad & Jafari, Citation2016). As such, complexities arise in the quantification of the impact of deterioration and the aggregated planning of maintenance to be performed due to deterioration. This creates consequences for the budget allocation for maintenance activities as well.
Maintenance is performed on structural assets to tackle the deterioration process and to make sure that quality and reliability are kept above a minimum target level for a period of time (Ye & Xie, Citation2015). Predicting the moment just before a quality level is dropped, and thus the moment by which a maintenance activity should be performed is hard due to uncertainties in the parameters of the deterioration process and the absence of long-term historical condition data.
Data which inform about the condition or performance of infrastructure assets is generated by visual assessments or the concept of structural health monitoring (SHM). Visual inspections follow a methodology by which infrastructure assets receive a score which expresses their condition. Instead of a continuous damage model, this information may predict the probability of occurring defects and thus conditions (Yang, Frangopol, & Neves, Citation2006). SHM generates a large amount of sensor data (Frangopol & Soliman, Citation2016). These data correct performance predictions but uncertainties still arise due to errors in modelling and measuring (Miao, Veerman, Koenders, & Knobbe, Citation2013). The application of SHM on a large scale would come with significant investments as well (Srinivasan & Parlikad, Citation2013). Moreover, recent data mining attempts for SHM are not yet leading to the required engineering asset management decision support (Miao, Citation2014). The deterioration process can be modelled with the use of data in a deterministic or stochastic way, or by the application of machine learning.
Deterministic maintenance plans are still frequently used, as concluded from an investigation in maintenance schemes in the Netherlands. A deterministic prediction of the rate by which structural assets deteriorate leads to a single value for each iteration of maintenance activities. Uncertainties regarding the deterioration process are not considered and as a result the budget allocation does not represent the actual necessary maintenance costs (Liu & Frangopol, Citation2004).
Stochastic models make use of random variables which represent the shock and gradual process of deterioration (van Noortwijk, Citation2009; Van Noortwijk & Frangopol, Citation2004). A slight change in the input variables of the deterioration models creates a significant difference in the output (Biondini & Frangopol, Citation2016). Although significant attention has been dedicated to stochastic modelling, the validation and calibration based on experimental or monitoring data is an important topic that has not been tackled yet (Jia & Gardoni, Citation2018).
Artificial intelligence models identify relationships between in- and output based on data input. Morcous, Rivard, and Hanna (Citation2002) proposed a case-based reasoning system to model infrastructure deterioration by the use of data. Kobayashi and Kaito (Citation2017) further investigate the concept of deterioration models in infrastructure asset management which are based on big data. Database-management systems in the infrastructure industry show promising results which counter the limitations of deterministic and stochastic modelling. Concepts and applications to model deterioration with the use of data show that short term predictions about the deterioration rate can be given.
Long term predictions about the deterioration rate are still uncertain. Models based on historic data analysis use assumptions about future uncertainties such as climate change, pollution, structural load and their impact on asset deterioration. In this context a study of interest is conducted by Davis and Socolow (Citation2014) who investigated the (remaining) life of power plant generators in relation to the forecasted CO2 emissions. Forecasted climate scenarios were the major uncertainty driver for future investments. A similar observation was made by Zhang, Chouinard, Power, Tandja, and Bastien (Citation2018) who developed a probabilistic deterioration model for bridge deck pavement under several climate change scenarios, again based on historical data analysis.
In contrast, the starting point in this paper is that sufficient applicable data to model deterioration is absent for most infrastructure owners. In particular, a methodology is designed and tested to predict the moment by which an asset reaches a certain condition and maintenance should be performed, based on uncertainty assessments with the use of experts and limited data. As stated, circumstances change over time. The forecasts of condition deterioration depend on many uncertain variables among which the structural integrity, pollution, climate change, population growth and socio-economic factors. As with historical data analysis, one could argue to which extent assessing variables in the short-term can be assumed as a sound criterion for assessing these variables in the future. In response we argue that expert judgement exploits the local knowledge of experts. These experts are aware of local urban dynamics (spatial planning, politics) and specific problems with their infrastructure (e.g., acid rain, deformations, structural integrity, traffic load). The experts are seniors in their domain and incorporate decennia of experience in their estimations. This experience is finally reflected in the uncertainty bounds provided by these experts.
It is reasonable to believe that experts implicitly and explicitly have knowledge about the impact of a broad range of uncertainties and their interdependencies on condition deterioration over a time span of a few decennia. The experts’ predictive competences to assess long-term impact caused by, for example, climate change could be improved by training. In this context and as an example, reference is made to Practice Note 12 of the Institute of Public Works Engineering Australasia (IPWEA, Citation2018) which provides practical insight and estimated relationships between climate change factors and their impact on the remaining useful life of infrastructure assets.
The purpose of the current research is to develop an approach to predict deterioration of infrastructure with the use of currently available means in most infrastructure managing organisations. Limitations and complexities regarding the absence of data and uncertainties in deterministic, stochastic or artificial intelligence modelling are overcome by exploiting performance-based expert judgement in a structured manner. The purpose of the method is to generate actionable output for infrastructure owners in their aggregated maintenance planning.
2. Performance-based expert judgement
Cooke’s classical model for structured expert judgement (SEJ) provides a mean to reach rational consensus in problems for which insufficient relevant field data are present. The model elicits judgements from experts in a specific field of interest to develop probability distributions. These judgements incorporate personal experience and expertise. Consensus is achieved by measuring experts’ performance in judging uncertainty and weighing judgements accordingly. The fundamental assumption of SEJ is that the statistical accuracy of uncertainty judgements for the unknown can be expressed by the statistical accuracy of uncertainty judgements for things that are known (Cooke & Goossens, Citation2008). A more detailed explanation about expert judgement and the mathematical background is given by Cooke (Citation1991). This section introduces the basic concepts of the model.
2.1. Variables
Values of seed and target questions are queried through a questionnaire and assessed by selected experts to measure their performance in judging uncertainty. Seed questions concern variables for which the true values are known to the analyst but not to the experts at the moment of the elicitation. Target questions concern variables for which new assessments have to be developed by the analyst. Uncertainty is described by the assessed predefined percentiles which are usually the 5th, 50th and 95th. As such, a reliable uncertainty judgement corresponds with an expert’s distribution that is similar to the theoretical distribution which is formed by the predefined percentiles. The performance in judging uncertainty of an expert is expressed through a weight which is calculated by the product of the measurements of calibration and informativeness. A particular combination of expert opinions results in a ‘virtual’ expert with a combined calibration and information score whose weight can be maximised by excluding low calibrated experts.
2.2. Calibration score
The calibration score expresses the degree to which an expert is statistically accurate with respect to his/her assessments on seed variables. Statistical accuracy is expressed as the matter to which an expert’s judgement is reliable and can be measured by the relative information
between one’s empirical probability mass function
and a theoretical mass function
as shown in EquationEquation (1)
(1)
(1) . Both functions are determined by the amount of quantiles
, for each queried seed variable and for which the expert has to give his/her assessments:
(1)
(1)
The calibration score itself is calculated by a conversion of the relative information to a distribution (Hoel, Citation1971) by multiplying the relative information with
, twice the amount of seed questions. The calibration score
is then calculated by:
(2)
(2)
The calibration score is a fast varying function. A maximal calibration score of 1 is reached when both mass functions are equal by which an expert shows to be a statistically accurate uncertainty assessor. No information is exchanged between an expert’s and theoretical mass functions. Low calibration corresponds with a score approaching 0.
2.3. Information score
The information score expresses the relative range an expert applies in his/her judgements on items. The information score is measured by the relative concentration of an expert’s distribution with respect to a background measure. The background measure could be uniform or log-uniform of an intrinsic range
which is bounded by the lowest (
) and highest (
) quantile and captures all possible intervals. The lowest and highest values are
and
where
is defined as the realisation of interest. The bounds are calculated by adding a k% overshoot to the lowest (
) and highest (
) assessment of experts. The intrinsic range is then bounded by
and
. The information score
is then computed via EquationEquation (3)
(3)
(3) and rises as the ranges of expert’s assessments become more narrow:
(3)
(3)
2.4. Combining opinion
The strength of SEJ is to achieve rational consensus by combining expert opinions. Combining expert opinions synthesises experts in the panel and results in a ‘virtual expert’ or decision-maker (DM) which re-assesses the seed variables and target variables. The combined opinion is derived from a selected (performance-based) weighting scheme by which each expert’s weight is determined. Experts can be given equal, global or item weights (IW). An equal, and therefore not performance-based weighting scheme (EW) implies an equal influence among the experts on the distributions per variable. Global weights (GW) are calculated by using the measures of calibration and information on seed variables. IWs are determined by the information score per item per expert to process the matter of confidence per item per expert.
A performance-based weighting scheme maximises the weight of the DM by applying a significance level for the individual calibration scores that excludes low calibrated experts. It is worth mentioning that both types of performance-based weights are weakly asymptotically strictly proper. This property ensures that if an expert wishes to maximise his/her long run expected weight then he/she should do this by stating his/her true beliefs as answer to the seed variables (Cooke, Citation1991). The reader who is interested to know more about this property is referred to the supplementary information for Colson and Cooke (Citation2017).
3. Condition over time assessment
The Condition Over Time Assessment (COTA)-method consists of an application of SEJ in which experts perform a COTA for structural assets. The goal of the proposed method is to quantify the impact of asset deterioration in order to define the optimal moment by which a maintenance activity should be performed. This moment is defined as the moment just before the performance of a structural asset exceeds the minimum threshold which is in accordance with the demand of an asset owner. The concept of the COTA-method is shown in . The method assumes that if experts are able to assess the time it took to reach a recorded condition through seed questions, they are able to assess the time it will take to reach a defined condition along a performance indicator through target questions.
Figure 1. COTA-concept: seed question (left) and target question (right).
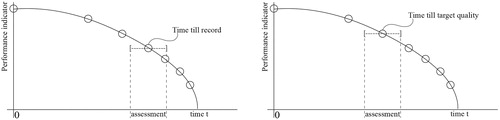
Applying the framework consists of the following steps:
Determine a performance indicator.
Identify seed and target questions.
Build the questionnaire and test it.
Select experts in the concerning field of interest and elicit data.
Processing - apply Cooke’s model for analysis and synthesis of expert opinions.
Use results for decision making of maintenance of structural assets with a long service-life.
These steps are presented in detail in the following subsections.
3.1. Determine a performance indicator
A wide prevalence of international and national standards exists by which infrastructure performance is indicated. The standards usually make use of a methodology by which the condition of structural assets is visually assessed and expressed along a scale. Determining the performance indicator for the COTA-framework depends on the region for which results will be generated and by which an asset manager wants to express the quality of his area.
3.2. Identifying seed and target questions
Seed questions are based on inspection records of structural assets in the past that show the condition of these assets, and thus the deterioration process and cause of deterioration. The life-cycle of the asset till a certain record should be known to make sure that the deterioration process has not been tackled yet by performing maintenance. Experts are asked to assess the time it took to get to the damage which is seen in the records.
Target questions should resemble the same elements which are queried in seed variables. The target variables query a by which an asset element reaches a certain quality level which is expressed by the performance indicator. Maintenance activities that tackle the deterioration process of these elements can be performed by this period to ensure a predefined quality level following the concerning standards.
3.3. Build the questionnaire and test it
The questionnaire consists of seed and target variables. shows the illustrative querying and illustrative answering of these variables, following SEJ’s methodology for judging uncertainty. The content of the target variables depends on the answers the analyst is looking for. The answering of questions leads to quantiles per variable per expert and values for the performance measures. The analysis and processing of these values will be elaborated upon in Section 3.5. It should be made sure that uncertainties and complexities concerning the questionnaire are resolved in order to analyse experts’ assessments. Testing the questionnaire with a few experts before the data elicitation will show if indistinctness arises and improvements can be made.
Table 1. Querying variables - concept.
3.4. Selection of experts and data elicitation session
The determined standard to evaluate infrastructure condition should be known to the participating experts and is used to have a measurable instrument in seed and target variables. Besides the knowledge about quality control, experience with inspections and maintenance is of importance as well for a clear understanding of the variables. A measurable threshold for this criterion has not been defined yet. The elicitation of data happens through either individual or group sessions. Following the expert judgement protocol (Cooke & Goossens, Citation2000), a normative analyst who is experienced in probability theory and a substantive analyst who is experienced in the expert’s field of interest should be present to discuss the expert’s judgements.
3.5. Processing
A brief example of the processing of the outcome of the questionnaire is given. Three illustrative experts assessed five seed variables and two target variables. Their assessments are shown in . The true values for seed variables are highlighted in brackets. The expert assessments are judged by the performance measures on statistical accuracy and information score on just seed variables and on all variables together. Multiplying the calibration score with the information score on seed variables results in the un-normalised weight. The values are obtained following the equations in Section 2. Combining expert opinions might improve the statistical accuracy and information score and maximise the weight of the DM. The (un-normalised) weight of a virtual DM which equally incorporates the opinions of the experts is shown under DM-EW.
Table 2. Answering of variables - example.
Combining opinions based on performance as explained under Section 2.4 might result in a DM with a higher weight compared to the individual experts or an equal weighting scheme. shows an illustrative comparison between the equal, global (DM-GW) and item (DM-IW) weighting schemes, deriving from the experts’ assessments in . A significance level of 0.04928 maximises the weight of the performance-based DMs. Expert E1 has a calibration score of 0.01398 and is not participating in the pool anymore. The statistical accuracy becomes lower but the information score rises. This also affects the estimates that are given by the DMs. A minimal difference can be seen in the assessments for the first two seed variables. This is due to the way both DMs are calculated, as explained in Section 2.4.
Table 3. Assessments of equal and performance-based decision-makers with a significance level of 0.04928.
Several software applications have been developed to automate the calculations of performance measures and analyses. Examples are Excalibur and the newly developed open-access software ANDURIL (Leontaris & Morales-Nápoles, Citation2018). Analyses show the robustness and discrepancy of the COTA-application. The robustness of the application is analysed by leaving either variables or experts out of the questionnaire to see whether the performance measures of the resulting DM will significantly differ from the initial one. A discrepancy analysis shows the (dis)agreement among the experts in general but can also be shown per seed or target variable. Discrepant variables may cause confusion among the experts and influence the final result. Excluding these variables may generate an opinion with a higher weight.
Recent studies show additional validation opportunities within expert judgement such as a cross validation analysis (Colson & Cooke, Citation2017) or out-of-sample analysis (Cooke et al., Citation2014). These methods will not be further discussed in the application of the COTA-method.
3.6. Use results for decision making of maintenance of structural assets with a long service-life
The outcome of the previous steps will consist of distributions for queried maintenance activities for structural assets. Analyses will show the reliability of these results. The results provide a means to effectively plan maintenance of structural assets with a long service-life.
4. COTA framework application and results
The proposed COTA-method has been applied in 2017 with experts from contractors, municipalities and engineering firms in the infrastructure industry in the Netherlands. The purpose of this application has been to produce probabilistic intervals for selected maintenance activities on bridges in a Dutch urban environment. The urban environment addresses a specific set of characteristics and damage mechanisms. Seed and target variables have been designed by consulting archives, databases, maintenance schemes and experts of several large municipalities in the Netherlands. Resulting from this exploration, applicable maintenance records from eight bridges in Haarlem and Amsterdam for the design of seed variables and a generic nomenclature for maintenance activities have been developed to query these activities through target variables. shows the set-up of the COTA-framework in this application.
Table 4. Set-up for the COTA-application.
Each step in the procedure as explained in Section 3 is considered.
4.1. Performance indicator
The Dutch NEN2767-4 is a standard which prescribes a methodology to evaluate structural conditions. The standard classifies the condition of structural elements by the seriousness, size and intensity of detected damage. The methodology expresses a condition per element or per asset by a scale of 1 to 6, representing excellent to worst condition. A condition score of 3 is used in this application which is broadly defined as common damage on a high scale or hazardous damage on a small scale.
4.2. Identify seed and target questions
shows the bridges that have been used in the determination of seed variables. Eight bridges in the Netherlands have been selected for which the life-cycle and maintenance records of its elements are known from construction and for which significant deterioration has been detected. The 5th column displays the time between delivery and first maintenance record by which the age of damage has to be judged. The realisation addresses the true value per seed variable. The type of traffic and deterioration are shown in the 6th and 7th column. Note that 6 out of 8 seed variables relate to bridges for cyclists and pedestrians. Only 2 seed variables related to normal traffic were designed due to a lack of applicable data. The seed variables therefore do not represent the total population of bridges.
Table 5. Bridges used for the determination of seed variables.
The questionnaire provided damages and information regarding the neighbourhood, traffic load and materials of the concerning bridges. Some of the photos of seed variables S3 are illustrated in . The seed variables are explicitly indicated in in the appendix. presents the target variables for this application. The variables represent common bridge elements for both fixed and movable bridges in a Dutch urban environment. The elements relate to maintenance activities for which the interval with the uncertainty associated with asset deterioration, as explained in the introduction, will be developed.
Figure 2. Damage record of seed variable S2.

Table 6. Target variables.
4.3. Build the questionnaire and test it
A hard copy questionnaire has been developed consisting of an introduction to the research and the two types of variables. Attention has been paid to create an appealing format. Two dry-run exercises have been performed with a few experts after which improvements were made regarding the explanation on SEJ and a more self-evident fill-in form for the answering of variables.
4.4. Selection of experts and data elicitation session
Municipalities, contractors and engineering firms are represented by a selection of 27 experts divided over six organisations with executing and advising roles in the maintenance sector. The background of the participating companies lies within the infrastructure industry. The experts were familiar with the chosen performance indicator and have experience with the inspection of bridges and planning of maintenance. The company names and affiliations are mentioned in in the appendix. To protect the identity of the participating experts and companies, the ID order of this table does not correspond with the ID order of the assessments and performance measures presented in in the appendix.
After introducing the purpose of the research and explaining the COTA-method which involved training in how to assess the different percentiles, data has been elicited through group sessions at the participating companies. Initially each expert filled in the questionnaire containing seed and target questions individually. Clarifying questions regarding the questionnaire were answered by the analyst. Then, experts were also given the opportunity to discuss with other experts and adjust their assessments, before the revelation of the true values. This decision has been taken as discrepant assessments were expected following from a lack of official terminology regarding maintenance activities and different approaches how to properly maintain infrastructure to a certain degree, expressed through the performance indicator.
This approach is inspired by the IDEA protocol which has generated better quality group estimates before by facilitated interactions among experts, taking the potential for loss of information for granted (Hanea, McBride, Burgman, & Wintle, Citation2018). The discussions in this application however were brief and did not involve extensive reviews of every variable. Experts were (over)confident about their assessments and did not adjust their assessments after knowing the assessments of their colleagues.
4.5. Processing
The processing of data happened in Excalibur. Excalibur originated in the Safety Science Group at the Technical University of Delft and has reached a mature state in the affiliated Mathematics Department (Goossens, Cooke, Hale, & Rodić-Wiersma, Citation2008). The anonymised experts, their assessments, resulting performance measures and results of the application of the COTA-method are presented in the Appendix.
Three experts were not able to assess target variables related to movable bridges which are T6, T7, T8 and T15. Hence, a separate pool of experts was composed to assess these variables with the other 24 experts. The results between the two pools regarding statistical accuracy and informativeness are not significantly different. This section will only discuss the results regarding target variables on fixed bridges which are shown in in the appendix. The results regarding the excluded variables related to movable bridges can be found in in the Appendix.
4.5.1. Individual assessments
shows the highest and lowest calibrated experts from the pool of 27 experts. The calibration score is denoted in the 2nd column. The 3rd and 4th column show the information score with respect to all and just seed variables. The individual weight in the 5th column derives from multiplying the individual calibration score with the information score on seed variables. Experts used relatively narrow ranges but performed low in terms of statistical accuracy. This can be seen by a mean calibration score of 3.59E − 03 and mean information score of respectively 1.49 and 1.35 on all and just seed variables, calculated over all experts.
Table 7. Highest and lowest calibrated experts.
4.5.2. Combined opinion
Combining expert opinions resulted in a statistically more accurate opinion. Equal and performance-based DMs are illustrated in . An equal weighting scheme (DM-EW) does improve the calibration score but also generates a five times lower information score for both types of variables compared to the mean scores of all experts' estimates in . A maximal un-normalised weight for the performance-based DMs is achieved by excluding experts with a calibration score below 0.01644. Three experts in the pool succeeded to do so and are shown in . At this significance level, a 25 times higher calibration score in relation to the highest calibrated experts is achieved for both the global based (DM-GW) and item based (DM-IW) DM (0.6876 vs 0.02651).
Table 8. Equal and performance-based (significance level 0.01644) decision-makers.
The information score of the performance-based DMs fell down to a score almost twice as low as the lowest information score of the participating experts (0.4747 vs 0.8412). A significant difference can be seen between the calibration scores of the equal and performance-based weighting schemes (0.08041 vs 0.6876). Such a difference is uncommon but can be explained by the relatively large amount of experts compared to previous expert judgement applications. As such, the assessments of experts with low statistical accuracy, which are taken into account in an equal weighting scheme, cause a large difference in the ranges that apply in the DM. This is not observed when the performance-based weighting schemes are used for the synthesis of the DMs, which are synthesised based on the assessments of the experts with higher statistical accuracy.
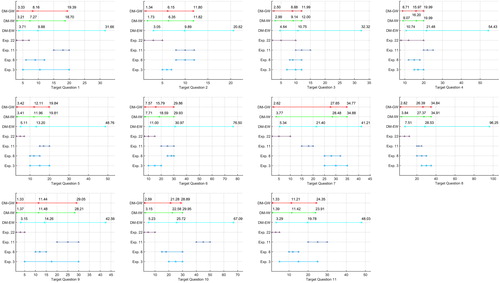
The values in and lead to the distributions for seed variables in . These plots were produced using the Matlab Toolbox ANDURIL. It can directly be seen from both values and distributions that the performance-based DMs are statistically more accurate. The realisation is captured more often in different bins. Expert 11 manages to capture a true value once in his assessment which results in a low calibration score of 1.729E − 008. It can also be seen that the range of the distributions for the DM-GW is slightly larger compared to the DM-IW. The range of the distribution of the DM-EW is the largest which can be (visually) traced back from the lowest information score in and the distributions in . The DM-EW manages to capture the true value within the 5th and 95th percentile in every seed variable.
Figure 3. Distributions for the eight seed variables by their 5th, 50th and 95th percentiles for decision-makers and experts.
Due to the fact that it captures the true value in his second interquartile range in 7 out of 8 seed variables, between the 5th and 50th percentile, the calibration score is low compared to the other DMs that capture the true values in different bins. Altogether, the highest un-normalised weight is reached in an item-based DM. A relatively large range is maintained in its assessments, however, due to several variables for which discrepant assessments have been given. A discrepancy analysis will show whether this occurrence can be mitigated.
4.5.3. Discrepancy analysis
Excluding variables with a discrepant assessment did not lead to a higher information score. Discrepancy can be caused by different personal and organisational backgrounds. Important to note is that an official uniform understanding of the designation of maintenance activities has not been developed yet in the Netherlands with as a result that target variables might have been interpreted differently. Moreover, the comparison of maintenance schemes of different companies leads to the conclusion that companies designate the same maintenance activities by different denominations.
For that reason, the information score of every individual expert with respect to the DM-EW was computed. This was performed by performing a discrepancy analysis with Excalibur software when taking into consideration only one target item at a time. In this way, it was possible to investigate the level of agreement (in terms of the expression of the uncertainty of every target item) between every individual expert and the equally weighted combined opinion.
For target variables (T9, T11 and T13) the maximum relative information of particular experts were observed. This provides an indication that experts with high relative information, with respect with the DM-EW, might have misunderstood the question or are very confident about their assessment. In practice, this could lead a practitioner (who is interested in making decisions based on for the variable of interest) to consider contacting the particular experts to ensure that the target question was properly perceived.
4.5.4. Robustness analysis
shows the robustness analysis on seed variables using IWs. The first column shows the seed variable which is excluded. The resulting relative information on all variables and calibration score are respectively shown in the 2nd and 3rd column. The results of the elicitation are robust against the choice of experts. Excluding experts did not lead to significant changes in the resulting DMs. The results of the elicitation are robust to the choice of seed variables as well. A slight change in the calibration score is seen when seed variables S1, S3, S6 and S7 are excluded one at a time. The most probable cause for this is the low amount of seed variables and that calibration is a fast changing function (Cooke, Citation1991). The performance measures for the item-based DM change slightly in case seed variables are excluded from the questionnaire. If more seed variables are queried, a lower impact on the resulting calibration score is expected when these variables are excluded.
Table 9. Robustness analysis on seed variables using item weights.
4.5.5. Rational consensus
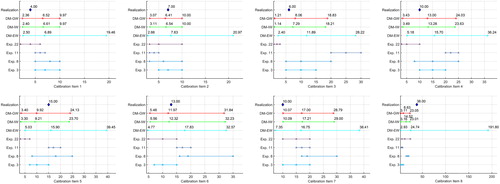
The best performing DM derives from an item-based weighting scheme as can be seen in . There is a reasonable chance that the intervals will capture the true value due to the calibration score of 0.6876. Although the calibration scores of both DMs are equal, the informativeness in an item-based weighting scheme is higher (0.519 vs 0.5603).
depicts the distributions for the target variables in that derive from the assessments of the highest and lowest calibrated experts, and the resulting DMs. The DM-IW expresses rather large uncertainties due to a relatively low information score of 0.5603. Many distributions have a range of 20 years between the 5th and 95th percentile. This is caused by discrepancy which was still present among the highest calibrated experts. However, overlap between the opinions and the performance-based DMs is seen in every variable except T1, T9, T11, and T13. The uncertainty judgements of experts have not been qualified by which it cannot be concluded whether experts took exactly the same conditions into account in their assessments.
Figure 4. Distribution for target variables by their 5th, 50th, and 95th percentiles for decision-makers and experts.
4.6. Use results for decision making of maintenance of structural assets with a long service-life
With the target variables in and the distributions in , a means has been developed for infrastructure asset managers to make decisions under uncertainty in the planning of maintenance. Rational consensus has been reached for the period it will take to deteriorate to a certain quality level for the queried elements. The asset manager may now plan maintenance according to the derived distributions. The underlying objective of the current research is improvement of the aggregated long-term maintenance planning of municipalities in The Netherlands. These plans often have a time span of 50 years in which the first 10 years are used for asset portfolio budget planning.
As an example, one of these municipalities owns 1600 bridges. The long-term maintenance planning contains all these bridges and estimates the long-term future maintenance costs based on forecasted cyclic maintenance activities with a deterministic maintenance interval. The aggregated total of costs provides a motivation for maintenance budget allocation. The aggregated maintenance planning accounts for a required service level which is influenced by the duration of the cyclic mean maintenance intervention intervals and is reflected in condition scores. The municipality has two objectives. The first objective is general improvement of the long-term maintenance planning which requires a reassessment of the deterministic mean maintenance intervals and additionally introduces uncertainty estimates.
The second objective is to gain insight in overall maintenance costs with respect to different service levels, for example, steering on condition level 3 or 4. In the absence of data to investigate uncertainty bounds and the impact of maintenance intervals on condition deterioration, an expert judgement approach is developed to exploit the knowledge of local senior experts. The results of the current study are used to improve the current aggregated long-term maintenance planning by adaptation of the means and inclusion of uncertainty estimates.
In time the results of this expert judgement approach will be validated by comparison of condition scores and maintenance activities. The actual maintenance activities at asset level follow from standardised condition assessments. The current research also provides guidance on data recording required for future validation of the experts' assessments and the long-term maintenance planning.
The expert judgement method is generic; the questionnaire developed in the current research is specific and targeted at the current underlying objectives for improvement of the long-term aggregated maintenance planning. Another organisation may have other underlying objectives which require adaptation of the questionnaire but will not alter the method or approach. A questionnaire could for example further differentiate in classes for specific circumstances. This would decrease uncertainty but increase the effort of mobilising the experts and their assessments.
5. Discussion
It must be mentioned that the results presented in Section 4 concern the first application of the proposed COTA-method. As usually happens with applications of newly developed methods, the researchers came across different challenges and shortcomings. These are analysed and discussed in this section with the purpose to serve as recommendations for improvements in future applications.
First, because of very limited data it was possible to develop only up to eight seed variables, despite the recommended minimum of ten (Goossens & Cooke, Citation2005). A full representation of the types of bridges that can be found in an urban environment has therefore not been achieved. The small amount of seed variables influences the robustness of the questionnaire and due to lacking data target variables are also not fully resembled by seed variables. One of the target variables queries the deterioration time for machinery of movable bridges while this has not been queried in seed variables for instance. Experts' performance should be judged indicative for their performance on target variables though (Kosgodagan, Morales-Nápoles, Maljaars, & Courage, Citation2016).
Another shortcoming of the presented application stems from the influential factors related to the different personal backgrounds and discrepant interpretation of the target variables and performance indicator. The target variables relate to maintenance activities in the Netherlands for which different non-official terminologies exist. Although every expert received the same information including a clear explanation about the method and what was being meant with the target variables, it can be concluded that experts disagreed with each other or interpreted activities differently. The proof for this lies in sometimes significantly different assessments of target variables as can be seen in and in the appendix.
Disagreement is not unusual but misinterpretation may have been enforced by different personal and organisational backgrounds. Personal interpretation with respect to the performance indicator is also influential. The applied standard provides an objective methodology to assess structural conditions. However, in practice the methodology fully depends on the visual and thus subjective assessment of damage by experts which might result in different scores for the same damage per expert. The alignment of experts regarding the target variables and the performance indicator has not been validated in this application. It is recommended in future applications to have this validation, which could result from more extensive group interactions as proposed in the IDEA protocol.
Various factors may be distinguished for discrepant assessments that relate to the variables or SEJ in general. Despite the fact that target variables in relation with a performance indicator might have been misinterpreted, the participating experts in general were not statistically accurate in assessing the condition of structural assets over time through seed variables as well. This results in statistically inaccurate and very large ranges in the DM when every expert has equal influence on the DM (0.08041 & 0.2788). If only high calibrated experts contribute to the DMs, the statistical accuracy and information score get higher (0.6876 & 0.5603). Discrepancy among the highest calibrated experts was present as well.
The approach which was inspired by the IDEA protocol did not result in changes and possible improvements of experts' assessments. The authors do not assign this to the potential but to the execution of the IDEA principle in this application. The discussion per variable was very brief and did not result in an extensive review per variable. Psychological factors lacking indulgence to change assessments such as time pressure or willingness to cooperate would also be of importance in this case but are only speculative arguments.
The relatively large range can also be substantiated by the fact that target variables addressed assessments for a group of structures instead of a specified asset. The target variables relate to maintenance activities on bridges in an urban environment in general and do not address specific bridge characteristics in that category. More specific distributions can be developed when the target variables are further specified to specific structural assets. The derived distributions in this application can be applied on a strategic level by an asset manager but not to specific bridges as the uncertainties within the distributions have not been qualified. The results of the elicitation provide asset manager with a means to implement a risk level in the maintenance of his assets. This means is derived from rational consensus and helps to achieve a standard conforming quality level by a probabilistic maintenance planning.
6. Conclusions
Making optimal decisions regarding the maintenance of structures assets with a long service-life is challenging due to the uncertainties involved in the long term deterioration processes. In the past, different methods and concepts have been developed to model deterioration with the use of data. In many situations however, useful condition data are found to be absent and or only available for a too short time-period. Therefore, a method has been proposed in which Cooke’s classical model is utilised to combine expert judgments and describe the uncertainty regarding the deterioration process of engineering assets with a long service-life.
This COTA-method provides a means to achieve rational consensus with limited means. The model weighs experts based on their performance in judging uncertainty in the field of asset deterioration. The period it took and will take for engineering assets to deteriorate to a certain condition has to be assessed by damage reports. The uncertainty judgements are combined and generate a distribution which provides a probabilistic estimate for the time it takes to reach a predefined condition. Depending on the way variables are queried, tailor-made distributions can be developed for groups of structures or specific assets. Ultimately, engineering asset managers owners may apply these distributions in order to define their quality of service strategies with a certain confidence level. For example, the obtained distributions can be used as input into numerical models that run Monte Carlo simulations with the purpose to support the decision making of maintenance of the particular assets.
The proposed method has been applied in a test case concerning the predictive maintenance of bridges and shows promising results. Although, experts had ‘some start-up difficulties’ assessing condition over time of engineering assets, combining their opinions does generate a DM (or ‘virtual expert’) which was 25 times statistically more accurate than the best performing expert. Another advantage of the proposed approach is that relatively quick results can be achieved and the need for large amounts of data by long term monitoring is eliminated. These data are expected to be gathered in the future to correct performance predictions, but are not directly applicable at this moment. Moreover, recent data mining attempts for SHM are not yet leading to the required decision support for management of engineering assets. Therefore, the proposed approach delivers a strategic benefit in terms of costs.
It should be mentioned that the performance of every individual expert might also be improved in the future by a training which extends their frame of reference and understanding of the deterioration process in different situations. The frame of reference which is used in the COTA-method is limited to experts’ experience. However, in the long term, this frame of reference will be (un)limited to data that is being collected. Hence, the data-based asset information systems that already have been applied, in combination with Artificial Intelligence systems will lead to accurate deterioration patterns for engineering assets.
References
- Biondini, F., & Frangopol, D. M. (2016). Life-cycle performance of structural systems under uncertainty: Review. Journal of Structural Engineering, 142(9), F4016001. doi: 10.1061/(ASCE)ST.1943-541X.0001544
- Colson, A. R., & Cooke, R. M. (2017). Cross validation for the classical model of structured expert judgment. Reliability Engineering and System Safety, 163, 109–120. (February), doi: 10.1016/j.ress.2017.02.003
- Cooke, R. M. (1991). Experts in uncertainty. New York: Oxford University Press.
- Cooke, R. M., & Goossens, L. H. J. (2000). Procedures guide for structural expert judgement in accident consequence modelling. Radiation Protection Dosimetry, 90(3), 303–309. doi: 10.1093/oxfordjournals.rpd.a033152
- Cooke, R. M., & Goossens, L. L. H. J. (2008). TU Delft expert judgment data base. Reliability Engineering & System Safety, 93, 657–674. doi: 10.1016/j.ress.2007.03.005
- Cooke, R. M., Wittmann, M. E., Lodge, D. M., Rothlisberger, J. D., Rutherford, E. S., Zhang, H., & Mason, D. M. (2014). Out ‐ of ‐ sample validation for structured expert judgment of Asian carp establishment in Lake Erie. Integrated Environmental Assessment and Management, 10(4), 522–528. doi: 10.1002/ieam.1559
- Davis, S. J., & Socolow, R. H. (2014). Commitment accounting of CO2 emissions. Environmental Research Letters, 9(8), 084018. doi: 10.1088/1748-9326/9/8/084018
- Frangopol, D. M., & Soliman, M. (2016). Life-cycle of structural systems: Recent achievements and future directions. Structure and Infrastructure Engineering, 12(1), 1–20. doi: 10.1080/15732479.2014.999794
- Goossens, L. H. J., & Cooke, R. M. (2005). Expert judgement—calibration and combination. Workshop on Expert Judgment, Aix-en-Provence, France.
- Goossens, L. H. J., Cooke, R. M., Hale, A. R., & Rodić-Wiersma, L. (2008). Fifteen years of expert judgement at TUDelft. Safety Science, 46(2), 234–244. doi: 10.1016/j.ssci.2007.03.002
- Hanea, A. M., McBride, M. F., Burgman, M. A., & Wintle, B. C. (2018). Classical meets modern in the IDEA protocol for structured expert judgement. Journal of Risk Research, 21(4), 417–433. doi: 10.1080/13669877.2016.1215346
- Hoel, P. G. (1971). Introduction to mathematical statistics (3rd ed.). New York: Wiley.
- IPWEA (2018). Practice Note 12.1 Climate change impacts of the useful life of infrastructure. Albion, Australia: Institute of Public Works Engineering Australasia.
- Jia, G., & Gardoni, P. (2018). State-dependent stochastic models: A general stochastic framework for modeling deteriorating engineering systems considering multiple deterioration processes and their interactions. Structural Safety, 72, 99–110. doi: 10.1016/j.strusafe.2018.01.001
- Klatter, L., & Roebers, H. (2017). Assessment of need for renewal on a multi-network level. In Life-Cycle of Engineering Systems: Emphasis on Sustainable Civil Infrastructure (pp. 1643–1649). Delft: CRC Press.
- Kobayashi, K., & Kaito, K. (2017). Big data-based deterioration prediction models and infrastructure management: Towards assetmetrics. Structure and Infrastructure Engineering, 13(1), 84–93. doi: 10.1080/15732479.2016.1198407
- Kosgodagan, A., Morales-Nápoles, O., Maljaars, J., & Courage, W. (2016). Expert judgment in life-cycle degradation and maintenance modelling for steel bridges. In Proceedings of 5th International Symposium on Life-Cycle Engineering: Life-Cycle of Engineering Systems: Emphasis on Sustainable Civil Infrastructure, CRC Press (pp. 2130–2137). doi: 10.1201/9781315375175-313.
- Kumar, R., & Gardoni, P. (2013). 16 – Stochastic modeling of deterioration in buildings and civil infrastructure. In Handbook of Seismic Risk Analysis and Management of Civil Infrastructure Systems (pp. 410–434). Cambridge: Woodhead Publishing. doi:10.1533/9780857098986.3.410
- Leontaris, G., & Morales-Nápoles, O. (2018). ANDURIL - A MATLAB Toolbox for ANalysis and Decisions under UnceRtaInty: Learning from Expert judgements. SoftwareX, VV(Ii). doi:10.18637/jss.v000.i00
- Liu, M., & Frangopol, D. M. (2004). Optimal bridge maintenance planning based on probabilistic performance prediction. Engineering Structures, 26(7), 991–1002. doi: 10.1016/j.engstruct.2004.03.003
- Miao, S. (2014). Structural health monitoring meets data mining, Doctoral Thesis. Leiden Institute of Advances Computer Science.
- Miao, S., Veerman, R., Koenders, E., & Knobbe, A. (2013). Modal analysis of a concrete highway bridge: Structural calculations and vibration-based results. In Proceedings of the 6th International Conference on Structural Health Monitoring of Intelligent Infrastructure.
- Morcous, G., Rivard, H., & Hanna, A. M. (2002). Modeling bridge deterioration using case-based reasoning. Journal of Infrastructure Systems, 8, 0342 (September). doi:10.1061/(ASCE)1076-0342(2002)8
- Neves, L. C., & Frangopol, D. M. (2005). Condition, safety and cost profiles for deteriorating structures with emphasis on bridges. Reliability Engineering and System Safety, 89(2), 185–198. doi: 10.1016/j.ress.2004.08.018
- Parlikad, A. K., & Jafari, M. (2016). Challenges in infrastructure asset management. In 3rd IFAC Workshop on Advanced Maintenance Engineering, Services and Technology AMEST 2016 (Vol. 49, pp. 185–190). Elsevier B.V. doi: 10.1016/j.ifacol.2016.11.032
- Srinivasan, R., & Parlikad, A. K. (2013). Value of condition monitoring in infrastructure maintenance. Computers and Industrial Engineering, 66(2), 233–241. doi: 10.1016/j.cie.2013.05.022
- Too, E. G., Betts, M., & Kumar, A. (2006). A strategic approach to Infrastructure Asset Management. BEE Postgraduate Infrastructure Theme Conference, 54(6), 1121–1122. doi:10.1016/S0190-9622(06)01179-0
- van Noortwijk, J. M. (2009). A survey of the application of gamma processes in maintenance. Reliability Engineering and System Safety, 94(1), 2–21. doi: 10.1016/j.ress.2007.03.019
- Van Noortwijk, J. M., & Frangopol, D. M. (2004). Two probabilistic life-cycle maintenance models for deteriorating civil infrastructures. Probabilistic Engineering Mechanics, 19(4), 345–359. doi: 10.1016/j.probengmech.2004.03.002
- Yang, S. I., Frangopol, D. M., & Neves, L. C. (2006). Optimum maintenance strategy for deteriorating bridge structures based on lifetime functions. Engineering Structures, 28(2), 196–206. doi: 10.1016/j.engstruct.2005.06.024
- Ye, Z.-S., & Xie, M. (2015). Stochastic modelling and analysis of degradation for highly reliable products. Applied Stochastic Models in Business and Industry, 31(1), 16–32. doi: 10.1002/asmb.2063
- Zhang, Y., Chouinard, L. E., Power, G. J., Tandja, M. C. D., & Bastien, J. (2018). Flexible decision analysis procedures for optimizing the sustainability of ageing infrastructure under climate change. Sustainable and Resilient Infrastructure, 9689, 1–12. doi: 10.1080/23789689.2018.1448665
Appendix
Table A1. Seed variables.
Table A2. Company names and affiliations of participating experts.
Table A3. Uncertainty judgements per expert on seed variables.
Table A4. Uncertainty judgements per expert on target variables T1–T8.
Table A5. Uncertainty judgements per expert on target variables T9–T15.
Table A6. Performance measures and weight per expert and decision maker.
Table A7. 5th, 50th and 95th percentile for DM-IW (fixed pool).
Table A8. 5th, 50th and 95th percentile for DM-IW (movable pool).