
Abstract
This paper proposes a novel method for bridge inspection that essentially digitises bridges using Light Detection and Ranging (LIDAR) so that they can be later inspected in a virtual reality (VR) environment. The work uses conventional terrestrial LIDAR together with affordable VR hardware and freely available software development kits originally intended for authoring computer games. The resulting VR app is evaluated for a case study involving a typical masonry bridge, comparing the proposed technique with traditional inspection methods. The new approach promises to be highly effective in terms of interpretation of results, accessibility to critical areas and safety of inspectors. The work represents an important step towards the creation of digital twins of important assets in the built environment. Recent bridge collapse incidents have affected local economies, traffic congestion, and in some extreme cases led to a loss of life. The work is timely as law making agencies are paying greater attention to structural rehabilitation. This paper will be of particular interest to bridge engineers, construction professionals and law makers and could lead to future revisions of bridge inspection processes and standards.
1. Introduction
State highway bridges are part of the critical transportation infrastructure and can be considered as the backbone of a nation’s economy (Merkle & Myers, Citation2006). In recent history, the construction industry experienced an exponential growth in bridge construction after the advent of new materials, technology and skills. In the USA, more than 70% of the bridges were built before 1935 (Golabi, Thompson & Hyman, Citation1993), whilst in the UK, most bridges were constructed between the 1950s and 1960s (Flaig & Lark, Citation2000). Approximately 70% of bridges in New South Wales, Australia were built before 1985 (Rashidi & Gibson, Citation2011). Due to increasing traffic loads, climatic deterioration of the structure (as a consequence of continuous environmental exposure) and natural disasters, bridges suffer damage and require rehabilitative measures for safe operation.
According to a recent survey conducted in the US, 55,710 bridges have been declared as structurally deficient and need immediate attention (Holcombe, Citation2017). Moreover, recent bridge collapse incidents in Italy, South Africa, the USA and India has forced law making agencies to pay more attention to structural rehabilitation. Failure to effectively maintain these structures can have a catastrophic effect on a nation’s economy, day-to-day activities and in the worst case, may lead to loss of life. Originally, bridge inspections were carried out as a result of an obvious incompetency or as a consequence of warnings received from sources mainly outside the bridge network system (Branco & Brito, Citation2004). However, ‘to keep good bridges good and prevent more bridges as being classified as deficient, timely inspection becomes a necessity’ (Rehm, Citation2013).
Bridge inspection techniques are broadly summarised into four categories, namely, Safety Inspection (Routine Surveillance), General Inspection, Principal Inspection and Special Inspection. Each technique varies in terms of its frequency, duration and accuracy. Safety Inspections are performed for a cursory check of highway structures that are subjected to obvious deficiencies or signs of deterioration such as collision damage to bridge supports, insecure expansion joint plates and support restraints, or spalling concrete. These inspections are undertaken at frequencies which ensure timely identification of safety related defects which might lead to accidents or high maintenance costs in the future.
Approximately 24 months after a bridge has been built, a General Inspection is carried out. This mainly focuses on a bridge’s most exposed areas and involves direct visual inspection, without the need for special access equipment or traffic management. After this, in six yearly intervals, Principal Inspection is performed. Its purpose is to provide a qualitative assessment of all the inspectable parts of a highway structure by physical examination (detailed visual inspection) within touching distance. These inspections are comprehensive and provide more detailed information than a General Inspection. If a functional flaw or defect is detected which is outside the remit of the General/Principle Inspection regime, a Special Inspection is performed. This comprises of a close visual inspection, in situ destructive, static and dynamic load tests and laboratory tests. Detailed structural analyses are carried out for dead loads, and superimposed dead loads and live loads. The strength of the structural members is determined and the allowance for future loading is also evaluated (Inspection manual for highway structures, 2007).
1.1. Motivation
Since the beginning of the US federal bridge inspection program in 1968, visual inspection has been the primary technique for assessing the serviceability and performance of these structures (Robert, Citation2007). This approach is time consuming and requires certain tools to access different elements of a bridge; which may be unsafe for the inspector or cause traffic disruption to the user. In certain cases, these tools may not be feasible specially if the geometry or location of the bridge is complicated (Bolourian, Soltania, Albahria, & Hammad, Citation2017). Drawbacks of visual inspection include interpretability of results, the static nature of inspection, difficulties regarding accessibility to critical areas and ensuring the safety of inspectors (Agdas, Rice, Martinez, & Lasa., 2015). Therefore, new automated inspection systems are required to provide a safer working environment as well as more efficient and accurate methods for bridge inspection (Liu et al., Citation2014).
The motivation of this research is to investigate whether virtual reality (VR) could be used to address the limitations and difficulties faced by engineers when carrying out visual inspection. A 3D digital inspection environment is proposed in which Light Detection and Ranging (LIDAR) images are captured and processed for display in a custom app written by the authors. This is written using the computer games authoring platform, Unity and is displayed on a Samsung Gear VR headset which uses an android smart phone for both processing and display. A typical masonry arch railway bridge is used as an example to demonstrate a promising improvement in Principal Inspection. In the paper, the hardware and software required to perform the inspection are described. Sufficient detail is provided for those readers who may wish to replicate the work. Results of the case study are presented, highlighting the advantages and disadvantages of the new approach, which will improve with the continuing development of technology over the passage of time.
2. Background
This section gives an overview of the historical development of VR systems and their application. The development of 3D scanning and its reported use in bridge inspection is also discussed. The conventional procedure for performing Principle Inspection is highlighted, with a focus on its limitations. Emphasis is placed on how VR can be used in bridge inspection to resolve these limitations.
2.1. Development of virtual reality systems
From a philosophical point of view, the desire to experience presence in an immersive simulated environment has always existed. Since the renaissance, artists and painters have used realistic imaginary to create optical illusions of 2D objects in three dimensions, submersing the viewer in an environment where they could feel part of the scene (Shields, Citation2003). In the 1900s, early cinema took this artistry one step further. In 1915, Edwin Porter and William Waddell demonstrated a 3D cinema experience using red-green anaglyph technology. The first colour stereoscopic 3D movie, Bwana Devil, was directed by Arch Oboler in 1952 and 3D movies became popular in the 1950s and 1960s (Jockenhovel, Citation2011).
The next step was the development of technology for telepresence ‘the use of technology to operate machinery by remote control or to create the effect of being at a different or imaginary location’ (Collins English Dictionary, Citation2018). In 1956, Morton Heilig, a cinematographer, built a machine called the Sensorama – the earliest VR technology that provided multimodal experiences, including 3D views, smells, sounds and vibration. Although Sensorama embodied the sense of telepresence, it was still not possible for the user to interact with the immersive environment until the development of the first head-mounted display, nicknamed ‘the Sword of Damocles’ (Sutherland, Citation1968). The helmet-like digital device could track the physical movements of the user and generate digitally composed surroundings from the user’s gaze. In 1970's, real-time interaction advanced further with the ability to render a Virtual Environment (VE) in an artificial reality laboratory (Krueger, Citation1991).
Two further important advances included the Large Expanse Extra Perspective optical system (Howlett, Citation1983) which improved the depth of view and the development of technology to facilitate physical interaction with VEs, using ‘Datagloves’ (Zimmerman, Citation1982) and (Rheingold, Citation1991). In the late 1980s, the term ‘virtual reality’ was coined (Ellis, Citation1991). It is now formally defined as ‘a computer-generated simulation of a three-dimensional image or environment that can be interacted with in a seemingly real or physical way by a person using special electronic equipment’ (McMillan, Flood, & Glaeser, Citation2017).
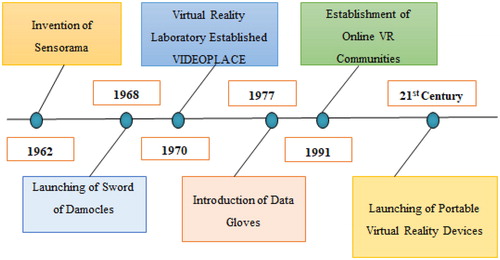
From the 1990s onwards, the World Wide Web provided tremendous potential for VR technological development by giving access to the information and virtual communities of experts (Lau, Lau, & Kan, Citation2013). Due to improvements to computer processing speeds and miniaturisation of electronics, companies such as Samsung have been able to develop mass market VR products such as the Samsung Gear VR system. Today, the market size for VR products and services is estimated to be more than $7billion. Important developments in the history of VR are summarised in .
Figure 1. Major developments in virtual reality technology.
2.2. Applications of virtual reality
VR technology has been applied to a broad range of disciplines. In aviation, VR has been used to develop virtual flight simulators (Hays, Jacobs, Prince, & Salas, Citation1992). In the military, it has been used as a recruitment tool (Zyda, Citation2005) and to create immersive combat environments for training soldiers (Lele, Citation2013). Scientists have used VR to visualise research outputs in fields such as cosmology (Bryson, Citation1993), magnetohydrodynamics (Margetts, Citation2002) and aerodynamics (Seu, Hewitt, & Margetts, Citation2018), significantly improving scientific insight and interpretation. VR has also been used in journalism to increase the impact on the audience of a news story (Goldman, Citation2018) as well as healthcare and medicine, for example, the treatment of post-traumatic stress disorder (Leadem, Citation2016). In the retail sector, businesses such as Walmart are increasingly using VR to train their employees in a virtual classroom before they start a new role (Feloni, Citation2017).
Applications in the engineering sector are also broad, ranging from training for nuclear safety (Shuster, Citation2010) to decision-making in the construction industry for construction management (Sampaio, Ferreira, Rosário, & Martins, Citation2010), site design (Harrison, Sletner, Preble, Harrison, & Anderson, Citation2015), planning (Comunale, Citation2017) and inspection (Omer, Hewitt, Mosleh, Margetts, & Parwaiz, Citation2018). It is also used for evaluating the processes of assembly and maintenance in manufactured products (Shiratuddin & Zulkifli, Citation2001). In the field of transportation, VR is being used to understand traffic densities and flow patterns, enabling engineers to design optimal layouts for highways, signalling and crossings (Jin, Yan, & Ito, Citation2007). VR is used to forecast possible damage due to floods, earthquake or geological disasters (Eon, Citation2018). Architects use VR to effectively communicate their ideas to their clients, showing them features such as building elevation, terrain and interior decoration.
In the construction industry, VR is used to render 4D models (3D + time), assisting engineers and managers in many phases of construction projects, from initial design through to final construction. Without this technology, many problems may arise due to the inability of stakeholders to visualise their projects before they are built. As a consequence, work may have to be stopped or plans altered leading to time and cost inflation. VR is used to provide the client and construction team with an immersive experience of the project before it is built. Potential conflicts in the design and changes in the architectural plans can be modified before there is an issue. Construction engineers can ‘walk inside’ the VE and view all the utilities systems installed enabling them to identify any issues that may be easily overlooked when viewed on a 2D screen. VR also puts clients in a better position to confirm if their idea resembles the work proposed to be carried out on site (Comunale, Citation2017).
In summary, the literature shows that VR is becoming an essential technology that has a promising future in every discipline. There is evidence that VR is seeing growing use in this sector. A recent study carried out by ARC confirmed that 65% of civil engineering firms agreed that VR improved visualisation of projects and has potential in design and construction practice (Brown, Citation2017). The main application areas of VR are summarised in . This review confirms that the work presented herein is the first time that VR has been evaluated for bridge inspection.
Table 1. Applications of virtual reality.
2.3. 3D Scanning
The first reported attempts at 3D scanning were carried out in 1953 by the US military who began experimenting with an optical measuring device using light and high-speed shutters (Newton, Citation2017). Around the same period of time, the Ferranti Company of Scotland released a dual axis electronic probing machine called the Coordinate Measuring Machine that was entirely mechanical and relied on physical contact (i.e. did not use light).
Nowadays, there are a variety of light-based contactless scanning systems available on the market. Cheaper devices use conventional or pulsed lamps with a high-speed shutter. More expensive systems, such as LIDAR, use laser light and have been developed for more accurate range measurement. The first reported use of LIDAR was in the early 1960s, initially for atmospheric studies by the US Military (Molenby, McMananmon, & Kobayashi, Citation2016). In 1969, a laser rangefinder was used to determine the distance between earth and moon using a target mounted near the spacecraft, Apollo 11 (Woods, Citation2011).
A basic LIDAR system consists of a transmitter, a receiver and a signal-processing unit (Liu, Chen, & Hasuer, Citation2012). A pulsed or continuous light is emitted from the transmitter to the target object and a part of it is reflected back to the receiver. By multiplying the speed of light with its travel time, the two-way distance between the scanner and the object can be calculated. Until the 1980s, LIDAR systems used only a single line of data to scan objects and produced a point cloud as a cross-sectional profile. Thus, the system had limitations for covering wide areas. Early in the 1980s, the ‘stripe’ method of optical scanning was developed which was faster and more accurate than ‘point’ or ‘area’ methods.
After 1985, scanners used white light, lasers and shadowing to capture a given surface (Ebrahim, Citation2014). In 1992, the French company MENSI (now a Trimble company) introduced the S-series 3D laser scanners, primarily for use in industrial applications such as nuclear power plants. In 1996, 3D scanners perfected the design with ModelMaker, a combination of manual digitisation and stripe laser scanning. It was able to accurately produce complex models and digitise those models with texture and colour.
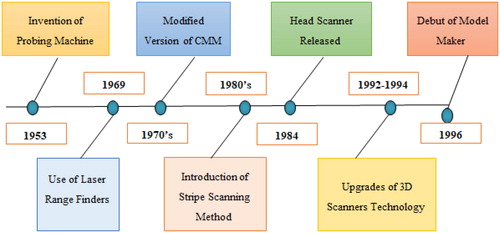
These early systems were incredibly slow and imperfect but compared to manual surveying and measurement techniques routinely employed at the time, it was a huge step forward. The recent explosion in computing power has seen improvements in resolution and speed for a reasonable budget, facilitating the uptake of 3D scanning in the mechanical, automotive and civil engineering sectors. The technological development of 3D scanners over time is summarised using the timeline in .
Figure 2. Historical development of 3D scanners.
2.4. Use of LIDAR in bridge engineering
The latest imaging technology is being continually adopted in the field of bridge engineering. For example, image analysis algorithms have been used to automatically identify defects in engineering structures (Adhikari, Moselhi, & Bagchi, Citation2014; Hampel & Maas, Citation2009; Hutchinson & Chen, Citation2006). Typically, these techniques rely on photography and are influenced by lighting conditions. In some cases, they require additional supplementary information (Laefer, Truong-Hong, Carr, & Singh, Citation2014). Terrestrial LIDAR scanning is nowadays a standard technique used in bridge health monitoring (Gisresources, Citation2016). Compared with photography, the imaging is more accurate and can be used to quantify 3D information such as mass loss (Teza, Galgaro, & Moro, Citation2009) as well as the depth of defects (Byrne, Pakrashi, Schoefs, & Ghosh, Citation2014; Mizoguchi et al., Citation2013).
LIDAR has also been used to measure the vertical deflection of bridges under loading conditions (Lichti & Harvey, Citation2002) and acquire the geometry of historical arch bridges (Riveiro, Arias, Armesto, Rial, & Solla, Citation2008). In some cases, the 3D scans are combined with close range photogrammetry (Riveiro, Jorge, Varela, & Jauregui, Citation2013), enabling the detection of degenerated surfaces (biological crust, cracking, spalling or volume loss) based on the analysis of point-based coordinates and the RGB values of point clouds (Hong, Laefer, & Debra, Citation2014). Whilst these are important milestones, prior to the research presented herein, no other authors in the field of structural engineering have reported the use of interactive VR environments to display or examine 3D scans and photogrammetry data.
2.5. Conventional procedure to carry out principal inspection
A detailed review of the Principal Inspection technique was recently carried out by the authors (Omer et al., Citation2018), so only a brief overview is provided here. Primarily, the aim of Principal Inspection is to observe and record areas of stress concentration using rough sketches, photographic evidence and drawings. The general procedure adopted before conducting an inspection is to study all relevant structural drawings available, any past inspection records or repair work on the bridge. Whilst conducting an inspection, any difference between the intended use of a structure when it was first constructed and how it is used now must be recorded.
The National Bridge Inspection Standards – NBIS (Thompson, Shepard, & AASHTO, Citation2000) divides bridges into four main structural units: superstructure, substructure, deck slab and culverts. These units are further divided into elements depending on the details of inspection required. Grades ranging from 1 to 9 are attributed to each of the four main parts of the bridge. The grades describe the level of deterioration, for example, grade 9 is given for a bridge without any damage and defects, whilst grade 0 indicates a bridge that has deteriorated to such an extent that it can no longer be repaired. Once all the elements are graded, an overall grade for the bridge is determined and this is checked against national standards to determine the severity index of attention (Federal Highway Administration, Citation2004). In Principal Inspection, the precision and accuracy of the assessment can vary according to the professional qualifications, motivation and inspection equipment of those who actually carry out these inspections.
2.6. Proposed principal inspection technique using virtual reality
The research presented herein proposes the combined use of VR and LIDAR as a novel tool for the inspection of bridges and demonstrates its use for a typical masonry bridge. Terrestrial LIDAR is used to digitise the geometry of a selected masonry bridge. This results in a point cloud where each point has x, y, and z coordinates together with an RGB intensity value. The point cloud is rendered to produce surfaces, using post-processing software, which is then ported to a VR environment which depicts a real-world scenario. The vision is that engineers could perform Principal Inspection in VR, overcoming the drawbacks discussed earlier that are associated with conventional techniques, thus, improving the overall standard of Principal Inspection. It is intended that the proposed methodology will contribute to a revision of the industrial standards of Principal Inspection. Instead of the office going to bridges, the bridges come to the office.
3. Method
This section outlines the details of the experimental setup. First, the vendor specifications for each type hardware and software used are described. Next, the location and details of the masonry bridge under study are presented. Finally, the pre-processing and post-processing stages of the newly proposed inspection technique are explained.
3.1. Hardware
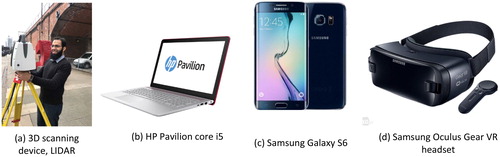
The hardware used included a Leica Scan Station P40 laser scanner, a Samsung Galaxy S6 smart phone, a Samsung Oculus Gear VR headset with a remote control and a HP Pavilion laptop running the windows operating system. The Leica Scan Station P40 is used to capture a 3D scan of the bridge. It weighs 12.25 kg and has dimensions of 238 mm × 358 mm × 395 mm. The data are captured at a rate of 1,000,000 points per second (Leica Geosystems, Citation2018). The most important technical details of the Leica Scan Station P40 are listed in .
Table 2. Details of Leica Scan Station P40.
The authors have written their own custom VR application for Principal Inspection. The VR app is run on a Samsung Galaxy S6 smart phone with a storage capacity of 32 GB; a 5.1 inch screen with a resolution of 1440 × 2560 pixels; 3 GB of random access memory and a built-in microUSB 2.0 port for charging and connecting to the Samsung GEAR VR headset. For online networking and connecting to the Oculus store, the device has a WLAN Wi-Fi connection. The smart phone used for this research used version 7.0 of the Android operating system (Samsung, 2015).
A Samsung Gear VR Headset was used to view the VR app. The headset reproduces media content at a refresh rate of 60 Hz or above. The display has an aspect ratio of 16:9, a field of view of 101° and a lens resolution of 2560 × 1440 pixels. Head movements and position data are captured by the headset using a built-in accelerometer, gyro sensor and proximity sensor. User interaction with the VR environment can be controlled using a remote control connected by bluetooth. The headset is lightweight (345 g excluding the weight of the smart phone) and has physical dimensions of 207 mm × 102 mm × 98 mm (Samsung Oculus, Citation2017).
Writing the VR app and pre-processing the imaging data are carried out using an HP Pavilion Core i5 workstation running the 64-bit Windows 10 operating system. The system has 4 intel(R) core (TM) i5-6200 CPU @ 2.30 GHz processors. To ensure smooth operation of software, the system has an internal memory (RAM) of 12 GB. An AMD Radeon (TM) R5 M430 graphics card is attached in addition to the Intel(R) HD Graphics 502 chip. The computer has an overall storage capacity of 500 TB which was more than enough to store the processed data. All the hardware devices used in the project are shown in .
Figure 3. Hardware device used in proposed technique of inspection.
3.2. Software
Several different software packages were used for processing the data and building the VR app. Leica’s Cyclone REGISTER 360 version 1.4.3 was used to register, edit and downsize the raw scan data. Unwanted areas of the scan were cropped and the resulting point cloud was exported in .pts format for further processing. Cloud Compare v2.91.1 was used to convert the point cloud from .pts to .ply format. The VR app for Principal Inspection was developed using Unity 2017.2, a GUI based software development platform which uses a simplified C# coding language. The software is typically used to develop video games for web plugins, desktop platforms, consoles and mobile devices. It can import 2D/3D models from CAD packages and other drafting software. Another important capability relevant to writing VR apps is that Unity supports adding VR features such as teleportation and navigation.
3.3. Developing a Unity application
In order to view architectural models and point clouds in the VR headset, a number of steps are required. Architectural models can be created using AutoCAD 2017 and exported as a .fbx file; a proprietary format for 3D models. To import a point cloud, a script is used to read the point cloud (saved in .ply file format) and then each point is plotted within Unity. Once the architectural model and/or point cloud is loaded into Unity’s scene, the initial position of the camera is set manually. Extra coding is required to enable the user to navigate in the scene using a button on the bluetooth controller. Once the scene creation has been completed, specific settings are chosen in Unity to be able to export the scene within an app for viewing on the VR headset. For example, Unity needs to know that it is building an app for the Android operating system so that it is compatible with the Samsung Galaxy S6 smart phone. Furthermore, additional plugins such as the Android SDK Manager and Java Runtime need to be installed in Unity.
A variety of different texture compression methods are available that can be used to reduce the memory requirements of the app. In this work, the Adaptable Scalable Texture Compression (ASTC) texture compression method has been used. This preserves the quality of the model, which is an important requirement if the VR app is to be used to examine features such as cracks. Unlike other compression methods, ASTC uses variable block sizes to store the data instead of a single block size, ensuring that the quality of the graphics is preserved (Microsoft, Citation2018).
The software development involves choosing appropriate ‘player settings’ in Unity for features such as ‘resolution scale mode’ and ‘presentation’. The frame buffer alpha value is not fixed to a specific value as this will either turn all objects to completely opaque or completely transparent. The ‘resolution scale mode’ is kept to its default value of ‘disabled’, which minimises memory requirements. Another important option ‘build type’ is set to ‘always’ which ensures all the rendering takes place whilst the app is being loaded. In terms of user experience, this ensures that there is an uninterrupted display of the scene the moment application executes. The ‘aspect ratio’ is set to ‘wide screen’ as the Samsung Gear VR can only display applications in wide screen mode. Similarly, the setting ‘orientation’ must be set to ‘landscape’ for the same reason. The option ‘32-bit buffer display’ is used to improve the quality of the graphics. The ‘splash image’, which is a welcome screen displayed before the execution of the app, is disabled to reduce memory requirements. ‘Colour space’ is set to ‘gamma’ as ‘linear’ is not supported by smart phones.
Some other key settings in Unity include: setting the API to ‘auto graphic’; enabling ‘multithread rendering’ (to speed up building the app); setting the minimum API level to Android 5.0; selecting ‘Oculus’ from the ‘XR’ options (which ensures Unity builds a VR app for the Samsung GEAR VR headset) and giving the app a name, setting ‘model package name’ to ‘.com.Manchester.bridgeinspection’.
The final step is to sign up the application with the Oculus store, which requires the provision of a file with device information that is added to Unity’s asset panel (where all the scenes are saved). After completing all the steps, the scene is debugged and if no errors are found, the file is directly ported to the smart phone by pressing the export button in the player settings menu.
3.4. Case study of a masonry bridge
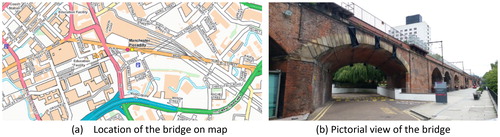
A typical masonry bridge was selected to evaluate the proposed VR technique for Principal Inspection. The bridge is located in Manchester, UK and has global coordinates (according to the Universal Transverse Mercator (UTM) system) of 550841.02 m E, 5925414.12 m N in zone 30U. The bridge is a typical railway masonry arch bridge, made of red bricks and over 100 years old (). Due to its extensive use and age, the bridge has already been subjected to external strengthening and is still subject to regular maintenance by the local authorities. A map showing the location of the bridge, together with a photograph is shown in .
Figure 4. Elevation and sectional view of the masonry bridge.
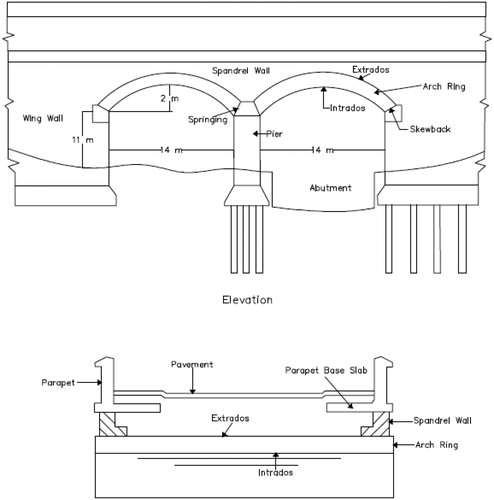
Figure 5. Railway network bridge Manchester, United Kingdom.
3.5. Proposed workflow of inspection
In this section, the proposed workflow is written in the style of a set of procedures, which highlights that much of the process is similar to Principal Inspection. The first and foremost step is to schedule an inspection based on the availability of resources, traffic management and weather conditions. The next step is to prepare a method statement which summarises the details of all the activities to be performed on site, specifically any safety procedures and details of traffic management. Upon arrival on site, a careful check should be carried out to confirm the identity of the structure.
Once the structure and all precautionary measures have been confirmed, the LIDAR is attached to the tripod stand and levelled at the specified location of interest. The height of the LIDAR is measured and its position on the ground is recorded. The angle of the scan is set to between 0° and 360°. The desired scan resolution and sensitivity is set to ‘12 mm’ and ‘low’, respectively. A point cloud and its corresponding image are selected as the output option from the scanner. To fully capture all the defects, the LIDAR is placed at three different locations and three data sets are collected. To help combine the data sets later, markers are placed on site in positions where they are visible in all three scans. The data are stored in a pen drive for later post-processing.
The point cloud is saved in the proprietary .bin format and the associated photographic images are captured in .jpg format. The two datasets are co-registered using the Cyclone REGISTER 360 software version 1.4.3. In the software, general settings such as ‘units’; ‘number of decimal places’; ‘link’ settings (to customise the error threshold) and ‘cloud-to-cloud’ settings are set to default values. Using the height of the LIDAR and its recorded location, using markers on the ground as reference points, the point clouds are combined and superimposed with the photographic images. Unwanted points and noise are manually deleted from the scan. The final cleaned up dataset is then saved in the .pts format for further processing.
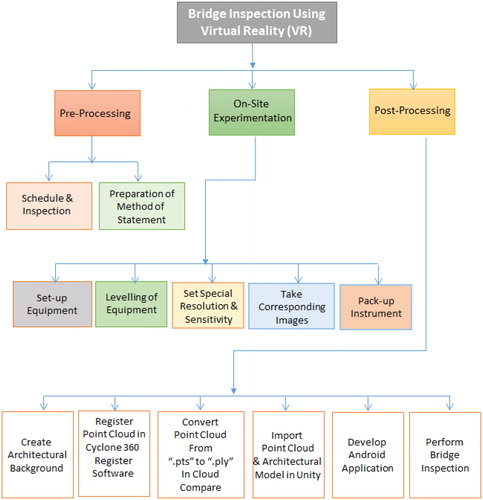
The file conversion from .pts to .ply (needed to import the data into the VR app) is carried out using Cloud Compare which reads the x, y and z coordinate values as well as the RGB intensity data for each point from the .pts file. The point cloud is enhanced to brighten the view and is then exported in the .ply format. In the final step, the point cloud file is imported into Unity. Interaction features such as navigation and teleportation are added to the scene and the appropriate app settings are applied. Once all the settings are finalised, the file is exported to the Samsung Galaxy S6 smart phone. The bridge can now be inspected in the Samsung Gear VR headset. Results and conclusions from the inspection are drawn and evaluated using the element condition rating system as defined in the CSS Guidance Documents. These results are then reported to the authorities concerned for further action. The entire workflow procedure is summarised in the flow diagram shown in .
Figure 6. Flow diagram of visual inspection procedure.
4. Results
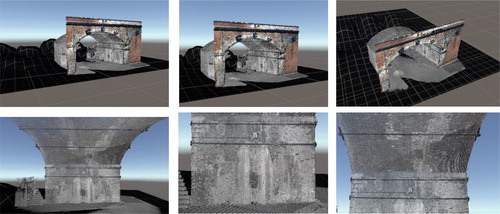
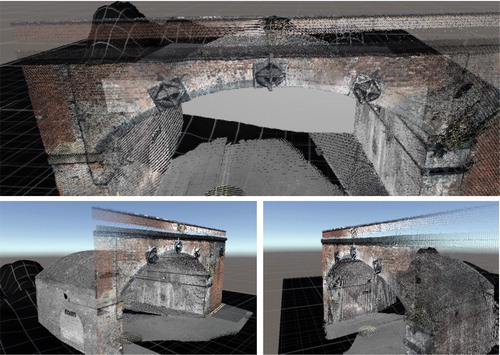
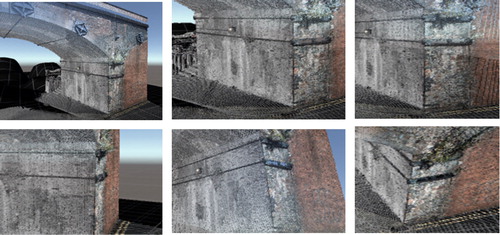
Different views of the bridge displayed in the virtual world are shown in . The bridge is essentially a digital twin. When wearing the headset and immersed in the VR experience, the inspector is completely disconnected from the real world and can focus on carrying out an accurate inspection, safely and with no distractions. lists the most important tasks carried out during Principal Inspection and assesses the possibility of using the proposed technique. As can be seen in and , most of the features are visible with the naked eye. These are highlighted by white circles and white rectangles in and , respectively. Some require further post-processing.
Figure 7. Multiple views of the bridge replicated in a 3D VR environment.
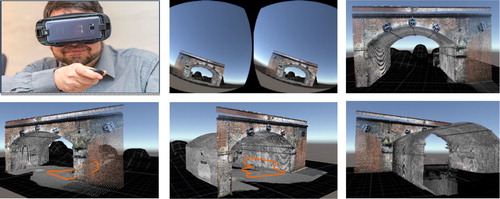
Figure 8. Visible features in proposed inspection technique.
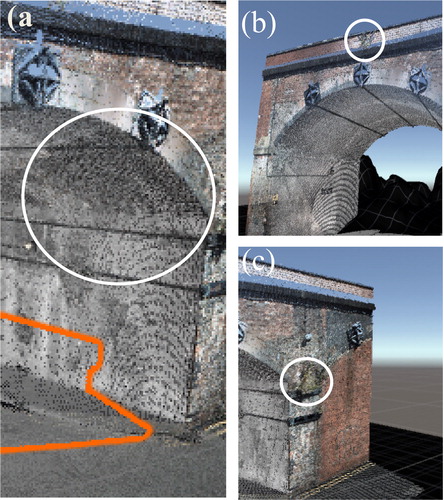
Figure 9. Visible features with current inspection technique.
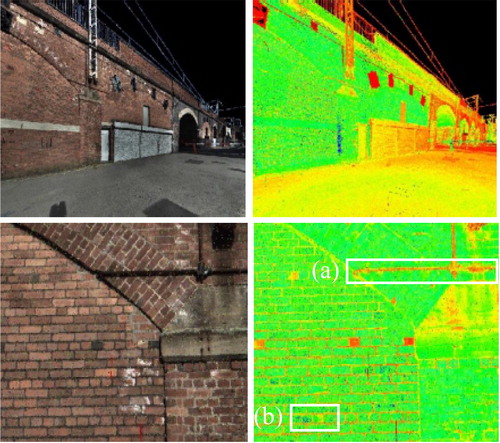
Table 3. Assessment of feature visible in proposed technique.
Features typical of an inspection, such as identifying the presence of water and assessing its effects on the fabric of the bridge can be clearly identified, particularly through the decolourisation of the masonry bricks. Furthermore, areas of leaching are also easily noted by recognising variations in the texture of the bridge. The presence of mortar and areas of mortar loss are also clearly visible in the virtual world, as are eroded surfaces and open joints in the bridge. These are important as they affect the strength of the structure. Vegetation, including lichen and other visible colonies of micro-organisms (which might be indicative of internal deterioration) are also captured and visible in the app. Notably, all of these features are easily spotted when inspecting the bridge using the proposed VR technology.
Based on the case study performed, the feasibility of the proposed technique in terms of implementation, time and cost is evaluated by a subjective comparison of bridge inspection in VR with bridge inspection using conventional tools. The comparison in uses adjectives to highlight the relative merits of each approach. Using VR, important elements of inspection such as navigation, access to critical areas, interpretation of results and lighting problems are greatly improved. For example, as the bridge has a clear height of 13 m, using the traditional inspection technique to inspect one of the critical areas such as the connection between the arch ring and piers, requires the use of special cranes or scaffolding. In VR, the zero gravity navigation feature enables easy access to any part of the bridge, regardless of accessibility in the real world.
Table 4. Critical comparison of Principle Inspection using VR.
From the time and cost point of view, the fact that this bridge is a main railway network bridge, connecting Manchester with other cities, becomes significant. A thorough inspection of such a long bridge may take weeks due to surrounding obstacles such as buildings and slow movement of the inspector(s). In VR, any obstacles are removed at the post-processing stage, allowing faster and easier navigation. In the traditional inspection, the arch was subject to poor lighting conditions, due to shadows from surrounding buildings, making it difficult to detect defects. In VR, visibility is enhanced by artificial lightning. In traditional inspection, additional lightning can be deployed, but this would have a further impact on time, cost and logistics.
Interpretation of results is also improved as the findings can be shared with other bridge inspectors; even those who have never visited the real site. In traditional inspection, only a few engineers visit a site. Weather, lighting and other factors such as fatigue may affect their judgment on the day of inspection. The VR bridge can be conveniently revisited again and again. On the basis of the case study presented, it is demonstrated that the VR inspection technique offers several advantages over traditional inspection. Since the technique is newly proposed, industrial implementation is yet to be recognised and future advances in LIDAR, computing and VR will improve its effectiveness.
5. Discussion
The accuracy and reliability of documentation generated during the inspection of a bridge plays a key role in the allocation of resources for construction and maintenance. Whilst Principle Inspection is one of the most important inspection techniques, it currently relies purely on subjective assessments made by the inspectors. This could lead to an inaccurate assessment of the structure and colossal losses. It is the responsibility of the research community to discover novel and objective ways in which inspection could be improved.
The presence of cracks plays a vital role in the performance of a structure. For masonry bridges, cracks may occur at abutment joints, piers, arches, spandrel beams and arch keys. Specific details about the cracks, such as their position, orientation and length are of particular importance. Furthermore, differential movements in the bridge structure also need to be noted. These movements manifest themselves in the form of distortion of the overall shape, misalignment of bricks, tilting, bulging and ring separation. Other features such as open joints, degree of wetness, mortar loss, signs of leaching or chemical attack, eroded surfaces and presence of vegetation must also be noted (McKibbins, Melbourne, Sawar, & Gallard, Citation2006).
Once a scan has been obtained, these features could be detected and described automatically. For example, image processing techniques could be used to estimate the thickness of the mortar or detect cracks; a tedious job if done manually. In conventional Principal Inspection, cracks are sketched and measured manually. This methodology lacks objectivity and reliability in terms of quantitative analysis (Mohan & Poobal, Citation2017).
In the literature, there are many papers that describe various types of image processing technique that can be used to automatically detect and quantify crack parameters based on LIDAR images (Hutchinson & Chen, Citation2006; Tong, Guo, Ling, & Yin, Citation2011). Crack detection can be carried out using directional filters (Mohajeri & Manning Citation1991); analysis of variations in brightness (Miyamoto, Konno, & Bruhwiler, Citation2007) and texture analysis (Chanda et al., Citation2014). Features such as degree of wetness and leaching, which are dependent on colour variation, can also be quantified using MATLAB image processing algorithms. Other features of inspection such as geometric measurement of the bridge and differential movements are also recorded manually and lack accuracy in current inspection procedures. Automated methods are already developed and in practice to measure these parameters (Hong et al., Citation2014).
The limitations of conventional Principal Inspection which still remain a problem include: accessibility to critical areas; interpretation of results; time and safety or visibility issues when working on an irregular terrain or in dark areas. In some cases, the inspection process is also affected by weather conditions or traffic conditions if inspection takes couple of weeks (for landmark bridges). With the proposed VR technique, not only are all the features of inspection visible but they can become more prominent when using colour enhancing algorithms adopted during the post-processing stages. In the real world, lighting might be a concern if a bridge is inspected in a remote area where electricity is absent or power lines are not properly laid-out. This problem is solved using artificial lighting effects in the virtual world to ensure all areas become equally visible; as shown in . Moreover, problems such as traffic disruption are also eliminated as these factors are controlled in the virtual world. The method improves the quality of inspection as shown in , by allowing seamless navigation to all parts of the virtual world. Inspection also becomes less time consuming and travelling cost reduces as the inspector does not need to travel to the bridge. The data collection could be contracted out to a third-party service.
Figure 10. Artificial lighting in the VR environment keeps the weather always sunny. Defects become more prominent and saves lighting costs, especially in areas where inspection takes place in darker areas such as tunnels, under water bridges or bridges.
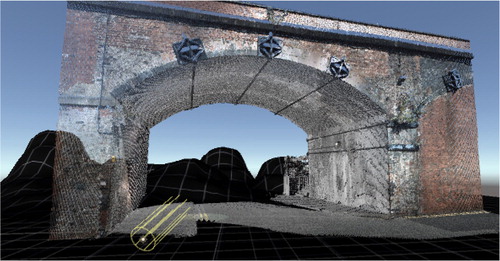
Figure 11. Undisrupted zero gravity navigation in the VR application makes movement flexible, fast and effortless.
Using the proposed VR technique, accessibility to critical areas and the safety of the inspector is ensured. The inspector can travel anywhere in the virtual world to closely inspect areas of interest, particularly joint connections or the arch ring as shown in without any safety concerns. Normally, these places are difficult to access and require special cranes to lift an engineer or a scaffolding arrangement. Engineers are not trained to work in such a manner and this can lead to accidents or life taking injuries if safety procedures are over looked.
Figure 12. Critical areas become accessible such as the arch ring, the most critical element of masonry bridges required for load transfer, without scaffolding or any crane lifting.
More importantly, the key findings from inspections carried out in VR are likely to be consistent and repeatable; overcoming one of the main problems of conventional Principal Inspection. Multiple engineers can perform the inspection of a bridge at the same time. Areas of interest can be viewed from different angles and discussed amongst engineers using VR multi-networking capability to accurately assign a condition rating based on a collaborative decision (see ). Moreover, data transmission via satellite also allows bridge data capture for the remote assessment of bridges located in difficult to access regions of the world; especially important in disaster relief efforts.
Figure 13. Interpretation of results becomes accurate as defects of interest can be viewed from multiple angles and can be discussed amongst inspectors using VR networking facility.
Despite of all the promising features, there are also some drawbacks associated with proposed inspection technique. Cheap VR hardware has limited memory size and processing speed. The image data sets need to be down sampled or compressed for smooth execution of the application. This limitation means that it is not currently possible to process large data sets and maintain good quality graphics simultaneously. In the future, smart algorithms or techniques such as machine learning could be used to address these limitations. Other hardware could be used, for example, the HTC Vive, a powerful VR device that has enough memory to process large data sets. However, this is a considerably more expensive option than the Samsung GEAR VR. 3D scanning devices are also expensive and require training to operate. Furthermore, they are currently limited to a minimum feature size of around 2–3 mm, which needs to be improved to be able to better capture some details. That said, the advance of technology is towards more powerful and cheaper hardware and software.
6. Conclusions
Technologically, the main contribution of this paper is the development of a VR application for bridge inspection using affordable devices running the android operating system such as smart phones. The application supports the import of a LIDAR scan of a bridge that can be used for inspection and as an accurate historical record of the state of a bridge at a moment in time. The application includes head tracking via the headset and navigation controls through a hand-held controller linked to the headset using bluetooth communication protocols.
The five key advantages to using VR over traditional inspection are as follows:
Inspection becomes less time consuming with lower travel costs as the inspector does not need to travel to the bridge; data collection could be contracted out to a third-party.
As bridges are very large, even in a VR environment, time for navigation and inspection is reduced by allowing the inspector to be teleported to locations of interest.
The inspector can travel anywhere in the virtual world to inspect normally inaccessible areas of interest without the use of cranes or climbing gear, improving safety.
Artificial lighting effects in the virtual world ensure all areas become equally visible. In the real world, lighting might be a concern where electricity is absent.
The key findings from inspections carried out in VR are likely to be consistent and repeatable; overcoming one of the main problems of conventional Principal Inspection.
From a practical point of view, this research represents a step towards addressing the limitations and difficulties faced by engineers when undertaking Principal Inspection. For the first time, VR is being used as an inspection technique, unlocking new possibilities as well as raising the standard of bridge evaluation. Instead of the office going to the bridge, the bridge is coming to the office.
Acknowledgements
The authors would like to thank the School of Engineering at the University of Manchester for investing in the hardware and software required for this project.
Additional information
Funding
References
- Adhikari, R., Moselhi, O., & Bagchi, A. (2014). Image-based retrieval of concrete crack properties for bridge inspection. Automation in Construction, 39, 180–194. doi: 10.1016/j.autcon.2013.06.011
- Agdas, D., Rice, J. A., Martinez, J. R., & Lasa, I. R. (2015). Comparison of visual inspection and structural-health monitoring as bridge condition assessment method. American Society of Civil Engineers, 26(4), 371–376.
- Bolourian, N., Soltania, M. M., Albahria, A. H., & Hammad, A. (2017). High level framework for bridge inspection using LiDAR-equipped UAV.In The 34th International Symposium on Automation and Robotics in Construction (ISARC), Taipei, Taiwan, June 28th to July 1st, 2017.
- Branco, F. A., & Brito, J. (2004). Handbook of concrete bridge management. ASCE Press, Reston,Virginia, USA.
- Brown, M. (2017). Virtual reality engineering in business applications, wondershare. Retrieved from https://filmora.wondershare.com/virtual-reality/virtual-reality-use-in-engineering.html
- Bryson, S. (1993). Virtual reality in scientific visualization. Computers & Graphics, 17(6), 679–685. doi: 10.1016/0097-8493(93)90117-R
- Byrne, M. O., Pakrashi, V., Schoefs, F., & Ghosh, B. (2014, July). A comparison of image-based 3D recovery methods for underwater inspections. In 7th European Workshop on Structural Health Monitoring, La Cité, Nantes, France.
- Chanda, S., Bu, G., Guan, H., Jo, J., Pal, U., Loo, Y. C., & Blumenstein, M. (2014). Automatic Bridge Crack Detection — A Texture Analysis-Based Approach, 6th IAPR TC 3 International Workshop on Artificial Neural Networks in Pattern Recognition, New York, USA, October 6-8, 2014.
- Collins English Dictionary (2018). Telepresence definition and meaning, Retrieved from https://www.collinsdictionary.com/dictionary/english/telepresence
- Comunale, A. (2017). Building the future: Virtual reality in the construction industry. Retrieved from https://www.vrfocus.com/2017/10/virtual-reality-in-the-construction-industry/
- Ebrahim, M. A. B. (2014). 3D laser scanner: History, applications and future (PhD thesis). Retrieved from https://www.researchgate.net/publication/267037683
- Ellis, S. (1991). Nature and origin of virtual environments: A bibliographic essay. Computing Systems in Engineering, 2(4), 321–347.
- Eon, R. (2018). Virtual disaster preparedness. Retrieved from https://www.eonreality.com/portfolio-items/virtual-disaster-preparedness/
- Federal Highway Administration (2004). National bridge inspection standards, US Department of Transportation, Washington DC, 23(650).
- Feloni, R. (2017). Walmart is using virtual reality to train its employees. Retrieved from http://uk.businessinsider.com/walmart-using-virtual-reality-employee-training-2017-6
- Flaig, K. D., & Lark, R. J. (2000). The development of UK bridge management systems. In Proceedings of Institution of Civil Engineers Transportation, ICE Proceedings, London, UK. 144(2), 99–106.
- Gisresources (2016). LIDAR technology for monitoring bridge structure defect and health, Retrieved from http://www.gisresources.com/LIDAR-technology-monitoring-bridge-structure-defect-health/
- Goldman, N. (2018). Nonny De La Pena: Pioneering VR and immersive journalism, VFXV Society. Retrieved from http://vfxvoice.com/nonny-de-la-pena-pioneering-vr-and-immersive-journalism/
- Hampel, U., & Maas, H. (2009). Cascaded image analysis for dynamic crack detection in material testing. ISPRS Journal of Photogrammetry and Remote Sensing, 64(4), 345–350. doi: 10.1016/j.isprsjprs.2008.12.006
- Harrison, R., Sletner, S., Preble, S., Harrison, A., & Anderson, T. (2015). Introduction: A 21st century approach to site design. Retrieved from http://www.rhsdplanning.com/LandDevelopmentBeyond2015.pdf
- Hays, R.T., Jacobs, J.W., Prince, C., & Salas, E. (1992). Requirements for future research in flight simulation training: Guidance based on a meta-analytic review. International Journal of Aviation Psychology, 2(2), 143–158. doi: 10.1207/s15327108ijap0202_5
- Holcombe, M. (2017). More than 55,000 bridges in the US need repair, CNN. Retrieved from https://edition.cnn.com/2017/02/15/us/structural-deficient-bridges-trnd/index.html
- Hong, T., Laefer, L., & Debra, F. (2014). Application of terrestrial laser scanner in bridge inspection: Review and an opportunity, International Association for Bridge and Structural Engineering (IABSE) 40(1), 67–77.
- Howlett, E.M. (1983). Wide angle color photography method and system, LEEP Systems, Waltham, USA.
- Hutchinson, T.C., & Chen, Z. (2006). Improved image analysis for evaluating concrete damage. Journal of Computing in Civil Engineering, 20(3), 210–216. doi: 10.1061/(ASCE)0887-3801(2006)20:3(210)
- Inspection manual for highway structures. (2007). London: TSO.
- Jin, D., Yan, F., & Ito, Y. (2007). Applications of virtual reality to civil and architectural engineering projects, Internations sympsium on innovation and sustainability of structures in Civil Engineering, Shangai, China, November 28-30, 2007.
- Jockenhovel, J. (2011). What is it if it’s not real? It’s genre–Early colour film and digital 3D. Cinemascope, 7(15), 1–14.
- Krueger, M.(1991). Virtual Reality II 2nd edition, Addison-Wesley Professional, Boston, U.S.
- Laefer, D. F., Truong-Hong, L., Carr, H., & Singh, M. (2014). Crack detection limits in unit based masonry with terrestrial laser scanning. NDT & E International, 62, 66–76. doi: 10.1016/j.ndteint.2013.11.001
- Lau, H., Lau, K., & Kan, C. (2013). The future of virtual environments: The development of virtual technology. Computer Science and Information Technology, 1(1), 41–50.
- Leadem, R. (2016). 10 amazing uses of virtual reality, FOX NewsUS. Retrieved from http://www.foxnews.com/us/2016/08/22/10-amazing-uses-virtual-reality.html
- Leica Geosystems (2018). Leica ScanStation P30/P40: because every detail matters. Retrieved form https://leica-geosystems.com/en-gb/products/laser-scanners/scanners/leica-scanstation-p40–p30
- Lele, A. (2013). Virtual reality and its military utility. Journal of Ambient Intelligence and Humanized Computing, 4(1), 17–26. doi: 10.1007/s12652-011-0052-4
- Lichti, D. D., & Harvey, B. R. (2002). The effects of reflecting surface material properties on time of flight laser scanner measurements. In Symposium on Geospatial Theory, Processing and Applications, Ottawa, Canada.
- Liu, W., Chen, S.-E., & Hasuer, E. (2012). Bridge clearance evaluation based on terrestrial LIDAR scan. Journal of Performance of Constructed Facilities, 26(4), 469–477. doi: 10.1061/(ASCE)CF.1943-5509.0000208
- Liu, P., Chen, A. Y., Huang, Y.-N., Han, J.-Y., Lai, J.-S., Kang, S.-C., Wu, T.-H., Wen, M.-C., & Tsai, M.-H. (2014). A review of rotorcraft unmanned aerial vehicle (UAV) developments and applications in civil engineering. Smart Structural Systems, 13(6), 1065–1094. doi: 10.12989/sss.2014.13.6.1065
- Margetts, L. (2002). Parallel finite element analysis (PhD thesis). University of Manchester, Manchester, UK.
- McKibbins, L. D., Melbourne, C., Sawar, N., & Gallard, C.S. (2006). Masonry arch bridges: Condition appraisal and remedial treatment. CIRIA C656, London, UK.
- McMillan, K., Flood, K., & Glaeser, R. (2017). Virtual reality, augmented reality, mixed reality, and the marine conservation movement. Aquatic Conservation: Marine and Freshwater Ecosystems, 27, 162–168. doi: 10.1002/aqc.2820
- Merkle, W.J., & Myers, J.J. (2006). Load testing and load distribution response of Missouri bridges retrofitted with various FRP systems using a non-contact optical measurement system. In Transportation Research Board 85th Annual meeting, Washington, DC.
- Microsoft (2018). Adaptive scalable texture compression (preliminary). Retrieved from https://msdn.microsoft.com/en-us/library/windows/desktop/dn903790(v=vs.85).aspx
- Miyamoto, M., Konno, M.A. & Bruhwiler, E. (2007). Automatic crack recognition system for concrete structures using image processing approach. Asian Journal of Information Technology, 6, 553–561.
- Mizoguchi, T., Koda, Y., Iwaki, I., Wakabayashi, H., Kobayashi, Y., Shirai, K., Hara, Y., & Lee, H.-S. (2013). Quantitative scaling evaluation of concrete structures based on terrestrial laser scanning. Automation in Construction, 35, 263–274. doi: 10.1016/j.autcon.2013.05.022
- Mohajeri, M.H., & Manning, P.J. (1991). ARIA: An operating system of pavement distress diagnosis by image processing. Transportation Research Record, 1311, 120–130.
- Mohan, A., & Poobal, S. (2017). Crack detection using image processing: A critical review and analysis. Alexandria Journal of Bridge Engineering, 57(2), 797–798.
- Molenby, V., McMananmon, P., & Kobayashi, O.W.C. (2016). Laser radar: Historical prospective from the east to the west. Optical Engineering, 51(6), 64301.
- Newton, I. (2017). The Evolution of 3D laser scanning: Shoulder of giants,Trimble Publisher, California, USA.
- Omer, M., Hewitt, S., Mosleh, M.H., Margetts, L., & Parwaiz, M. (2018). Performance evaluation of bridges using virtual reality. In Proceedings of the 6th European Conference on Computational Mechanics (ECCM 6) and 7th European Conference on Computational Fluid Dynamics (ECFD 7) Glasgow, UK.
- Rashidi, M., & Gibson, P. (2011). Proposal of a methodology for bridge condition assessment. In Australasian Transport Research Forum 2011 Proceedings, Adelaide, Australia, September 28-30, 2011.
- Rehm, K.C.P.E. (2013). Bridge inspection: Primary element bridge inspection continues to evolve in U.S. Retrieved from https://www.roadsbridges.com/bridge-inspection-primary-element
- Rheingold, H. (1991). Virtual reality: Exploring the brave new technologies. Simon & Schuster Adult, New York, USA.
- Riveiro, B., Arias, P., Armesto, J., Rial, F., & Solla, M. (2008). Multidisciplinary approach to historical arch bridges documentation. ISPRS Journal of Photography and Remote Sensing, 37 (B5),247-252.
- Riveiro, B., Jorge, H.G., Varela, M., & Jauregui, D.V. (2013). Validation of terrestrial laser scanning and photogrammetry techniques for the measurement of vertical under clearance and beam geometry in structural inspection of bridges. Measurement, 46(1), 784–794. doi: 10.1016/j.measurement.2012.09.018
- Robert, R. (2007). Traditional inspection techniques: The foundation of structural health monitoring. McCormick School of Engineering and Applied Science, Northwestern University, Illinois, USA.
- Sampaio, A.Z., Ferreira, M.M., Rosário, D.P., & Martins, O.P. (2010). 3D and VR models in civil engineering education: Construction, rehabilitation and maintenance. Automation in Construction, 19(7), 819–828. doi: 10.1016/j.autcon.2010.05.006
- Samsung Oculus (2017). Samsung Gear VR specifications. Retrieved from https://www.samsung.com/global/galaxy/gear-vr/specs/
- Samsung (2015). Galaxy S6 in now. Retrieved from https://www.samsung.com/global/galaxy/galaxys6/galaxy-s6/#!/spec
- Seu, E., Hewitt, S., & Margetts, L. (2018). Use of gaming and affordable VR technology for the visualization of complex flow fields. In Proceedings of the 6th European Conference on Computational Mechanics (ECCM 6) and 7th European Conference on Computational Fluid Dynamics (ECFD 7) Glasgow, UK.
- Shields, R. (2003). The virtual, Routledge. New York, USA.
- Shiratuddin, M.F., & Zulkifli, A.N. (2001). Virtual reality in manufacturing, In: Management Education for the 21st Century Vietnam,China, September 12-14, 2001.
- Shuster, M. (2010). Using virtual reality to make nuclear reality safer, national security. Retrieved from https://www.npr.org/templates/story/story.php?storyId=126281862&t=1535316384847
- Sutherland, I.E. (1968). A head-mounted three-dimensional display. AFIPS '68 In Fall Joint Computer conference, California, USA, December 9-11, 1968.
- Teza, G., Galgaro, A., & Moro, F. (2009). Contactless recognition of concrete surface damage from laser scanning and curvature computation. NDT & E International, 42(4), 240–249. doi: 10.1016/j.ndteint.2008.10.009
- Golabi, K., Thompson, P., & Hyman, W. (1993). A network optimization system for bridge improvements and maintenance. Technical manual, US Department of Transportation, Federal Highway Administration.
- Thompson, P.D., Shepard, R.W., & AASHTO (2000). Commonly recognized bridge elements. Materials for National Workshop on Commonly Recognized Measures for Maintenance, Scottsdale, Arizona.
- Tong, X., Guo, J., Ling, Y., & Yin, Z. (2011). A new image-based method for concrete bridge bottom crack detection. In Image analysis and signal processing, Hubei, China.
- Woods, W.D. (2011). The Apollo flights: A brief history. Springer Praxis Books, New York, USA.
- Zimmerman, T.G. (1982, September 29). Optical flex sensor, VPL Research Inc, California, USA.
- Zyda, M. (2005). From visual simulation to virtual reality to game. IEEE Computer Society, 38(9), 25–32.