
 ?Mathematical formulae have been encoded as MathML and are displayed in this HTML version using MathJax in order to improve their display. Uncheck the box to turn MathJax off. This feature requires Javascript. Click on a formula to zoom.
Abstract
Transportation infrastructure is of fundamental importance and must be regularly assessed to ensure its safety and serviceability. The assessment of ageing reinforced concrete bridge stock may need to consider corrosion and cracks, as the likelihood of deterioration increases with age. This work accordingly investigates the incorporation of pre-existing anchorage zone corrosion cracks into the finite element modelling of reinforced concrete beam structural behaviour. Three methods of accounting for cracks were applied: (1) modifying the bond stress–slip relation, (2) weakening elements at the position of the crack, and (3) weakened discrete crack elements. The results show that modifying the bond stress–slip relation results in accurate predictions of the ultimate capacity when one-dimensional reinforcement bars are used in the model. Weakening elements at the position of the crack provides reasonable results when the anchorage is modelled with three-dimensional reinforcement bars and a frictional bond model. The implementation of discrete cracks was found to be unsuitable for the studied load situation, as compressive stresses formed perpendicular to the crack. It was concluded that the capacity of the studied case could be well estimated based on visual measurements, without knowledge of the exact corrosion level.
1. Introduction
Transportation infrastructure is fundamental for linking society together, and the public rely every day on uninterrupted transportation services to address their needs. When interruptions do occur, considerable time and financial losses are incurred (Berdica, Citation2002). Additionally, climate change has influenced weather patterns around the world resulting in more frequent extreme climatic events (Arneth et al., Citation2019). Such consequences of climate change have been linked to numerous risks for bridges (Nasr et al., Citation2019). This, together with expected increases in vehicle loads (Christidis & Leduc, Citation2009), is expected to increase the demands on infrastructure in the coming decades. Structural assessment of infrastructure therefore needs to be performed to ensure safety and maintain serviceability, and performance prediction is an important part of such assessments.
Reinforcement corrosion is a common cause of deterioration in concrete structures such as bridges and may influence their condition in terms of robustness and safety level (Cavaco, Neves, & Casas, Citation2018). Longitudinal cracks in the anchorage zone, often due to reinforcement corrosion, reduce the confining effect from the surrounding concrete and may reduce the anchorage capacity (Saether, Citation2011). Accordingly, the present study focuses on this type of corrosion and pre-existing crack when estimating the performance of reinforced concrete beams.
Finite element (FE) modelling of reinforced concrete employs two main approaches to represent cracking: discrete and smeared crack models (Rots & Blaauwendraad, Citation1989). Both approaches have been applied successfully with different advantages: e.g. the smeared crack model does not need a priori knowledge of the crack locations whereas the discrete crack model does; on the other hand, the discrete crack model can be more numerically stable in some cases (Gálvez, Červenka, Cendón, & Saouma, Citation2002; Malm & Holmgren, Citation2008). The present study explores different ways to incorporate information about pre-existing cracks in analyses with different levels of complexity, and the results using smeared and discrete crack models are compared for a more detailed analysis. As the exact level of corrosion is typically unknown in structural assessments, one important question is whether or not the structural behaviour can be adequately represented using only surface crack information, without the corrosion level.
An interesting method for estimating the capacity of structures with pre-existing cracks is the use of digital twin (DT) models. A DT refers to a detailed description of the physical characteristics and functional performance of an object, product, or system that includes all necessary information (Bradley & Hehenberger, Citation2016). A framework for the use of DT models in future assessments of existing structures has been previously proposed in the literature (Zandi, Ransom, et al., Citation2019). The cracks that are found during the inspection of structures clearly must be considered in structural evaluations. Thus, methods for incorporating pre-existing cracks into FE simulations using the DT approach are the focus of this article. Specifically, this study proposed and investigated the incorporation of pre-existing cracks using several levels of analysis to perform the FE modelling and assessment of reinforcement anchorages. The results of these numerical approaches were compared with the results of concrete beam tests previously conducted in the laboratory and discussed in this article.
2. Means and methods
2.1. Overview of modelling levels for anchorage assessment
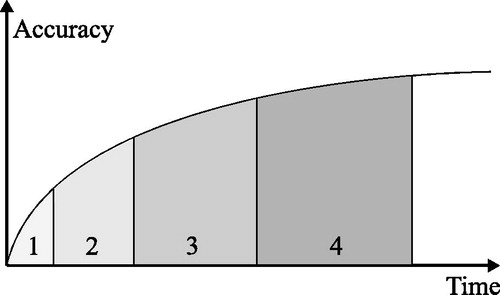
A theoretical model is always a simplification of reality; the extent of simplification varies depending on the model and/or its input parameters. The fib Model Code 2010 (FIB, Citation2013) used in this study describes a level-of-approximation (LoA) approach in which a higher LoA means better accuracy in performance prediction, but also increased analysis time (see ). The LoA should thus be chosen with consideration of the background of the analysis, e.g. preliminary design calculations and detailed structural assessments typically differ markedly in terms of the demand for prediction accuracy. Moreover, a higher LoA is costlier, which should be assessed in relation to any potential savings enabled by more advanced analyses.
Figure 1. Accuracy in predicting actual behaviour as a function of analysis time for various levels-of-approximation, modified from (FIB, Citation2013).
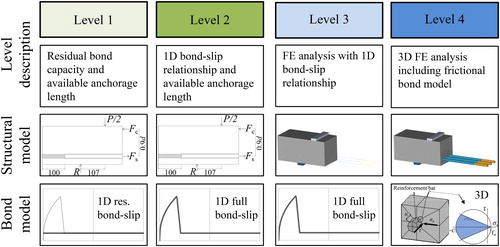
The LoA approach has been applied to the modelling of different failure modes, e.g. (Muttoni & Fernández Ruiz, Citation2012; Shu, Citation2018) for shear and (Tahershamsi, Fernandez, Zandi, & Lundgren, Citation2017) for anchorage. The latter analysis served as a basis for the anchorage modelling levels used in this work, presented in ascending order in .
Figure 2. Overview of anchorage behaviour modelling levels, modified from (Tahershamsi et al., Citation2017).
2.1.1. Incorporation of cracks in modelling level 1
The simplest way of assessing the load-carrying capacity with respect to reinforcement anchorage failure is based on a simple structural model and attainment of equilibrium between the applied load, the support reaction, and the forces generated by the bond stresses along the reinforcement embedment length (Lundgren, Kettil, Zandi Hanjari, Schlune, & Roman, Citation2012). Only the residual part of the bond stress–slip relationship proposed by (Blomfors, Zandi, Lundgren, & Coronelli, Citation2018) is used. This represents the lower bond capacity after a substantial loss of confinement due to longitudinal splitting cracks along the reinforcement.
The pre-existing crack pattern and the associated crack widths are not explicitly included in modelling level 1; instead, cracking is implicitly included through its influence on the bond properties. This approach should result in a conservative approximation of the failure load neglecting the initial peak of the bond stress–slip relationship. The serviceability conditions regarding load–deflection behaviour and development of transverse cracks are not described with this approach, nor is the end-slip of the reinforcement.
2.1.2. Incorporation of cracks in modelling level 2
The difference between modelling levels 1 and 2 is that the latter uses the full local bond stress–slip relationship in the analysis. Note that for the models available in the literature, to the authors’ knowledge the corrosion level needs to be known or assumed to produce a bond stress–slip relationship. The same structural model used for level 1 is then used to calculate the load-carrying capacity in level 2. Considering the nonlinear nature of the differential equation in (Lundgren et al., Citation2012), a numerical boundary value solver was used to obtain the anchorage force, similar to level 1, to calculate the load-carrying capacity based on the equilibrium conditions in the structural model.
As in modelling level 1, pre-existing cracks are implicitly included through their influence on the bond stress–slip relation. It should be noted that only cracks influencing the confinement of the reinforcement bar (and, in turn, the bond stress–slip relationship) are included in this modelling level. This approach should result in a reasonable approximation of the failure load; however, the choice of bond stress–slip relationship is expected to have considerable influence. The serviceability conditions in terms of load–deflection behaviour and crack widths are not described in this approach.
2.1.3. Incorporation of cracks in modelling level 3
On modelling level 3, the bond between the concrete and reinforcement is modelled with a 1D bond stress–slip relation, similar to level 2. The structural model is a three-dimensional (3D) FE model with continuum elements for the concrete and beam elements for the reinforcement. This enables explicit incorporation of pre-existing cracks into the FE model by either:
assigning weakened material properties to the concrete elements at the position of the crack in order to reflect the change in the material due to cracking, or
using interface elements (i.e. discrete cracks) at the position of the crack that are assigned weakened properties.
Furthermore, if the concrete has longitudinal cracks in the compressive zone, the material properties can also be modified, see for example (Biondini & Vergani, Citation2015; Coronelli & Gambarova, Citation2004; Hanjari, Kettil, & Lundgren, Citation2012). It should be noted that a two-dimensional FE model could also be considered if the explicit incorporation of pre-existing cracks in the FE mesh is not required. Note that the radial stresses arising around a ribbed reinforcing bar upon slip between the concrete and reinforcement are not included in modelling level 3 because of its simplified representation of reinforcement. Pre-existing cracks in concrete elements surrounding the rebar thus might not influence the simulation results. This approach is expected to constitute a reasonable representation in terms of the failure load prediction, load–deflection behaviour, as well as the development and widths of transverse cracks. The end-slips of the reinforcement bars are also expected to be represented well. Finally, at this modelling level, the results are expected to be highly influenced by the choice of local bond slip–stress relation.
2.1.4. Incorporation of cracks in modelling level 4
Modelling level 4 is the most elaborate modelling level considered in this study. In this level, the structural model is composed of 3D continuum FEs for both the concrete and the reinforcement, and a frictional bond model is used to describe the concrete–rebar interface characteristics (Lundgren, Citation2005). The friction model can represent the radial stresses around a reinforcement bar upon slip between the concrete and reinforcement. As the stress state in the concrete surrounding the reinforcement is influenced by the presence of adjacent cracks, they should also influence the structural behaviour. The method of incorporating existing cracks is similar to level 3, using either weakened material properties or discrete cracks for the concrete at the locations of the cracks. The failure load, load–deflection behaviour, as well as crack development and widths are, thus, represented in this model, along with the end-slip of the reinforcement. It should, however, be stressed that this modelling approach is influenced by the frictional model used for the bond interface layer.
It should be mentioned that it is possible to model corrosion damage in RC structures in even more detail, e.g. by using meso-scale models to for example accurately account for change of rib shape and eventual pitting corrosion of the reinforcement bar (Jiradilok, Nagai, & Matsumoto, Citation2019; Jiradilok, Wang, Nagai, & Matsumoto, Citation2020). However, at assessment of existing structures detailed input for such analyses are challenging to obtain. Therefore, assessment level 4 was the most elaborate method considered in the present study.
2.2. Application of modelling levels to beams failing in anchorage
To compare the proposed methods accounting for the influence of pre-existing cracks, the results obtained from analyses using the different levels were compared with experimental results from (Zandi, Boubitsas, et al., Citation2019). These specimens were chosen because they exhibited the pre-existing cracks due to corrosion (accelerated), and they have been documented in the form of 3D scanning results. A total of six square cross-section beams without stirrups were tested in bending, with three equally-spaced, longitudinal reinforcement bars placed in a single layer at the bottom of each beam.
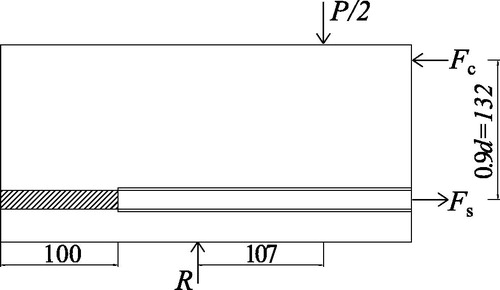
The beams were designed to fail in anchorage by preventing the bond between the reinforcing steel and concrete except for the last 100 mm at each end. The geometry of the specimens and the four-point bending test set-up are shown in . Two beams were subjected to artificial corrosion prior to mechanical testing whereas two others were used as reference. It should be noted that the referenced study also included two beams tested under cyclic loading; these were not modelled as a part of the investigation in this article. The material properties of the concrete and reinforcement, as documented in (Zandi, Boubitsas, et al., Citation2019), are summarised in . The compressive fracture energy was calculated from the tensile fracture energy
according to Hendriks, M.A.N., de Boer, A., Belletti, B. (2017).
Figure 3. Geometry of specimen and test set-up, modified from (Zandi, Boubitsas, et al., Citation2019). Note that the bond between concrete and reinforcement was prevented along the bars, except for the outer 100 mm in each end. Dimensions in mm.
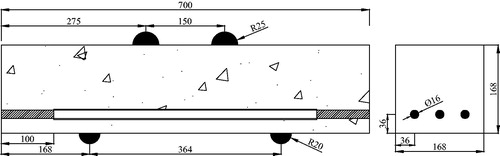
Table 1. Material properties of concrete and reinforcement (Zandi, Boubitsas, et al., Citation2019).
The accelerated corrosion was accomplished through the addition of NaCl (3% of cement weight) to the mix for the corroded specimens and the application of a 100 µA/cm2 current. The bar sections from the anchorage regions were extracted after the tests and the corrosion levels were measured by the gravimetric method. Prior to weighing, the bar sections were cleaned in an ultrasonic bath with hydrochloric acid and urotropine. The corrosion level was found to be similar for all bars from specimen 5 (S5), but more varying for specimen 6 (S6) (see ). The corrosion was observed to form pits distributed along the anchorage length. Therefore, the local reduction of bar cross-section could be larger than the average weight loss.
Table 2. Measured corrosion on specimens (gravimetric method) (Zandi, Boubitsas, et al., Citation2019).
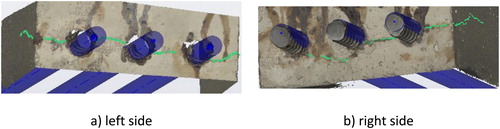
The corrosion-induced splitting cracks for specimen 5 are shown in , in which the cracks are highlighted by green lines. The typical crack width was around 0.1 mm, but this varied slightly along and among cracks; for simplicity, a crack width of 0.1 mm was assumed for all cracks. This was regarded a reasonable simplifying assumption since crack widths along the depth of the cracks were unavailable. For information on the crack morphology of specimen 6, as well as detailed crack widths, the reader is referred to (Zandi, Boubitsas, et al., Citation2019).
Figure 4. Corrosion-induced splitting cracks on the left and right ends of Specimen 5, indicated by the green lines. The extension of the reinforcement bars is shown in blue.
2.3. Description of analysis cases
Two reference specimens (SR) and two corroded specimens (S5 and S6) were modelled using the different levels detailed in Section 2.1 using various modelling choices; this resulted in a large number of analysis cases, and thus, an overview of results was determined to be advantageous. The modelling variations consisted of changes in the modelling level, bond model, crack implementation method, and crack detail. However, not all modelling levels are associated with the same variations in other aspects. For example, since the influence of a pre-existing crack is implicitly included by an altered bond stress–slip relation in modelling level 2, variation in the crack implementation in the FE mesh is not applicable.
An overview of the analyses is shown in . For levels 1 and 2, pre-existing cracks are implicitly accounted for by the local bond stress–slip relationship, which changes from that of a reference specimen to one reflecting the corroded state upon corrosion. The level 3 analysis consists of a 3D FE model with 1D bond-slip reinforcement (beam elements). The bond stress–slip relation corresponding to the reference or corroded state is used, together with two additional crack implementation techniques, namely the weakened element properties or discrete crack elements. Furthermore, the discrete crack approach is further broken down into low, intermediate, and high detail, referring to the level of detail of the geometrical modelling of the crack. Modelling level 4 differs from modelling level 3 in the modelling of the concrete–rebar interface. The solid rebar elements facilitate the use of a frictional model, which is used instead of a 1D bond stress–slip relation.
Figure 5. Overview of analyses at different modelling levels.
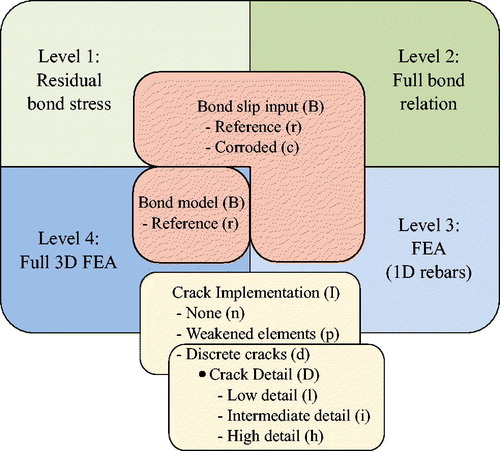
The bond modelling and explicit crack implementation techniques are elaborated in the following sub-sections. Note that the letters within parentheses in are used to indicate each particular analysis in later sections of this article. For example, S5L3BcIdDh indicates the analysis of specimen 5 on level 3 with corroded bond input and discrete elements with a highly detailed crack implementation. The parameters of each analysis are summarised in .
Table 3. Overview of analysis cases.
2.3.1. Representation of bond (B)
For the analyses on modelling levels 1–3, simple bond stress-slip relations were used. The reference relation, without corrosion, was based on the fib Model Code 2010 (FIB, Citation2013), and the corroded relations were determined by a further development of the aforementioned model to include the effects of corrosion (Blomfors et al., Citation2018). The residual branch and full bond stress–slip curve were used in levels 1 and 2, respectively. In the level 3 FE analysis, the shear stiffness of the interface layer was set to based on the initial slope of the bond stress–slip relation, and the normal stiffness was assigned a value ten times higher. In the unbonded parts of the rebar, a low strength of 10 Pa was used to avoid numerical instability, and the initial stiffness was kept the same as in the bonded region.
For the level 4 analysis, a frictional model was used to describe the interface between the reinforcement bar and the surrounding concrete. Interface elements were placed between the materials, and their behaviours were modelled as described in (Lundgren, Citation2005) with input according to (Jansson, Lofgren, Lundgren, & Gylltoft, Citation2012). Although the model allows for explicit modelling of the corrosion phase, only the frictional part of the model (without modification due to corrosion) was used in this study because our objective was to investigate if the inclusion of the pre-existing cracks themselves was sufficient to represent the beam behaviour.
The level 3 analysis uses the average corrosion weight loss of the bar as input despite the formation of corrosion pits observed in the experiments. Varying the distribution of corrosion around the reinforcement bar perimeter has been shown to have minor influence on the anchorage capacity given the same total corrosion weight loss (Zandi, Citation2015). Further, if the anchored force is close to the yield force of the reinforcement bar, additional measures should be taken to account for reduction of tensile capacity of the reinforcement bar due to the pitting. However, considering the relatively low corrosion level and the magnitude of the peak loads in the tests, the anchored force was expected to be less than 40% of the yield force; accordingly this was omitted in these analyses.
2.3.2. Crack implementation (I) and crack detail (D)
Two ways of including pre-existing cracks were considered: weakened element properties (Ip) and discrete crack elements (Id). Note that analysis without cracks was also considered, denoted as In.
2.3.2.1. Crack implementation using weakened element properties (Ip)
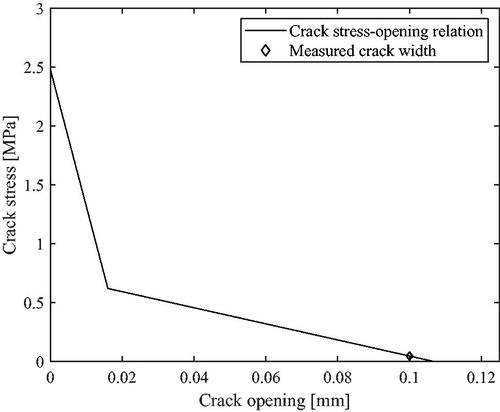
In this implementation, the finite elements coinciding with a pre-existing crack were assigned reduced tensile material properties compared to the sound concrete. The magnitude of this reduction depended on the width of the crack based on a bilinear mode-I stress-to-crack width relation. The relation was derived using the tensile strength and fracture energy of the concrete with the kink point as proposed by (Wittmann, Rokugo, Brühwiler, Mihashi, & Simonin, Citation1988). For the analysis, the tensile capacities of the cracks were extracted from the stress-to-crack width relation (see ). As previously described, the surface crack widths were assumed to be 0.10 mm for all cracks in specimens 5 and 6. Further, the cracks were assumed to extend to the reinforcement with the same opening.
Figure 6. Crack stress–opening relationship, with the splitting crack width of the corroded specimen indicated by a diamond shape.
The tensile stress–strain relation was obtained for the elements with weakened properties using the stress level at the measured crack width and the width of a stress-free crack. To obtain the corresponding strains, the crack openings were smeared over the crack bandwidth, which was taken as 10 mm (corresponding to ) for the weakened elements. This assumes strain localisation in one element row for the pre-existing splitting cracks, which was also verified in the analyses. The strain at the maximum crack stress was found through division by the Young’s modulus of the concrete, and indicated a small strain value.
The stress–strain relation for a concrete element with weakened properties is shown in . The fixed total strain-based crack model with damage-based shear retention, i.e. reduction of shear stiffness due to cracking, was used for the elements with weakened properties. The strain was generally calculated based on the remaining crack opening and the crack bandwidth (10 mm); note that the strain at peak stress was found by dividing the stress by the Young’s modulus.
Figure 7. Bottom x-axis: concrete stress–strain relation for the concrete elements with weakened properties representing pre-existing cracks. Top x-axis presents concrete stress–crack opening relation for discrete crack elements, determined directly from the bilinear concrete stress–crack opening relationship.
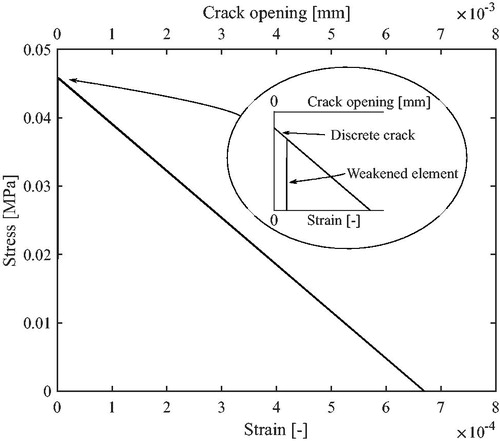
2.3.2.2. Crack implementation using discrete crack elements (Id)
In this approach, pre-existing cracks were explicitly modelled using discrete crack elements. The discrete cracks were assigned properties that were derived similarly to the weakened element properties, but with the crack stress-to-opening relation as input. The shear modulus (mode II) was set to zero when the maximum normal stress was reached in the crack, thus neglecting aggregate interlock in macro-cracks (Rots & Blaauwendraad, Citation1989).
Note that the width of the crack in the FE model started at zero even though the width of the physical crack was nonzero at that time. The elastic normal and shear stiffness were set to and
respectively, where
is the interface thickness equal to 0.1 mm,
is the estimated Young’s modulus of the concrete, and
is the Poisson’s ratio of concrete, taken as 0.15. Nodal lumping was employed for the discrete cracks as suggested by (Rots, Citation1988).
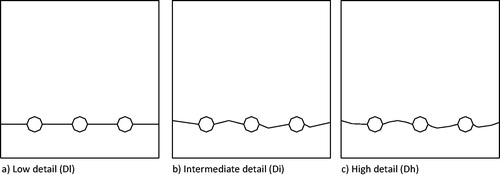
The macro geometry of the crack (crack detail level, denoted by ‘D’) was approximated based on three levels of detail, low (Dl), intermediate (Di), and high (Dh), as shown in , for one end of specimen 5. The lowest level assumes a single straight-line crack, the intermediate level traces the shape of the crack using a series of straight-line segments, and the high level traces the crack with twice as many line segments as the intermediate level. The cracks were assumed to be similar for all cross-sections along the anchorage length.
Figure 8. Illustration of the three levels of detail for the crack macro geometry.
2.4. Other general analysis aspects
DIANA 10.2 (DIANA FEA BV, Citation2017) software was used for the FE analysis. The specific element types used for the anchorage assessment levels 3–4 are presented in the model description sections of Section 3. The intended average element size was set to 10 mm for all levels. The sound concrete was assigned a total strain-based smeared crack model with rotating cracks. The behaviour in compression was modelled as parabolic according to (Feenstra, Citation1993), with a reduction due to lateral cracking according to (Vecchio & Collins, Citation1993). The tensile behaviour was modelled according to Hordijk (Cornelissen, Hordijk, & Reinhardt, Citation1986) for the sound concrete, with a crack bandwidth of 25 mm and a Poisson’s ratio reduced based on the degree of cracking (damage). The crack bandwidth was verified against the localised strains in the analysis.
In order to ensure the same load on each load plate in the analysis while still using deformation control, the imposed deformation was applied to the midpoint of a stiff beam element spanning between the load plates. Ties were assigned between the vertical displacement of the end points of the stiff beam and the nodes along the centrelines of the load plates. The deformation was imposed in 40 steps of 0.005 mm followed by 40 steps of 0.05 mm. However, because the arc-length method was applied to promote convergence in the analysis, the actual load step sizes were as much as ∼30% smaller. The equilibrium iterations were performed using the secant (Quasi-Newton) BFGS (Broyden, Fletcher, Goldfarb, and Shanno) iteration method. The maximum number of iterations was set to 400 and convergence was considered as a fulfilment of either an energy norm of 0.001 or a force norm of 0.01.
3. Models and results
3.1. Level 1 anchorage assessment
The level 1 anchorage assessment was performed using the residual portion of the bond stress–slip relation in combination with a simple structural model.
3.1.1. Model description
As symmetric conditions were assumed, only half of the specimen was used for the structural model (see ). For internal concrete and steel forces and
respectively, where
is the applied load (so that
is the total load-carrying capacity) and
is the support reaction, the moment equation at the intersection between
and
gives the applied load as follows:
(1)
(1)
Figure 9. Idealised force equilibrium for bending test. Half of the beam is shown as per symmetry assumption (dimensions in mm).
The force in the reinforcement was determined from the residual portion of the bond stress–slip relation together with the surface area of the bonded portion of the bar. According to (Blomfors et al., Citation2018), the residual bond strength can be expressed as:
(2)
(2)
where
is the nominal diameter.
3.1.2. Results
According to EquationEquation (2)(2)
(2) , the residual bond stresses are 1.21 MPa and 1.16 MPa for the reference and corroded concrete, respectively. Note that the difference between these values is only due to the differing concrete compressive strengths of the two mixes. The level 1 approximation of the total load-carrying capacity is 40.6 kN for the reference specimens and 38.9 kN for the corroded specimens. Compared with the average capacity of the reference and corroded specimens (283.5 kN and 242.6 kN, respectively) measured in the tests, the analysis on this level can be observed to have largely underestimated the capacity.
3.2. Level 2 anchorage assessment
The level 2 anchorage assessment was performed using the full bond stress–slip relation in combination with the same structural model used in the level 1 assessment (see ).
3.2.1. Model description
The force in the reinforcement was obtained by solving the differential equation for the bond using the full bond stress–slip relation. This was numerically accomplished as described in (Blomfors et al., Citation2018) using the corrosion levels measured in the previous study (see ). However, all measured corrosion levels were found to result in a similar anchorage force. The load-carrying capacity was then calculated from the anchorage force, similar to level 1.
3.2.2. Results
The total anchorage force in the three bars was 105.8 kN for the reference specimen. Due to the small variation in corrosion level between specimens 5 and 6, the total force was 92.7 kN for both. Consequently, the total load-carrying capacity, was 235.0 kN and 205.8 kN for the reference and corroded specimens, respectively, compared with test-measured capacities of 283.5 kN and 242.6 kN, respectively. Again, the analysis on this level slightly underestimated the capacity of the specimens.
3.3. Level 3 anchorage assessment
3.3.1. Model description
A 3D FE model was constructed using solid isoparametric elements of brick, tetrahedron, pyramid, and wedge types (HX24L, TE12L, PY15L, TP18L, respectively) with linear interpolation and Gauss integration. The reinforcement was modelled using embedded beam elements with bond slip. The bond stress–slip relations were determined as for the level 2 assessment; however, in level 3 the bars were individually assigned a bond stress–slip relation based on their corrosion level. The load was applied as an imposed deformation of the centrelines of the steel load plates. The mesh is presented in .
Figure 10. 3D FE mesh of the test set-up with concrete coloured grey, load plates light blue, and support plates dark blue. Half of the concrete elements are hidden to show the embedded reinforcement; the orange lines indicate bonded reinforcement and the light blue lines unbonded reinforcement.
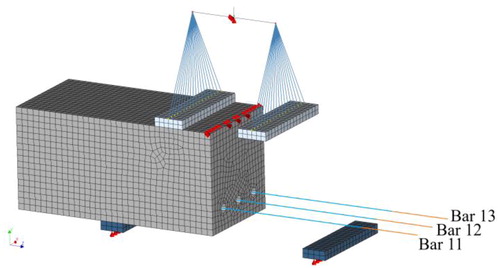
Figure 11. Element-assigned weakened properties (cracked) indicated with red colour for specimen 5. Side view is also shown, (a) left and (b) right.
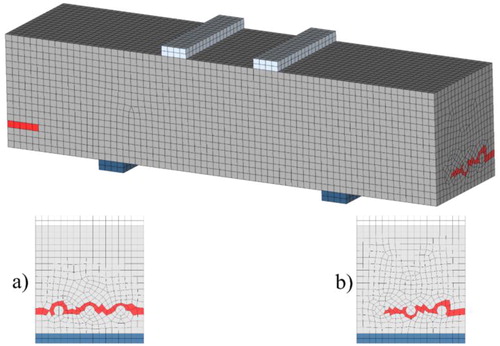
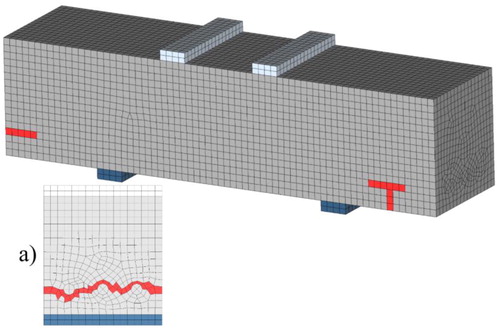
Figure 12. Element-assigned weakened properties (cracks) indicated with red for specimen 6. Left side view (a) is also shown.
The concrete elements surrounding the 1D reinforcement bars corresponding to the physical bar geometry were assigned linear elastic material properties in tension. This was done to prevent premature failure due to high shear stresses before reaching the maximum stress in the input bond stress–slip relation. Furthermore, 1 mm of additional bonded length was added to the left side for the level 3 analysis to ensure bond failure at the other side.
In the weakened element (Ip) approach for crack implementation, the FEs coinciding with the cracks were assigned weakened material properties. These elements are shown in and for specimens 5 and 6, respectively.
In the discrete crack (Id) approach for crack implementation, interface elements were placed at the location of the pre-existing cracks to act as discrete cracks, one bar radius away from the centreline of the reinforcement. The three discrete crack levels (Dl, Di, Dh) are shown in for the left side of specimen 5.
3.3.2. Results
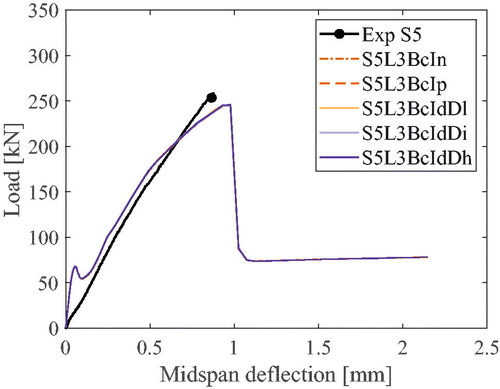
The load–displacement behaviours obtained from the level 3 analysis correspond reasonably well to the results of the tests, see for an example. Some differences can be observed such as a smaller stiffness in the analysis at higher load levels, reflecting the reduced stiffness due to the bond stress–slip relation at increased slip levels. Furthermore, the ultimate capacity of the beams is well captured when the corroded bond stress–slip input is used for the corroded specimens. The internal moment arm is around 0.97d, c.f. the assumption of 0.9d for assessment levels 1 and 2. This modelling level did not include any influence of the investigated crack implementation approach; thus, including weakened element properties or discrete cracks yields the same results as omitting them. This observation is thoroughly discussed in Section 4.
Figure 13. Load–deflection curve for specimen 5, modelling level 3 with corroded bond stress–slip relation for In (no crack implementation), Ip (weakened element properties), and Id (discrete cracks). Note that all analyses results were similar.
The crack pattern evolution began with the formation of a bending crack at midspan as the tensile strength of the concrete was reached. More cracks at midspan were formed in the later load steps, and shear cracks between the load and support points typically formed a few steps before the ultimate load was reached. All the crack patterns, reinforcement bar stress distributions and load-displacement plots for the level 3 analyses are available as Supporting Information.
3.4. Level 4 anchorage assessment
3.4.1. Model description
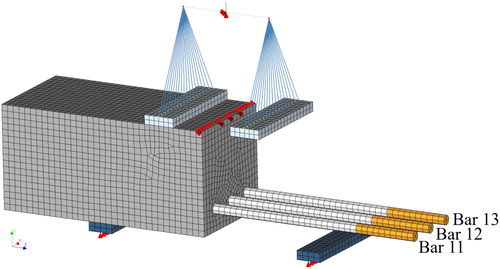
A 3D FE model was constructed using solid isoparametric elements (same as for level 3) with linear interpolation and Gauss integration. In contrast to level 3, the reinforcement bars were modelled using solid elements, and interface elements (Q24IF) were placed on the rebar surface to implement the bond model. The load was applied identically to level 3, as was the crack implementation. However, the bonded length was set the same on both ends of the beam to investigate if the crack implementation approach could trigger one-sided anchorage failure. The lower characteristic tensile strength of the concrete, was used for two element rows at midspan to promote localisation of the bending cracks. The mesh is presented in .
Figure 14. 3D FE mesh of the model with concrete coloured grey, load plates light blue, and support plates dark blue. Half of the concrete elements are hidden to show the reinforcement; orange indicates bonded reinforcement and light grey indicates unbonded reinforcement.
3.4.2. Results
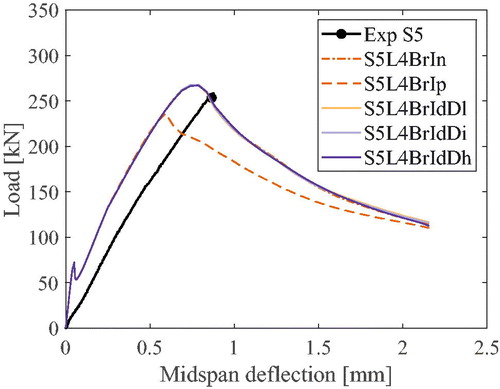
The load–displacement behaviour of the level 4 analysis corresponds reasonably well to the experimental results, particularly in terms of the ultimate capacity (see ), and the stiffness differs only slightly. The effect of weakened element properties is obvious in this modelling level, as the ultimate capacity is markedly lower, while the discrete cracks do not show any influence on the results.
Figure 15. Load–deflection curves for specimen 5 assessed on modelling level 4 for cases In (no crack implementation), Ip (weakened element properties), and Id (discrete cracks). Note that all analyses except Ip yielded similar results.
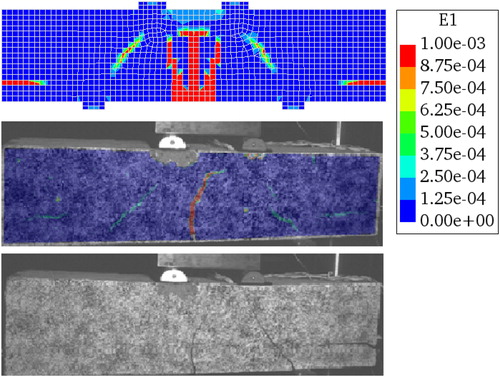
After a few load steps, a bending crack began to form at midspan. As the load increased, more element lines cracked in addition to the initial bending crack. When approaching the maximum load, shear cracks developed on both sides starting at the mid cross-section height and extending between the load and support plates. Just before the maximum load was reached, splitting cracks developed along the reinforcement bars towards the sides and bottom of the beam. Furthermore, for all cases except for assessment with weakened element properties, two crack lines formed on the top of the beam, one on each side between the load plate and beam end. The crack pattern for specimen 5 is shown in , both from assessment on level 4 using weakened element properties as well as DIC results at maximum load. A picture of the specimen after test procedure is also included, clearly showing the shear cracks and the splitting cracks in the anchorage region.
Figure 16. Top - crack pattern obtained at maximum load from level 4 assessment using weakened element properties; Mid - crack pattern obtained from DIC results of the test at maximum load; Bottom - picture of the specimen at the end of the test. All results are for specimen 5.
All the crack patterns, reinforcement bar stress distributions and load-displacement plots for the level 4 analyses are available as Supporting Information.
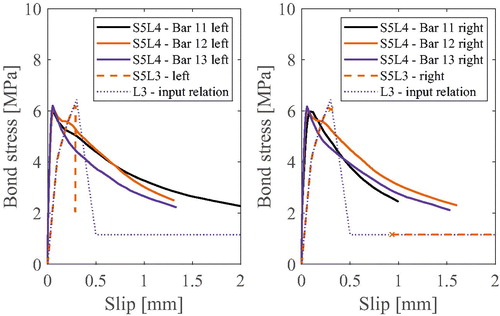
The average bond stress–slip relations are shown in and for SRL4 and S5L4BrIp, respectively. The results were calculated using the average bond stress and slip, considering all interface elements along the bonded length. The results from the level 3 analysis are also shown in the figures together with the input bond stress–slip relation used for the analysis. Because bond modelling differs conceptually in the levels 3 and 4 analyses (with level 4 explicitly considering the confinement), the results of each analysis level differ, although the trends and peak stress are similar. The bond stress–slip relation does not differ between the bars in the level 3 analysis in terms of input or output. For the level 4 analysis, the maximum average bond stress is similar for all three reinforcement bars; however, an increased ductility is consistently observed in the mid bar due to increased confinement.
Figure 17. Left- and right-side bond stress–slip relationships for reference specimen modelled on level 4 (SRL4). For comparison, the equivalent level 3 results and input relation are also shown.
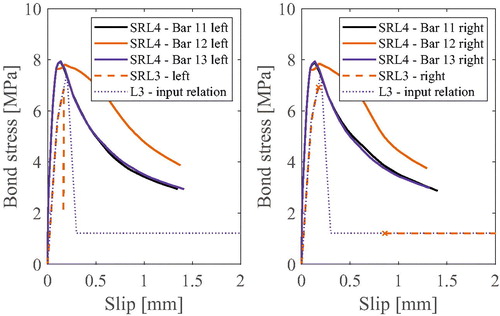
Figure 18. Left- and right-side bond stress–slip relationship for specimen 5 assessed on level 4 with weakened element properties (S5L4BrIp). For comparison, the equivalent level 3 results and input relation are also shown.
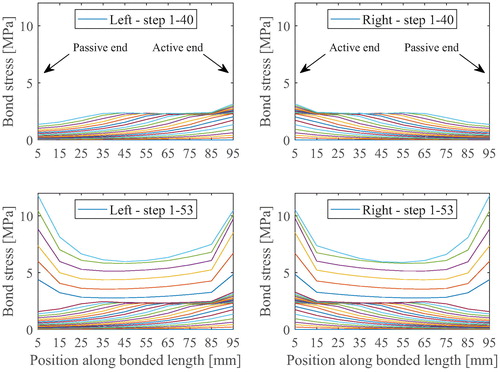
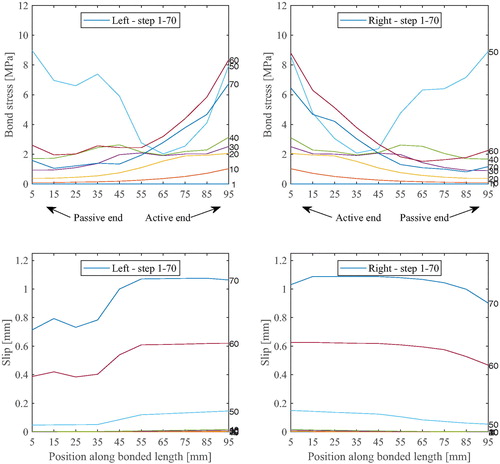
The bond stress along the anchorage length, averaged over 10 mm segments, is shown in for SRL4. For legibility, only every second load step is shown; the top plots show load steps 1–40 and the bottom plots show steps 41–54, where step 53 corresponds to the maximum load. As all bars exhibited similar results for the reference analysis, only one bar, bar 11, is shown. Between load steps 1–40, the bond stress increases towards the active end of the bonded length and decreases slightly towards the passive end. At load step 44, a trend break is obvious in which the bond stress increases at the passive end such that at the maximum load, the bond stress is larger at the passive than at the active end. This phenomenon will be elaborated in the discussion in Section 4.
Figure 19. Bond stress along bonded length of bar 11 at every second load step, extracted from element centres, for the reference specimen assessed on level 4 (SRL4). Load step 53 corresponds to the maximum load. Other bars show similar results.
The bond stress and interface relative displacement (slip) at every tenth load step are shown in for the outer (bar 11), for the reference analysis on level 4 without pre-existing cracks. Every tenth step from 1 to 70 is shown and the remaining step 80 is omitted to increase the legibility of the plots; inclusion of this step does not add much information as it is similar to step 70, but with less bond stress and increased slip. The load step number is indicated on the right side of each graph. Load steps up to 40 are associated with small slip levels and are hard to distinguish from each other for both the left and right bonded regions.
Figure 20. Bond stress and slip along bar 11 of the reference specimen, analysed on level 4 (SRL4).
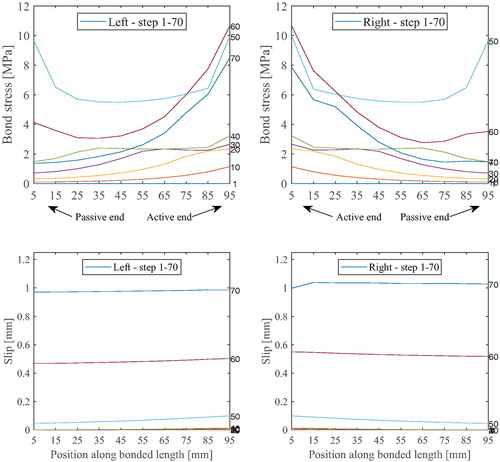
For lower load levels, the bond stress is small and uniform along the bonded lengths, but increases and decreases at the active and passive end, respectively, as previously discussed. At load step 50 the slip clearly increases, with a higher value at the active end. The stress at this load step is high, increasing at both the active and passive ends. At load steps 60 and 70, i.e. after peak load, the slip markedly increases on both sides; i.e. one-sided anchorage failure did not occur for the reference specimen. The bond stress in the active ends of the bonded regions remains quite high whereas the stress on the passive end markedly decreases. Note that extensive splitting cracks were observed along the reinforcement bars at these load steps. For comparison the centre bar reached a slightly higher bond stress at the active end compared to the outer bar. Further, the bond stress is also higher after peak load, both for the active and passive end.
shows a similar plot to but for S5L4B4Ip, i.e. when the pre-existing cracks were implemented using weakened element properties. The trends in the results are similar compared to the reference case, but the weakened elements at the position of the crack (50 mm adjacent to the passive end) result in a reduced bond stress, especially after peak load. The slip can be observed to increase on both sides for increased load steps; i.e. the weakened element properties did not trigger one-sided anchorage failure.
Figure 21. Bond stress slip along bar 13 of specimen 5, analysed on level 4 (S5L4BrIp) with cracks implemented through weakened element properties.
4. Discussion
In the levels-of-approximation approach (c.f. ), higher prediction accuracy is expected if more time is spent on the analysis. Moreover, because fewer conservative simplifications were made with increasing assessment level, a higher capacity is expected. The load–displacement curve shown in supports this reasoning. Using hand calculations for the level 1 analysis, a low, conservative estimate of the ultimate capacity was obtained. When the full bond stress–slip relation was utilised for the level 2 analysis, the prediction of the ultimate load increased markedly. The level 3 analysis showed a slightly higher load capacity, mostly because of an increased internal moment arm of compared to the assumption of
made in the levels 1 and 2 assessments. The level 4 analysis showed an increased load capacity over the level 3 analysis because of its more accurate representation of bond, in which the normal stresses surrounding the reinforcement influence the anchorage capacity. Furthermore, a more ductile post-peak response was also observed for the level 4 analysis.
Figure 22. Load–deflection curves for reference specimens at different modelling levels.
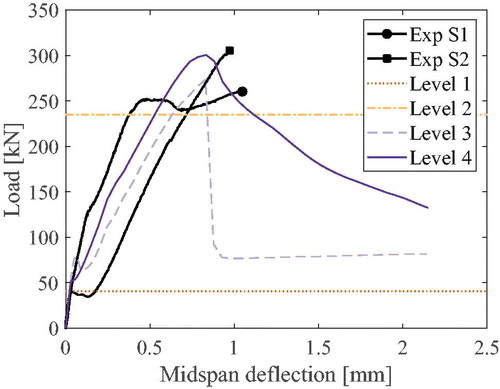
The failure mode was highly brittle, therefore, no experimental post-peak data was available for comparison. It should be mentioned that experimental specimen S1 was damaged during handling. It should also be noted that experimental specimen S2 showed a sudden decrease in deflection at a low load, and it was not concluded whether this was due to support settlement or flexural cracking. Furthermore, a third specimen was tested cyclically but is not shown in the graph; it is, however, worth noting that its ultimate capacity was 290 kN. Comparing all results and factors, the level 4 analysis clearly captured the ultimate capacity most accurately.
The method for reducing the element properties in tension at the position of the crack did not show any influence on the results using modelling level 3. Using this method, the elements were weakened around the physical rebar geometry to correspond to the actual crack delamination plane. Although some of the weakened elements in the crack plane attracted localised strain, the full bond stress could be developed. No splitting stresses arose around the 1D reinforcement bar with bond slip in level 3, in contrast to the level 4 analysis with a frictional bond model. Therefore, if shear failure is avoided in the elements closest to the 1D bar, the anchored force in the bars can be balanced by forces in the surrounding concrete.
The level 4 analysis used solid reinforcement bars and a frictional bond model to represent the interface behaviour. For the considered specimen, the inclusion of discrete cracks in the analysis did not influence the resulting capacity, in contrast to using weakened elements. The reason for this difference in influence is related to the stress state in the anchorage region of the specimens. A depiction of the in-plane principal stresses at a plane between the corner and middle bar for S5L4BrIdDl at load step 40 is shown in . It should be noted that compressive stresses are present around the bar along the bonded length. The maximum load is reached at step 50, when the anchored force in the reinforcement bars gives rise to radial stresses, in turn causing the tensile stresses around the bars to grow sufficiently large to crack the concrete cover.
Figure 23. In-plane principal stresses along the plane between the corner and middle bar for specimen 5, assessed on level 4 with discrete cracks (low detail) at load step 40, i.e. 12 steps before maximum load.
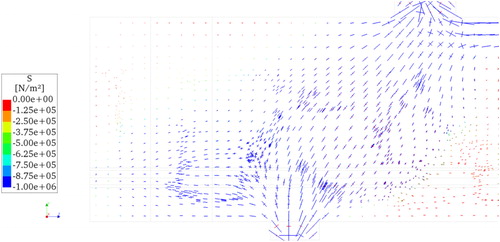
Most discrete crack elements were compressed until the point of maximum load, meaning that the shear behaviour is like that of sound concrete. The splitting forces developed around the reinforcement along the anchorage length, and ultimately the failure occurred with a splitting crack forming on the side of the specimen along the bonded length of the reinforcement. However, under the approach in which the pre-existing cracks were implemented using weakened tension properties, the elements failed when the shear stresses generated along the reinforcement exceeded the tensile strength. This occurred at a lower load level compared to that with no crack implementation. Thus, the observed difference in behaviour between discrete crack elements and weakened solid elements are due to their different behaviour under shear loading.
For the level 4 analysis, an increase in ductility was observed at the middle bar (see and ). For specimens with transverse reinforcement in the form of stirrups, such behaviour is typically associated with the edge bars for which the stirrups can bridge cracks in both the vertical and horizontal directions. The middle bar in such a set-up may, therefore, be expected to be the least ductile of the bars. For the specimen without stirrups modelled in this study, however, the middle bar was found to be more ductile. This is likely due to a larger loss of confinement for the corner bars due to the more substantial cracking around them compared to the middle bar.
Based on the analyses performed in this work, it was shown that the level 1 analysis can serve as a conservative first approximation of the capacity of a corroded reinforced concrete beam failing in reinforcement anchorage. If the capacity using this level is satisfactory, analysis on higher levels may be omitted. A great deal of additional capacity can be obtained by utilising the full bond stress–slip relation in the level 2 assessment. However, when using modelling level 3, the measures considered for including pre-existing cracks showed no effect on the anchorage capacity. This was expected as the actual radial stresses are not generated around the 1D rebar elements in this model.
For modelling level 4, however, in which radial stresses around the reinforcement do develop, a clear influence of including weakened elements at the position of the crack can be observed. The main increase in accuracy between level 3 and level 4 is not in terms of the ultimate capacity, at least not for the specimens modelled here. Instead, a more precise description of the crack pattern was obtained and perhaps a more realistic description of the post-peak behaviour in terms of the load–deflection behaviour of the specimen and the bond stress–slip relation of the individual reinforcing bars, but test data supporting the latter is lacking.
It should be noted that the results for levels 1, 2, and 3 are largely dependent on the bond stress–slip relationship, which must accurately represent the reduction in capacity due to longitudinal cracking. Moreover, the frictional bond model used in level 4 was calibrated based on experimental observations. The likelihood of accurately representing reinforcement–concrete bond behaviour with a frictional bond model is regarded to be higher than with a bond stress–slip relation, as parameters such as concrete cover, transverse reinforcement, and support pressure are explicitly treated in the FE analysis rather than implicitly incorporated in the bond stress–slip relation.
When cracking occurs in concrete, the strains localise in the crack while the adjacent concrete undergo strain relief (Ng, Ma, & Kwan, Citation2019). The suggested modelling approach intends to circumvent the load history and in situ stress state in the structure to make performance predictions based on observations from visual inspection. The state of stress and strain in the concrete adjacent to the cracks were therefore not included, since the cracking process was not modelled. This may be an important avenue for further improvements of the modelling approach, for example for analyses of dead-weight dominated structures. Nonetheless, the approach presented here corresponds well to experimental data, indicating that the influence of initial stresses and strains are small for the present case. Moreover, validation for a wider range of corrosion levels is also an important aspect for further development of the modelling approach.
A 3D FE model with solid reinforcement bars, i.e. a level 4 analysis, with explicit mesh incorporation of pre-existing cracks in the form of weakened elements is thus regarded to be the most suitable approach for used in a DT modelling concept. The 3D geometrical representation of the concrete can capture the complex geometries that may be necessary in case of spalling of the concrete cover and other failure mechanisms. Furthermore, the actual corrosion level in the structure, which is typically unavailable for assessments, is not required as input for the level 1 and 4 assessments (whereas it is required for levels 2 and 3). These advantages, together with its well-represented ultimate capacity and crack pattern, makes assessment level 4 the most suitable for anchorage assessment in DT models.
5. Conclusions
In this study, a series of corroded reinforced concrete beams with pre-existing splitting cracking in the reinforcement anchorage regions were evaluated using four levels of analysis with increasing levels of complexity and accuracy. The results of the FE analyses were compared to the results of previous experiments to investigate the accuracy of the modelling approaches. The main conclusions drawn from this study are summarised as follows:
Simple hand calculations can quickly provide a lower bound for the capacity without knowledge of the corrosion level.
An increased modelling level results in improved prediction of the ultimate capacity, but is also more time-consuming.
The use of discrete cracks did not have any significant influence when included in the models with low, intermediate, or high detail due to the stress state in the anchorage zone.
The FE model using 3D solid concrete and reinforcement elements (level 4) was determined to be the most suitable for DT models of concrete structures with splitting cracks due to reinforcement corrosion in the anchorage region, as this level provided the most complete and accurate results.
The findings of this study indicate that modelling level has a direct impact on the accuracy of the estimated capacity of reinforced concrete beams with corrosion in the anchorage region. By more completely accounting for the behaviour of the bond between reinforcing steel and concrete using a 3D model with solid elements, the level 4 analysis proposed in this study can be applied to estimate the ultimate load of reinforced concrete beams showing splitting cracks in the reinforcement anchorage zone without requiring direct knowledge of the degree of corrosion of the reinforcement itself. This should be of value to engineers and researchers who need to determine the capacity of corroded reinforced concrete members in service.
Supplemental Material
Download PDF (8.3 MB)Acknowledgement
The FE analyses were performed on resources provided by Chalmers Centre for Computational Science and Engineering (C3SE).
Conflicts of interest
The authors declare no conflicts of interest.
Additional information
Funding
References
- Arneth, A., Barbosa, H., Benton, T., Calvin, K., Calvo, E., Connors, S., … Zommers, Z. (2019). Climate change and land: Summary for policymakers. an IPCC special report on climate change, desertification, land degradation, sustainable land management, food security, and greenhouse gas fluxes in terrestrial ecosystems. doi:10.4337/9781784710644
- Berdica, K. (2002). An introduction to road vulnerability: What has been done, is done and should be done. Transport Policy, 9, 117–127. doi:10.1016/S0967-070X(02)00011-2
- Biondini, F., & Vergani, M. (2015). Deteriorating beam finite element for nonlinear analysis of concrete structures under corrosion. Structure and Infrastructure Engineering, 11, 519–532. doi:10.1080/15732479.2014.951863
- Blomfors, M., Zandi, K., Lundgren, K., & Coronelli, D. (2018). Engineering bond model for corroded reinforcement. Engineering Structures, 156, 394–410. doi:10.1016/j.engstruct.2017.11.030
- Bradley, D., & Hehenberger, P. (2016). Mechatronic futures: Challenges and solutions for mechatronic systems and their designers. Springer International Publishing, Switzerland. doi:10.1007/978-3-319-32156-1_1
- Cavaco, E. S., Neves, L. A. C., & Casas, J. R. (2018). On the robustness to corrosion in the life cycle assessment of an existing reinforced concrete bridge. Structure and Infrastructure Engineering, 14, 137–150. doi:10.1080/15732479.2017.1333128
- Christidis, P., & Leduc, G. (2009). Longer and heavier vehicles for freight transport. JRC Scientific and Technical Reports, EUR 23933, 40. doi:10.2791/12276
- Cornelissen, H. A. W., Hordijk, D. A., & Reinhardt, H. W. (1986). Experimental determination of crack softening characteristics of normalweight and lightweight. Heron, 32, 45–56.
- Coronelli, D., & Gambarova, P. (2004). Structural assessment of corroded reinforced concrete beams: Modeling guidelines. Journal of Structural Engineering, 130(8), 1214–1224. doi:10.1061/(ASCE)0733-9445(2004)130:8(1214)
- DIANA FEA BV. (2017). FE-software DIANA 10.2. Delft, The Netherlands.
- Feenstra, P. H. (1993). Computational aspects of biaxial stress in plain and reinforced concrete. Delft University of Technology.
- FIB. (2013). Model Code 2010. FIB model code for concrete structures 2010. Lausanne, Switzerland.
- Gálvez, J. C., Červenka, J., Cendón, D. A., & Saouma, V. (2002). A discrete crack approach to normal/shear cracking of concrete. Cement and Concrete Research, 32, 1567–1585. doi:10.1016/S0008-8846(02)00825-6
- Hanjari, Z., Kettil, P., & Lundgren, K. (2012). Analysis of mechanical behavior of corroded reinforced concrete structures. ACI Structural Journal, 108, 532–541.
- Hendriks, M.A.N., de Boer, A., Belletti, B. (2017). “Guidelines for Nonlinear Finite Element Analysis of Concrete Structures”, Rijkswaterstaat Centre for Infrastructure, Report RTD:1016-1:2017.
- Jansson, A., Lofgren, I., Lundgren, K., & Gylltoft, K. (2012). Bond of reinforcement in self-compacting steel-fibre-reinforced concrete. Magazine of Concrete Research, 64, 617–630. doi:10.1680/macr.11.00091
- Jiradilok, P., Nagai, K., & Matsumoto, K. (2019). Meso-scale modeling of non-uniformly corroded reinforced concrete using 3D discrete analysis. Engineering Structures, 197, 109378. doi:10.1016/j.engstruct.2019.109378
- Jiradilok, P., Wang, Y., Nagai, K., & Matsumoto, K. (2020). Development of discrete meso-scale bond model for corrosion damage at steel-concrete interface based on tests with/without concrete damage. Construction and Building Materials, 236, 117615. doi:10.1016/j.conbuildmat.2019.117615
- Lundgren, K. (2005). Bond between ribbed bars and concrete. Magazine of Concrete Research, 57, 371–382. doi:10.1680/macr.2005.57.7.371
- Lundgren, K., Kettil, P., Zandi Hanjari, K., Schlune, H., & Roman, A. S. S. (2012). Analytical model for the bond-slip behaviour of corroded ribbed reinforcement. Structure and Infrastructure Engineering, 8, 157–169. doi:10.1080/15732470903446993
- Malm, R., & Holmgren, J. (2008). Cracking in deep beams owing to shear loading. Magazine of Concrete Research, 60, 381–388. doi:10.1680/macr.2008.60.5.381
- Muttoni, A., & Fernández Ruiz, M. (2012). The levels-of-approximation approach in MC 2010: Application to punching shear provisions. Structural Concrete, 13(1), 32–41. doi:10.1002/suco.201100032
- Nasr, A., Björnsson, I., Honfi, D., Larsson Ivanov, O., Johansson, J., & Kjellström, E. (2019). A review of the potential impacts of climate change on the safety and performance of bridges. Sustainable and Resilient Infrastructure, 1–21. doi:10.1080/23789689.2019.1593003
- Ng, P. L., Ma, F. J., & Kwan, A. K. H. (2019). Crack analysis of reinforced concrete members with and without crack queuing algorithm. Structural Engineering and Mechanics, 70(1), 43–54.
- Rots, J. G. (1988). Computational modelling of concrete fracture. Delft University.
- Rots, J. G., & Blaauwendraad, J. (1989). Crack models for concrete: Discrete or smeared? Fixed Multi-Directional or Rotating? Heron, 34(1), 3–59. doi:10.1096/fj.02
- Saether, I. (2011). Bond deterioration of corroded steel bars in concrete. Structure and Infrastructure Engineering, 7, 415–429. doi:10.1080/15732470802674836
- Shu, J. (2018). Shear assessment of a reinforced concrete bridge deck slab according to level-of-approximation approach. Structural Concrete, 19, 1838–1850. doi:10.1002/suco.201700283
- Tahershamsi, M., Fernandez, I., Zandi, K., & Lundgren, K. (2017). Four levels to assess anchorage capacity of corroded reinforcement in concrete. Engineering Structures, 147, 434–447. doi:10.1016/j.engstruct.2017.06.024
- Vecchio, F., & Collins, M. (1993). Compression response of cracked reinforced concrete. Journal of Structural Engineering, 119, 3590–3610. doi:10.1061/(ASCE)0733-9445(1993)119:12(3590)
- Wittmann, F. H., Rokugo, K., Brühwiler, E., Mihashi, H., & Simonin, P. (1988). Fracture energy and strain softening of concrete as determined by means of compact tension specimens. Materials and Structures, 21(1), 21–32. doi:10.1007/BF02472525
- Zandi, K. (2015). Corrosion-induced cover spalling and anchorage capacity. Structure and Infrastructure Engineering, 11, 1518–1547. doi:10.1080/15732479.2014.979836
- Zandi, K., Boubitsas, D., Fahimi, S., Johansson, M., Spetz, J., & Flansbjer, M. (2019). Autonomous automated non-intrusive condition assessment of concrete structures. Report ACE 2019:5. Gothenburg.
- Zandi, K., Ransom, E. H., Topac, T., Chen, R., Beniwal, S., Blomfors, M., … Chang, F.-K. (2019). A framework for digital twin of civil infrastructure - Challenges and opportunities. The 12th International Workshop on Structural Health Monitoring, Stanford, California, USA, September 10-12, 2019 (p. 7). Lancaster, PA: DEStech Publications, Inc.