
 ?Mathematical formulae have been encoded as MathML and are displayed in this HTML version using MathJax in order to improve their display. Uncheck the box to turn MathJax off. This feature requires Javascript. Click on a formula to zoom.
Abstract
Existing bridge performance metrics are limited in their ability to objectively reflect the safety and serviceability of bridges and identify effective Maintenance, Repair and Replacement (MR&R) actions for a large number of bridges in the face of budget constraints. This study presents a comprehensive optimal budget allocation framework with an integer linear programing formulation for a portfolio of bridges based on element-level inspection data. Considering budget constraints, this method determines optimal MR&R actions at element-level such that agency and user costs of repair actions required to have bridges in their like-new state at the next budget allocation year are minimized. The framework incorporates structural safety risks via the probability that the designated structural functionality of a bridge is or deemed to be compromised. The approach is applied to 484 National Highway Systems bridges in district 3 of Ohio. Results indicate that the proposed method can identify work plans comprising the optimal set of MR&R actions that maximize the network-level performance of bridge portfolios, while satisfying budgetary constraints. It is observed that this method consistently assigns higher priority to work plans that reduce structural safety risks of bridges, and to bridges with high traffic demands and long detour lengths.
Introduction
Bridges are vital components in transportation systems, providing essential support for various economic activities and services for communities. These assets deteriorate differently due to differences in their exposure to various environmental stressors and service loads, and having diverse ages, configurations, and structural features. Moreover, available budget to Maintain, Repair and Replace (MR&R) bridges is limited. The management of this budget is governed by various local and government owners of bridges. These factors, among others, pose a significant challenge for objective evaluation of the performance of bridge portfolios and efficient management of their safety and serviceability.
Various bridge performance measures have been developed and implemented by state Departments of Transportation (DOTs), FHWA, NCHRP, and other agencies and researchers to serve as tools for management and operation of bridges in transportation systems. The choice of an appropriate performance measure depends on agency goals and policies, level of decision-making, and bridge type, among other factors (Patidar et al., Citation2007). Consequently, various types of metrics have been developed over the years for different purposes. These metrics are being used to support goals such as preservation maintenance and allocation of funds for rehabilitation, replacement and improvement of bridges. These metrics include, among others, General Condition Ratings (GCR) of deck, superstructure, substructure, and culvert (Federal Highway Administration (FHWA), Citation1995), Deficiency Rating (DR) (Richardson, Turner, Hale, & Sharpe, Citation2009), Sufficiency Rating (SR) (Federal Highway Administration (FHWA), Citation1995), Structurally Deficient (SD) and Functionally Obsolete (FO) (American Society of Civil Engineers, Citation2017), Bridge Health Index (BHI) (Shepard & Johnson, Citation2001), Denver BHI (Jiang & Rens, Citation2010a), Geometric Rating (GR) (Minnesota Department of Transportation, Citation2015), and Vulnerability Rating (VR) for scour criticality (New York State Department of Transportation, Citation1991). Survey results showed that agencies are more likely to use performance measures for decision-making regarding rehabilitation, replacement and improvement projects than for preservation maintenance projects (Adams, Kang, & Pincheira, Citation2009). Preservation actions, however, can be used to prolong the service life of bridge assets and reduce the MR&R costs of bridges throughout their service life (Federal Highway Administration (FHWA), Citation2018). Thus, development of frameworks that can assign cost-effective preservation actions are significant for the management of bridge assets.
A limited number of performance measures have been developed for the prioritization of preservation actions. For instance, Australia and a number of states in the U.S. including Ohio, North Carolina, Minnesota, and Utah have used Bridge Sustainability Ratio (BSR) for long-term assessment of bridge preservation actions. BSR is defined as the ratio of the budget allocated for maintenance and preservation of bridges over time, by the amount of budget needed to achieve a specific bridge condition target (Proctor, Varma, & Varnedoe, Citation2012). Estimation of the latter budget is challenging since it involves the definition of target conditions, which varies among state DOTs. Bridge Preservation Index (BPI) was also suggested by Caltrans to facilitate bridge preservation decision-making. BPI assigns importance factors to the health indexes of three bridge members, i.e. deck, paint, and joints, to calculate an index that ranges from 0 to 100 (Johnson & Bruton, Citation2014). Appropriate times for preservation actions are then identified using BPI and the overall bridge condition. However, BPI and BSR subjectively assign preservation actions based on estimations and engineering judgment. On the other hand, AASHTOWare Bridge Management (BrM, https://www.aashtowarebridge.com/), a commonly used bridge management software program by U.S. DOTs, utilizes the performance metric BHI for decision-making of bridges. Yet, BHI has been shown to inaccurately represent the health condition of bridges (Fereshtehnejad, Hur, Shafieezadeh, & Brokaw, Citation2017a; Jiang & Rens, Citation2010b). These limitations warrant development of more accurate and reliable performance measures for decision-making.
For this reason, in collaboration with Ohio DOT, a comprehensive and objective performance measure, called Ohio Bridge Condition Index (OBCI), was developed by the authors in previous publications (Fereshtehnejad, Hur, Shafieezadeh, & Brokaw, Citation2017b; Fereshtehnejad et al., 2018a). OBCI is a cost-based index that ranges from zero to one and represents the performance of bridges at element-, component-, bridge-, and portfolio-levels. Ohio DOT defines bridge elements as parts of a bridge such as pier columns, bearing devices, etc., and components as elements of the bridge (Fereshtehnejad et al., 2017b; Ohio Department of Transportation, Citation2014), e.g., superstructure and substructure. The same definitions for elements and components are used in this paper. Effects of serviceability and safety features of bridges are objectively incorporated in this index through a broad set of direct and indirect consequences of various bridge conditions using the unified metric of cost. Consequently, the integration of OBCI, as an objective and reliable performance measure, into optimal budget allocation algorithms could significantly enhance the safety and serviceability of bridge systems.
In this study, an optimization formulation based on Integer Linear Programing (ILP) techniques is developed to apply this novel index for systematic optimal budget allocation and identification of the optimal MR&R work plans for bridges using element-level inspection results. Considering budget limits, the proposed method determines optimal actions at element-level for all bridges in the population such that the OBCI performance of the bridge portfolio is maximized. This objective is demonstrated to be equivalent to minimizing costs of repair actions required to have the entire bridges in the portfolio in their like-new state at the next budget allocation year, considering the probability of structural non-functionality (indicating structural safety risks) until the next budget allocation year. Therefore, this framework is applicable to all State DOTs, where element-level condition-states and component-level condition rating data are available from inspection data.
Notably, there are a few studies and software applications that propose optimization algorithms for scheduling rehabilitation and maintenance actions for large bridge portfolios, including (Bai, Labi, Sinha, & Thompson, Citation2013; Sinha, Labi, McCullouch, Bhargava, & Bai, Citation2009; Thompson, Sinha, Labi, & Patidar, Citation2008). The recent practice by DOTs to collect elements-level data has provided new opportunities for evaluation of bridge conditions. As the new procedures and data were not present at the time of previous studies, they resorted to simplified conditions to conduct optimization. Such simplifications reduce the granularity and eventually the accuracy of the optimization results. Additionally, structural safety risks were not directly accounted for in the algorithms.
The proposed framework in this study employs branch and bound method as the ILP solution algorithm to accurately identify optimal actions with limited computational demand; a feature that enables accurate solution for large-scale bridge management problems with high level of action granularity. While not limiting the generality of its application, the developed approach is applied to a case study of 484 National Highway System (NHS) bridges in district 3 of Ohio, and optimal actions for the elements of these bridges are identified. It is shown that the framework systematically prioritizes repair actions on bridges with safety concern and those with high traffic demand and long detour length to enhance their serviceability functionality.
The rest of this paper is organized as followed. An overview of the OBCI is provided in Section 2. In Section 3, the proposed optimal budget allocation framework is presented. In the following section, the proposed framework is used for identification of optimal MR&R actions for the set of NHS bridges in district 3 of Ohio. In Section 5, the identified optimal repair work plan is discussed. The validity of the results is evaluated through four validation tests in Section 6. Finally, conclusions are provided in Section 7.
Ohio bridge condition index
Ohio Bridge Condition Index (OBCI) is a cost-based index that ranges from zero to one and represents the performance of bridges at element-, component-, bridge-, and network-levels. Effects of serviceability and safety features of bridges are incorporated in this index through a broad set of direct and indirect consequences of various bridge conditions using the unified metric of cost. Three variations of OBCI are developed including,
and
(Fereshtehnejad et al., 2017b; Fereshtehnejad et al., Citation2018a). In
the proximity of the system to minimum acceptable conditions for its constituent elements is evaluated. The agency and user costs of implementing repair actions on bridge elements that do not meet the minimum condition-state thresholds,
and
respectively, are compared with the agency and user costs of replacing the system,
and
respectively.
is formulated as follows:
(1)
(1)
compares the current condition of the system to the like-new condition of the system. Similarly, the costs to improve all elements of the system to their like-new state,
and
respectively, are compared with the incurred cost to replace the system. In mathematical terms:
(2)
(2)
With the performance objective of reaching like-new state, quantitatively accounts for structural safety risks associated with severity, extent, location, and pattern of defects for major bridge elements. In this study, maximizing the network-level
i.e.
is considered as the objective for the developed optimal budget allocation algorithm, as it quantitatively incorporates structural safety risks of bridges, in addition to agency repair costs and serviceability interruptions on users. Additionally, this objective is shown to be equivalent to minimizing agency and user costs to have bridges in the portfolio in their like-new state at the next budget allocation year, considering structural safety risks until the next year.
In mathematical terms, network-level for a portfolio of bridges,
is articulated as:
(3)
(3)
where
is the probability of structural non-functionality of bridge
due to structural defects,
and
are the costs incurred on the agency and users to improve bridge
to its desired state of like-new,
and
are the costs incurred on the agency and users to replace bridge
and
is the total number of bridges in the network. The term structural non-functionality refers to any instance that the designated structural functionality of the bridge is or deemed to be compromised. Some of the causes of structural non-functionality include considerable defects in structural elements, and local or global failure in the bridge or its components under live loads, natural hazard loads, or impact loads from accidents. These events lead to the replacement, major rehabilitation, load posting or closing the bridge.
In EquationEquation (3)(3)
(3) , the term
quantifies the structural safety risk for bridge
through multiplication of the probability of structural non-functionality during a certain period of time and the consequences of that event, which is the replacement of the bridge. On the other hand, if the bridge remains structurally functional during that period with the probability of
in order for the bridge to be at its like-new state, the cost of
will be incurred on the agency and users at the end of this time period. This cost is calculated by the term
in EquationEquation (3)
(3)
(3) . These risk-based costs for all bridges in the portfolio are then compared with the replacement cost of those bridges in the denominator, which is the costliest scenario for the management of those bridges.
The agency and user costs of and
in EquationEquation (3)
(3)
(3) include a comprehensive list of costs considered by Fereshtehnejad et al. (Fereshtehnejad et al., 2017b; Fereshtehnejad et al., 2018a) for bridge management practices. The agency costs include MR&R actions, Maintenance of Traffic (MOT), and Administration, Engineering, and Mobilization (AEM) to improve the condition-state of the constituent elements of bridge
to their like-new state. The incurred user cost is comprised of Delay time, Vehicle operations, and Excess gas emission (DVE) due to performing such repairs. To calculate these agency and user costs, Fereshtehnejad et al. (Fereshtehnejad et al., Citation2018b) developed a set of procedures and models based on element-level condition data and other bridge information, which are compatible with the most recent bridge inspection practices by state DOTs.
The MR&R costs are calculated as a function of the quantity of elements in each of the condition-states, together with the unit costs of MR&R actions for improving those elements to the like-new or minimum safe and serviceable states. Reduction factors are also applied when calculating for component-level and bridge-level repair projects. The MOT cost is formulated considering the duration of the repair project, the cost of crew and equipment to protect the work zone, and the cost of law enforcement, if the conditions are met for them to be present in the work zone. The cost of AEM is represented by an agency-identified overhead factor multiplied by the sum of the other two agency costs, MR&R and MOT. The user costs of DVE are also quantified by the unit costs of DVE for cars and trucks times the incurred delay time due to repair projects on bridges. The delay time is mathematically expressed considering the available detours and the duration of the repair projects. More details on the calculation procedures of the MR&R, MOT, AEM, and DVE costs can be found in Fereshtehnejad et al. (Fereshtehnejad et al., 2017b; Fereshtehnejad et al., 2018b).
Since State DOTs often annually allocate their budget for bridge MR&R actions, a period of one year can be considered for the estimation of in EquationEquation (3)
(3)
(3) . On this basis, identifying the MR&R work plan that maximizes the
for those bridges could assist in optimal allocation of the budget such that the desired objective of getting as close as possible to the like-new state of bridges for the next budget allocation year is achieved. For this purpose, the next section presents a mathematical budget allocation framework for the identification of the MR&R work plan that maximizes the
of a bridge portfolio considering agency’s budget at the current year. In this section, it is also shown that this objective is equivalent to minimizing agency and user costs to have bridges in the portfolio in their like-new state at the next budget allocation year, considering structural non-functionality probabilities until the next year.
An optimal budget allocation framework for bridge porfolios
In this section, an optimal budget allocation algorithm is proposed that finds the optimal MR&R work plan for a portfolio of bridges with element-level condition-state and cost data. The algorithm identifies optimal MR&R actions for elements of bridges in a portfolio such that:
The cost of implementing those actions does not exceed the available budget for the bridge portfolio.
The performance of bridges, in terms of the network-level
of the portfolio, is maximized. This is equivalent to minimizing agency and user costs to have bridges in the portfolio in their like-new state at the next budget allocation year, considering the probabilities of structural non-functionality of bridges until the next year.
The objective to find the MR&R work plan such that the foregoing performance of the network is maximized can be mathematically presented as follows:
(4)
(4)
where
and
are the costs incurred on the agency and users to improve bridge
to its like-new state at the next budget allocation year following the implementation of work plan
on this bridge,
and
are the costs incurred on the agency and users to replace bridge
is a binary decision variable taking the value of 0 or 1, indicating consideration or disregard of work plan j on bridge
at the current year,
is the total number of work plan combinations for bridge
and
is the probability of structural non-functionality of bridge
after performing work plan
until the next budget allocation year. In EquationEquation (4)
(4)
(4) , a work plan j on bridge
is a set of MR&R actions on elements of bridge
(including do-nothing on bridge elements). Identification of these work plans are elaborated later in the section.
Evidently, selection of any work plan does not affect the term in the denominator of EquationEquation (4)(4)
(4) , i.e.,
Additionally, maximizing 1 minus a term is equal to minimizing that term. Therefore, the objective can be expressed as:
(5)
(5)
EquationEquation (5)(5)
(5) shows that the objective of the optimization problem is to minimize agency and user costs to have bridges in the portfolio in their like-new state at the next budget allocation year, considering the probabilities of structural non-functionality of bridges until the next year. This is also in line with State DOTs’ goal to minimize their annual budget needs for their bridge inventory.
Considering an upper bound for the agency’s budget for MR&R actions, and the entire possibilities for practical MR&R actions for each bridge in the network, the optimal budget allocation algorithm can be described as follows:
(6)
(6)
where
is the agency cost of implementing work plan
on bridge
at the current year, and
is the maximum available budget at the current year for the considered bridge portfolio. By solving EquationEquation (6)
(6)
(6) , optimal values of 0 or 1 are identified for decision variables
for each action combination of each bridge (including do-nothing). As a result, the agency knows the optimal action combination for each bridge in the portfolio. In EquationEquation (6)
(6)
(6) , the first constraint, i.e. 6(a), forces the solution algorithm to explore solutions that require a total agency cost less than the available budget. Constraint 6(b) assures decision variables are integer binary values, and finally constraint 6(c) guarantees that only one action combination is selected (i.e., has a value of 1) for each bridge in the portfolio. Notably, while the term
can capture the effect of deterioration in elements or components until the next budget allocation year, the effect of long-term deterioration is not accounted for. Relaxation of this limitation can be investigated in future studies by integrating life-cycle bridge deterioration and performance models into the proposed decision-making framework.
One advantage of this framework is its compatibility with element-level condition-state data, which is the most recent inspection practice by State DOTs. Following this new AASHTO recommended element-level rating system (AASHTO, Citation2019), State DOTs report the quantity of each bridge element in condition-states 1 − 4; representing the state of “Good, Fair, Poor, and Severe”, respectively (Ohio Department of Transportation, Citation2014). This allows for detecting elements that need MR&R actions and thus determining combinations of repair work plans for a bridge from a list of actions for those elements that are in need of repair. As a result, the determined optimal repair work plan following EquationEquation (6)(6)
(6) provides detailed actions on elements of each bridge in the portfolio. Additionally, the systematic cost estimation procedures that were summarized in Section 2 are implemented to estimate repair costs of action combinations in EquationEquation (6)
(6)
(6) . As discussed, through these procedures, project-level costs are objectively assessed from element-level unit costs and quantities in condition-states, among other factors. Therefore, the proposed budget allocation framework incorporates accurate and objective project-level costs, which are essential for identifying realistic and optimal MR&R work plans for each bridge.
For enhancing the resolution and practicality of the framework, when identifying work plan possibilities for each bridge, a number of safety-related and practical constraints are considered, as follows:
For practical considerations, all elements within a component receive identical type of action that is either of the following:
No action for all elements (called do-nothing).
Only those elements that have a condition worse than their “minimum safe and serviceable state” receive critical repairs (called critical repairs). While not limiting the generality of the framework, the authors of this study have determined the “minimum safe and serviceable state” for an element as follows:
For a primary bridge element, such as girders, less than 2% of the element is in condition-state 3, while no quantity is in condition-state 4.
For a non-primary bridge element, such as railings, less than 10% of the element is in condition-state 3 and 4.
The overall rating of the component, which contains that element, represents a condition better than or equal to “satisfactory” (Federal Highway Administration (FHWA), Citation1995). It is notable that element-level rating system signifies the severity and extent of defects in bridge elements (Ohio Department of Transportation, Citation2014), whereas the criticality in the location and pattern of those defects (for major elements in the load path of bridges) are reflected in the overall rating of the components that entail those elements. These component ratings, in addition to element-level ratings, are parts of inspection reports provided by State DOT bridge inspectors (Ohio Department of Transportation, Citation2014).
Additionally, if all elements in a component or all elements in a bridge meet the foregoing conditions, that component, or bridge is recognized to be at the “minimum safe and serviceable state”. Based on the forgoing explanations, critical repair for an element is defined as:
All portions of the element that are in condition-state 3 and 4 are repaired to be improved to at least condition-state 2.
If no portions of the element are in condition-state 3 and 4, those quantities of the element in condition-state 2 receive maintenance/preservation actions.
(d) All elements receive repairs that improve them to their like-new state (called like-new repairs). Considering the new element-level condition-rating system, the “like-new” state of an element, component, or a bridge, is defined as follows:
All portions of the element (or elements in a component or bridge) are in condition-states 1 and 2.
On this basis, like-new repair for an element is defined as critical repairs on parts in condition-state 3 and 4, and maintenance/preservation actions on parts in condition-state 2 (which maintain these portions in condition-state 2).
(e) The component is replaced.
• On this basis, a component can have up to four types of actions, and subsequently a bridge with the three components of deck, superstructure, and substructure can have up to 34=81 action combinations (i.e. the term in EquationEquation (6)
(6)
(6) ).
If sum of the agency and user costs of actions on a component is larger than the sum of the agency and user costs of replacing that component, the latter is considered.
If sum of the agency and user costs of actions on components of a bridge is more than the sum of the agency and user costs of replacing the bridge, the latter is considered.
If the maximum available budget is less than or equal to the required budget to improve all bridge elements in the network to their minimum safe and serviceable state, only critical repairs and do-nothing are considered as action possibilities for bridge components. This allows the budget to be only allocated for critical repairs rather than maintenance and preventive actions.
If the maximum available budget is more than the required budget to improve all bridge elements in the network to their minimum safe and serviceable state, the following action possibilities are considered for each component:
For components with at least one element in a condition worse than the minimum safe and serviceable state: critical repairs, like-new repairs, and component replacement.
For components with all elements in a condition healthier than the minimum safe and serviceable state: do-nothing, critical repairs, like-new repairs, and component replacement.
It should be noted that action possibilities may be adjusted based on the practice of the agency, available resources, and funding programs. Additionally, while even extensive bridge projects could be performed within budget allocation cycles, some State DOTs may plan to perform bridge replacement projects in multiple years into the future (e.g. Virginia DOT’s six-year improvement program (Virginia Department of Transportation, Citation2019a)), and therefore could exceed the next budget year. In these cases, adjustments will be needed to include those projects alongside short-duration repair actions, which could be explored in future studies.
After identifying action combinations for components, agency and user costs to improve elements of those components to their like-new state are calculated for each of those action combinations (i.e., the terms and
in in EquationEquation (6)
(6)
(6) ). This is done based on improvements gained in terms of the quantities of elements in condition-states and component condition ratings. Additionally, based on the improvements gained by actions, the probability of structural non-functionality, i.e.,
following these actions are estimated for each action combination and inserted in EquationEquation (6)
(6)
(6) . After these input variables are fed into the integer programming formulation in EquationEquation (6)
(6)
(6) , the optimal element-level action set (including do-nothing) for each component of each bridge in the portfolio is identified. A flowchart summary of the optimization framework is provided in . Based on the foregoing arguments, it is evident that the proposed optimal budget allocation framework is applicable to all State DOTs, where the following input data are available:
Figure 1. A flowchart summary of the optimization framework.
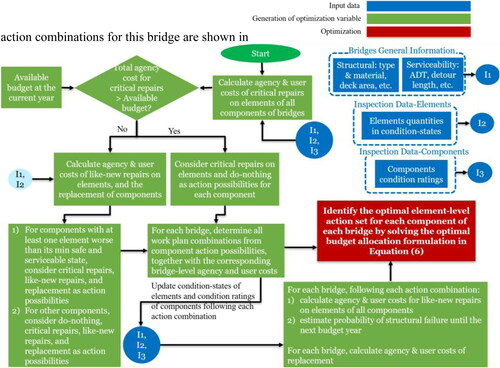
Element-level condition-states and quantities;
Component-level condition ratings;
Bridge general information, including Average Daily Traffic (ADT), deck area, detour length;
Action costs and improvements.
For further clarification of the proposed formulation and its solution, let’s assume an arbitrary bridge B with three components:
Deck and substructure with some elements that do not meet their minimum safe and serviceable state.
Superstructure with all elements in a condition better than their minimum safe and serviceable state, while some do not meet the like-new condition.
Herein, two cases are considered. In the first scenario, the available budget for this bridge is more than the required budget to improve all elements of the bridge to their minimum safe and serviceable state, In the second case, the available budget is less than
All action combinations for this bridge are shown in . As can be seen, when the available budget is less than
only actions that target the safety of the bridge, i.e. critical repairs, within the available budget are considered. The total number of action combinations for this case is four. When the available budget is more than
actions that improve the condition of elements to like-new state are also considered. Notably, with eight action possibilities in this case, “do nothing” is not considered as an alternative for the deck and substructure components, which have at least one element in a condition worse than the minimum safe and serviceable state. This is due to the fact that with the available budget in this case, actions that improve all elements of the bridge to at least the minimum safe and serviceable state can be afforded.
Table 1. List of action combinations for a sample bridge as a function of the available budget.
To find the optimal set of actions for this bridge given the available budget using EquationEquation (6)(6)
(6) , one may evaluate all possible actions one-by-one (exhaustive search solution). This approach becomes computationally intractable when the number of bridges is even moderate. For instance, a portfolio of ten bridges will have
action possibilities when each bridge has eight possible action combinations similar to the arbitrary bridge B in the previous example. As can be seen, the optimization problem to solve (presented in EquationEquation (6)
(6)
(6) ) is a binary ILP, where the objective function and constraint equations are linear, and the problem variables, i.e.
are integer values that can be either 0 or 1. This problem is a special case of knapsack problem, for which multiple time-efficient solution algorithms exist (Thompson et al., Citation2008). Among these algorithms, the “Branch and Bound” technique have been proven to have polynomial time complexity (Thompson et al., Citation2008; Zemel, Citation1980); indicating a linear relationship between the required runtime and the scale of the problem (e.g. number of bridges in the portfolio). This feature offers the ability to solve large-scale bridge management problems. This solution algorithm successively builds subdivisions to find the absolute optimal solution or get close to the absolute solution approximated within a tolerance value identified on the objective function (Nemhauser & Wolsey, Citation1988). Using this solution method in the MATLAB programing software version 2018a (MathWorks & MATLAB, Citation2019), the optimal work plan for the case study comprising 484 NHS bridges in district 3 of Ohio is found within 20 hours using a normal personal computer with a core-i7 processor.
Case STUDY bridge portfolio
The developed computer program based on the proposed optimal budget allocation framework is employed to assign the optimal MR&R work plan for the 484 NHS bridges in district 3 of the state of Ohio. The element-level inspection data collected in 2017 are used for this task. According to the feedbacks from district 3 engineers, the minimum agency cost for any MR&R project on a bridge, which is also an input for the code implementation of the developed approach, is considered as $20 K.
According to the cost calculations using the OBCI framework, the minimum budget required to bring elements of the 484 bridges that are below their minimum safe and serviceable state to the acceptable state is estimated as $171.4 Million. As mentioned in the previous section, this value is called the “minimum required budget”. The maximum required budget, which is needed to improve all elements of these bridges to their like-new state, is estimated as $304.0 Million. This value is called the “maximum required budget” in this paper.
Input models for the optimal budget allocation algorithm
According to EquationEquation (6)(6)
(6) , the agency and user costs for improving bridges into their like-new state should be calculated at the time of the next budget allocation year, which depend on the condition of elements and components at that time. For the following two reasons it is assumed that condition-state of elements and condition rating of components remain the same until the next year:
Lack of deterioration data for bridge elements in Ohio at this time.
Ohio DOT provides condition assessments for bridges on an annual basis. Therefore, at the time of decision-making element and components have been inspected in less than a year, and the appraised values only slightly deteriorate until the next budget allocation year.
This assumption can be relaxed in future studies with the proposed framework incorporated in a lifecycle cost optimization method.
One way to calculate the probability of structural non-functionality of bridges until the next decision-making year, i.e., in EquationEquation (6)
(6)
(6) , is to conduct numerical analysis for each bridge in the portfolio based on the condition-state of its elements after performing workplan
Considering multiple possibilities of workplan combinations for each bridge and the time-consuming nature of probabilistic nonlinear structural analysis for computing
this process requires significant runtime. While heuristic algorithms or other alternative methods can be explored for calculating
for the purpose of demonstration in this paper, this term is approximated as a function of the overall ratings that bridge inspectors identify for each component. This could be justified considering that these ratings (also referred to as NBI general condition ratings (GCR)) provide an overall assessment of structural load-carrying elements (Federal Highway Administration (FHWA), Citation1995), which could be correlated with the safety of bridge components. Considering that the GCR of a member remains constant until the next inspection year, the annual probability of structural non-functionality of a bridge member is modeled as a function of GCR from inspection reports.
As mentioned in (Fereshtehnejad et al., 2018a, and Fereshtehnejad, Zhang, Hur, & Shafieezadeh, Citation2018c), this function is approximated based on engineering elicitation of the authors through a second order polynomial curve (), where probability of structural non-functionality increases at a higher rate with lower GCRs. This curve is constructed using three approximately known probabilities:
Figure 2. The model considered for the estimation of probability of structural non-functionality as a function of NBI general condition rating (Fereshtehnejad et al., 2018a; Fereshtehnejad et al., Citation2018c).
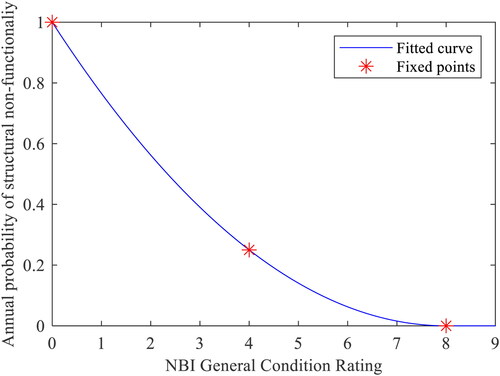
According to AASHTO LRFD bridge design specification (American Association of State Highway and Transportation Officials (AASHTO), Citation2012) and Swanson and Miller (Swanson & Miller), the annual rate of failure for substructure/superstructure components with a GCR of 8 is 3.1e-6 (which is also equal to the failure probability of 3.1e-6 within a year). For culvert and channel components the same value is specified.
According to the descriptions of GCRs (Federal Highway Administration (FHWA), Citation1995), a GCR of 0 indicates failed condition.
According to the descriptions of GCRs (Federal Highway Administration (FHWA), Citation1995), a component/bridge in poor condition (i.e., GCR 4) has advanced damage in its structural elements. Recorded data of bridge management practice in Virginia DOT (Virginia Department of Transportation, Citation2019b; Virginia Department of Transportation, Citation2018; Virginia Department of Transportation, Citation2015) shows that 20-23% of bridges with a GCR less than or equal to 4 (among which around 95% are in GCR 4) are replaced, rehabilitated or removed, annually. Several factors contribute to arriving at those decisions. These factors may include the potential of the bridge failing under live or extreme loads, the safety perception of the public that use the bridge, and the contribution of bridge condition to increased rate of accidents, among others. Here, it is assumed that the statistics of bridge replacements, rehabilitation, or removal reflects an analysis of these factors, and therefore can be used to determine the probability that the bridge reaches a functionality state that has to be improved or closed on traffic. It should be noted that implementation of these actions in reality faces budget constraints. To adjust for the effects of budget constraints on statistics of bridge replacements and to take a more conservative stance on potential consequences, here, 25% is used as the rate of bridges in condition state rating of 4 that reach to a level of non-functionality that have to be replaced.
It is notable that after performing critical repairs on elements of a component, the corresponding GCR is assumed to be improved to maximum of 7 (state of “Good”) and the component rating of that component before the repair workplan. Similarly, after performing repair actions that improve the condition-states of constituent elements of a component to their like-new state, the GCR of that component is considered to jump up to maximum of 8 (the state of “Very good”) and the component rating of that component before the repair workplan.
At bridge-level, the minimum of the summary ratings of structural components of a bridge, i.e., superstructure, substructure, and culvert, is considered as the GCR of that bridge (similar to safety estimation of a series system), which is called the bridge General Appraisal (GA) following Ohio DOT bridge management practices. Thus, having known GCRs of bridge components, the GCR, and consequently, the annual probability of structural non-functionality of the bridge can be estimated.
Optimal actions for the 484 nhs bridges in district 3 of ohio
A budget limit of $15,000,000 is considered for the prioritization of repair/preservation of the 484 NHS bridges in district 3 of Ohio. Based on the total deck area of bridges in the portfolio and the average unit budget per deck area that is often allocated for bridges in the state of Ohio, Ohio DOT bridge engineers deemed this budget a realistic estimate for the case study bridge portfolio in this study. After implementation of the proposed framework, the optimization algorithm determined 100 bridges to receive MR&R actions other than do-nothing. For the rest of the bridges, do-nothing is the optimal work plan for their elements considering the constraint on the overall budget. The details of the optimal MR&R actions for these bridges can be found in Supplementary Material. In these results, all NHS bridges in district 3 that are selected to receive MR&R actions, as well as the description of the MR&R actions for their elements, the agency cost for performing these MR&R actions, an estimate for the project-level duration of the MR&R actions, and the user cost of the project are presented. For illustration purposes, a sample of such results is shown in .
Table 2. A sample of the optimal element-level MR&R actions for an NHS bridge in the inventory.
Based on the optimal actions, presents the sum of MR&R costs incurred on the agency to perform the optimal actions differentiated by element types. Noticeably, the costs in this table are calculated considering MR&R actions that are individually performed on those elements (i.e., project-level reduction factors are not considered). This table also shows the contribution of each type of element in the total agency cost identified for the bridge portfolio. According to this table, the costliest element recommended for MR&R actions is steel protective coating, which consumes about 35% of the total MR&R budget. Furthermore, 51 bridges (51%) among the 100 bridges that receive MR&R action budgets (i.e., 11% of bridges among total NHS bridges in district 3) are found requiring MR&R actions for their reinforced concrete abutments. Interestingly, albeit with the limited budget, the framework suggests replacing four deck components due to the significant reduction offered by the replacements to the overall structural safety risks of district 3 NHS bridges. The budget for replacing these decks is approximately 10% of the total MR&R budget.
Table 3. Total agency costs of performing the optimal MR&R actions for different types of elements in the considered bridge portfolio.
The optimization algorithm shows that the implementation of the optimal actions leads to 3% improvement in the network-level of the considered bridge portfolio, i.e. an improvement from 0.706 to 0.731 (calculated according to EquationEquation (3)
(3)
(3) ). Considering that the available budget is only 9% of the minimum required budget, this projected improvement seems appropriate. Additional validation studies are performed in the following section to ensure the validity of the identified optimal actions for the case study portfolio.
Validation STUDIES
Selection of repair alternatives with high benefit to cost ratio in the optimal work plan
According to the formulation of the optimal budget allocation algorithm, presented in EquationEquation (6)(6)
(6) , if the agency’s budget is less than the required cost to improve all bridges to their like-new state (which commonly happens), actions that bring the most possible benefit to the network will be selected such that sum of the required cost fits the available budget. Based on EquationEquation (3)
(3)
(3) this maximum benefit for a bridge is achieved when the agency and user risk costs to reach the like-new state of the bridge after the MR&R work plan are minimized. Using this equation, the benefit achieved by a work plan over the cost spent by the agency (i.e. benefit to cost ratio) for a bridge B can be mathematically presented as:
(7)
(7)
To evaluate whether bridge-level work plans with maximum benefit to cost ratios are selected in the optimal work plan of the network, a bar chart is plotted in . The chart demonstrates the percentage of bridges selected to receive optimal work plans in various ranges of benefit to cost ratios. It is worthy to mention that, only 253 bridges out of the 484 bridges have work plan combinations, among which the optimization code should identify the optimal plans. Bridges that have no repair work plan combinations are in a condition better than or equal to their minimum safe and serviceable state. As expected, the code has selected all bridges in the 9 out of 10 highest categories of benefit to cost ratios. This shows the effectiveness of the code in selecting bridges with the highest available benefit to cost ratios as optimal decisions for a bridge portfolio, which generally results in the highest possible network-level for the portfolio.
Figure 3. Percentage of bridges selected to receive optimal work plans in various ranges of benefit to cost ratios.
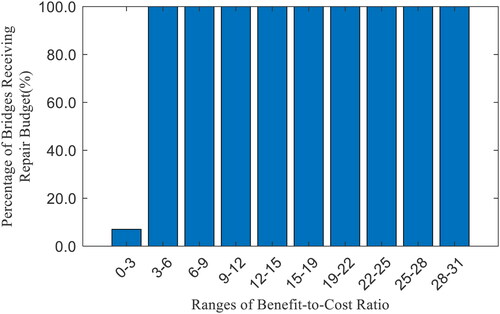
It should be mentioned that for any of the 253 candidate bridges in this district, the representative benefit to cost ratio that is considered in is the one with the largest value of benefit to cost ratio. For instance, if a bridge has three different work plan combinations with benefit to cost ratios of 3.5, 7.6, and 5.4, respectively, 7.6 is considered as the benefit to cost ratio for that bridge. Noticeably, out of the 100 selected bridges by the optimization algorithm that received budget for MR&R actions, 50 have more than or equal to two variations of repair work plans with different benefit to cost ratios. Looking individually at these 50 bridges, the identified optimal repair work plans for as high as 41 bridges have the highest benefit to cost ratios among all their work plan possibilities. The reason for the 9 bridges that are selected with a work plan having a benefit to cost ratio less than the maximum value is the limitation in the available budget and the large cost of performing work plans with higher benefit to cost ratio.
Selection of bridges with low and general appraisal in the optimal work plan
Based on the formulation of presented in EquationEquation (3)
(3)
(3) , bridges with lower
values are more likely to have safety-related costs than other bridges. These safety concerns can be usually addressed with a repair cost that is relatively small compared to the corresponding safety consequences. Therefore, it is likely that large benefit to cost ratios can be achieved if these bridges are repaired, which therefore increases the likelihood of these bridges to be selected for the optimal work plan. Furthermore, given the direct correlation between safety-related costs and GA values, it is generally expected that bridges with lower GA values should be also given priority. Therefore, it is expected that a general correlation is observed in the percentage of bridges receiving repair budget as
and GA values decreases.
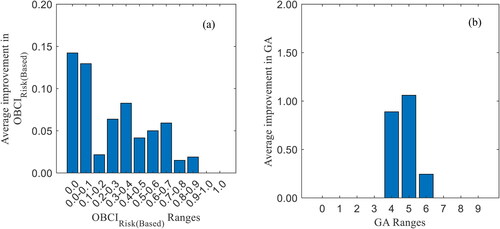
presents the percentage of bridges identified to receive optimal repairs in various ranges of A similar result is plotted for various ranges of GA in . As expected, a meaningful correlation between
of a bridge, as well as its GA, and the assigned budget for MR&R actions for that bridge is found. Generally, the percentage of bridges with lower
and GA values that receive optimal budget is large and this ratio decreases as
or GA of the bridges increases. Nevertheless, a more refined trend can be extracted from the
curve compared to the GA plot, which has only 5 meaningful categories (i.e., GA of 4 ∼ 8). Additionally, to further investigate the effectiveness of
and GA in performance evaluation of bridges, illustrate, respectively, the average improvement in
and GA following the implementation of the optimal work plans. As can be seen, a more significant correlation exists in the amount of improvement in
of bridges with decreasing
than that in the GA performance index. These results indicate one of the superiorities of
as an index for optimal MR&R decision-making.
Figure 4. Percentage of bridges selected to receive the optimal work plan in various ranges of a) b) General Appraisal (GA) values.
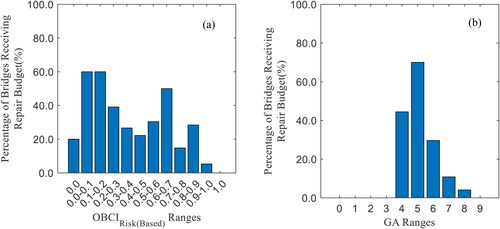
Figure 5. Average improvements in various ranges of a) and b) General Appraisal (GA) values.
Selection of bridges with high traffic demand and long detour length in the optimal work plan
Bridges with high ADT and/or long detours incur large user costs if repair actions are required to improve their condition to the desired like-new state. According to EquationEquation (3)(3)
(3) , this could result in small values of
as well. For these bridges, agency costs of repair actions are often considerably less than the incurred user costs as a result of performing those repairs. This is equivalent to a large benefit to cost ratio for such repair actions. Therefore, the optimal budget allocation algorithm generally gives higher priority to bridges with high values of ADT and/or long detours. This effect is evaluated in , where the percentage of bridges selected to receive optimal MR&R actions are shown versus various ranges of the product of ADT and the detour length. As the results show, higher priority is given to work plans for bridges with high ADT and long detours.
Figure 6. Percentage of bridges selected to receive the optimal work plan in various ranges of a) ADT times detour length, b) and ADT times detour length.
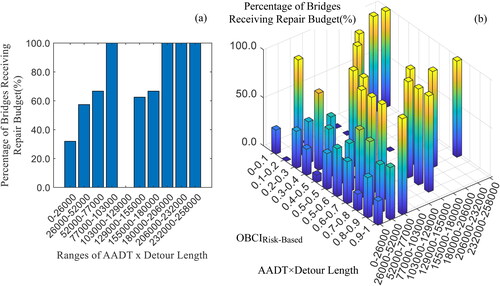
A stronger trend can be found in , where the effect of ADT times detour length is concurrently evaluated with in the selected optimal work plan. As a general trend in , higher priority is given to bridges with lower values of
and higher values of ADT times detour length to receive budget for MR&R actions. This trend becomes stronger for larger values of the product of ADT and detour length.
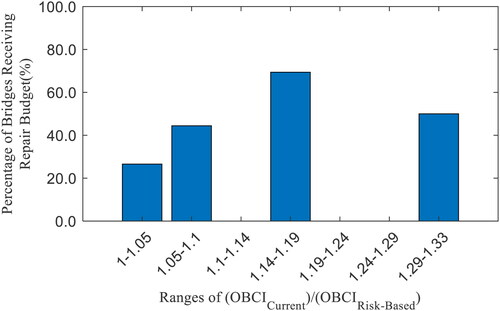
Selection of bridges with safety concerns in the optimal work plan
As mentioned in Section 2, the only difference between the formulations of and
is the incorporation of structural safety risks of bridges in
Thus, a large difference between
and
for a bridge indicate the existence of safety concerns for the bridge (Fereshtehnejad et al., 2018a). As discussed before, a relatively small amount of budget can lead to a significant reduction in the incurred agency and user cost for the network to reach its like-new state, thus solving these safety concerns. In light of this, the optimization code generally gives higher priority to bridges with a large difference between their bridge-level
and
This feature is demonstrated in where an increasing trend in the percentage of bridges identified to receive optimal MR&R actions with respect to the ratio of
to
can be found.
Figure 7. Percentage of bridges selected to receive the optimal work plan in various ranges of and ADT times detour length.
Conclusions
A budget allocation framework is proposed to optimally prioritize element-level maintenance, repair, and replacement (MR&R) actions for large bridge portfolios considering budget limits. The optimization problem is formulated as integer linear programming, which provides solutions to large-scale bridge management problems. The objective of this framework is to minimize agency and user costs to have bridges in the portfolio in their like-new state at the next budget allocation year. In the calculation of these costs, probability of structural non-functionality until the next budget allocation year are also accounted for, which enables the optimization framework to capture structural safety risks. The framework is compatible with the most recent element-level inspection practices by State DOTs, as well as component condition ratings and general bridge information.
The proposed method was tested on 484 National Highway Systems bridges in district 3 of Ohio on a budget of $15,000,000 considering the inspection data from 2017. The developed approach provided detailed workplans for each bridge in the inventory. According to the workplans, treating steel protective coating is the costliest MR&R action and consumes 35% of the total budget. MR&R actions for reinforced concrete abutments are required for 51 bridges (51%) out of the 100 bridges receiving MR&R action budgets. The approach also recommends replacement of four deck components, which accounts for approximately 10% of the MR&R budget. Replacing these decks will significantly reduce the structural safety risks of NHS bridges in district 3. The identified optimal workplans improve the network-level of the bridge portfolio from 0.706 to 0.731. Considering that the allocated budget is only 9% of the minimum required budget to bring all bridges to their acceptable condition, the results are deemed rational. Based on the results of the case study and a set of validation tests, it is shown that the developed method systematically assigns higher priority to work plans that reduce structural safety risks of bridges, and to bridges with high traffic demand and long detour length to enhance their serviceability performance.
In light of continuing budget limits, State DOTs and other agencies can benefit from the developed optimal budget allocation program to systematically identify most effective MR&R actions for their bridges such that the safety and serviceability, and in general, the performance of their bridge portfolios are maximized.
| Glossary of Notations and Abbreviations | ||
| Abbreviation | = | Definition |
| = | Total number of work plan combinations for bridge | |
| = | Action possibility of do nothing on elements of the deck component | |
| = | Action possibility of do nothing on elements of the substructure component | |
| = | Action possibility of do nothing on elements of the superstructure component | |
| = | Action possibility of “like-new repairs” on elements of the substructure component | |
| = | Action possibility of “like-new repairs” on elements of the superstructure component | |
| = | Action possibility of “like-new repairs” on elements of the deck component | |
| = | Action possibility of “critical repairs” on elements of the substructure component | |
| = | Action possibility of “critical repairs” on elements of the deck component | |
| = | Action possibility of “critical repairs” on elements of the superstructure component | |
| = | Agency cost of implementing repair actions on bridge elements that are not at their like-new state | |
| = | Agency cost of implementing repair actions on elements of bridge | |
| = | Agency cost to improve bridge | |
| = | Agency cost of implementing repair actions on bridge elements that do not meet the minimum condition-state thresholds | |
| = | Agency cost of replacing the system | |
| = | Agency cost of replacing bridge | |
| ADT | = | Average daily traffic |
| AEM | = | Administration, engineering, and mobilization |
| BHI | = | Bridge health index |
| BPI | = | Bridge preservation index |
| BSR | = | Bridge sustainability ratio |
| = | Maximum available budget at the current year for the considered bridge portfolio | |
| = | Required budget to improve all elements of the bridge to their minimum safe and serviceable state | |
| DOT | = | Department of Transportation |
| DR | = | Deficiency rating |
| DVE | = | Delay time, vehicle operations, and excess gas emission |
| FO | = | Functionally obsolete |
| GA | = | General appraisal |
| GCR | = | General condition rating |
| GR | = | Geometric rating |
| ILP | = | Integer Linear Programming |
| = | Total number of bridges in the network | |
| MOT | = | Maintenance of traffic |
| MR&R | = | Maintenance, repair, and replacement |
| NHS | = | National highway system |
| OBCI | = | Ohio bridge condition index |
| = | A version of OBCI that compares the agency and user costs of improving the current condition of the system elements to their like-new state relative to the replacement cost of the system | |
| = | A version of OBCI that compares the agency and user costs of improving elements of the system to its minimum acceptable conditions relative to the replacement cost of the system | |
| = | A version of OBCI that compares the agency and user costs of improving the current condition of the system elements to their like-new state, considering structural safety risks, relative to the replacement cost of the system | |
| = | Network-level | |
| = | Failure probability (i.e. probability of local or global failure) of bridge | |
| = | Probability of structural non-functionality of bridge | |
| SD | = | Structurally deficient |
| = | User cost of implementing repair actions on bridge elements that are not at their like-new state | |
| = | User cost of implementing repair actions on elements of bridge | |
| = | User cost to improve bridge | |
| = | User cost of implementing repair actions on bridge elements that do not meet the minimum condition-state thresholds | |
| = | User cost of replacing the system | |
| = | User cost of replacing bridge | |
| = | A binary decision variable taking the value of 0 or 1, indicating consideration or disregard of work plan j on bridge B at the current year | |
| VR | = | Vulnerability rating for scour criticality |
Supplemental Material
Download PDF (135.4 KB)Acknowledgements
This research is supported by the Ohio Department of Transportation through Grant 135240. This support is greatly appreciated. Any opinions, findings, and conclusions or recommendations expressed in this article are those of the authors and do not necessarily reflect the views of the sponsor. The authors would like to also thank Brad Noll, Jared Backs, Amjad Waheed, Mike Brokaw, Cynthia Jones, Shane Deer, and Tim Keller from the Ohio Department of Transportation for providing valuable practical insights and effective coordination of this research project, and Chi Zhang, Graduate PhD student at the Ohio State University for his notable feedback and revisions on this article. Additionally, authors are grateful for valuable evaluations of district 3 engineers, especially Marlin Wengerd, on the results of the proposed framework.
Disclosure statement
No potential conflict of interest was reported by the author(s).
Related Research Data
References
- American Society of Civil Engineers. (2017). 2017 Report Card for America’s Infrastructures. Reston, VA: American Society of Civil Engineers (ASCE). https://www.infrastructurereportcard.org/
- Adams, T. M., Kang, M., & Pincheira, J. A. (2009). Sensitivity analysis of bridge health index to element failure costs and conditions. (Project 08-07) Midwest Regional University Transportation Center. Madison: University of Wisconsin. https://rosap.ntl.bts.gov/view/dot/17500.
- American Association of State Highway and Transportation Officials (AASHTO). (2019). Manual for bridge element inspection. Washington, DC: AASHTO.
- American Association of State Highway and Transportation Officials (AASHTO) (2012). AASHTO LRFD Bridge Design Specifications. Washington, DC: AASHTO.
- American Association of State Highway and Transportation Officials (AASHTO). (2019). AASHTOWare Bridge Management (BrM 6.2). https://www.aashtowarebridge.com/.
- Bai, Q., Labi, S., Sinha, K. C., & Thompson, P. D. (2013). Multiobjective optimization for project selection in network-level bridge management incorporating decision-maker’s preference using the concept of Holism. Journal of Bridge Engineering, 18(9), 879–889. doi:https://doi.org/10.1061/(ASCE)BE.1943-5592.0000428
- Federal Highway Administration (FHWA) (1995). Recording and coding guide for the structure inventory and appraisal of the nation’s bridges. Rep. No. FHWA-PD-96-001. Washington DC: US Department of Transportation, Federal Highway Administration.
- Federal Highway Administration (FHWA) (2018). Bridge preservation guide: Maintaining a Resilient Infrastructure to Preserve Mobility. US Department of Transportation, Federal Highway Administration. https://www.fhwa.dot.gov/bridge/preservation/guide/guide.pdf(Spring. 2018).
- Fereshtehnejad, E., Hur, J., Shafieezadeh, A., & Brokaw, M. (2017b). Ohio bridge condition index: Multilevel cost-based performance index for bridge systems. Transportation Research Record: Journal of the Transportation Research Board, 2612(1), 152–160. doi:https://doi.org/10.3141/2612-17
- Fereshtehnejad, E., Hur, J., Shafieezadeh, A., Brokaw, M., Backs, J., Noll, B., & Waheed, A. (2018a). A bridge performance index with objective incorporation of safety risks. In Proceedings of the Transportation Research Board 97th Annual Meeting, January 7–11, 2018, Washington, DC, USA.
- Fereshtehnejad, E., Hur, J., Shafieezadeh, A., Brokaw, M., Noll, B., Backs, J., & Waheed, A. (2018b). Systematic procedures for the analysis of agency and user costs of bridge repair actions. In Proceedings of the Transportation Research Board 97th Annual Meeting, January 7–11, 2018, Washington, DC, USA.
- Fereshtehnejad, E., Hur, J., Shafieezadeh, A., & Brokaw, M. (2017a). A novel cost and condition based index for assessment of bridges. In Proceedings of 11th International Bridge & Structure Management Conference, April 25-27, 2017, Mesa, AZ, USA, https://na.eventscloud.com/ehome/bridge-structures/550233/.
- Fereshtehnejad, E., Zhang, C., Hur, J., & Shafieezadeh, A. (2018c). A bridge condition index for transportation asset management in Ohio. (No. FHWA/OH-2018-22). https://trid.trb.org/view/1592808.
- Jiang, X., & Rens, K. L. (2010a). Bridge health index for the city and county of Denver, Colorado. I: Current methodology. Journal of Performance of Constructed Facilities, 24(6), 580–587. doi:https://doi.org/10.1061/(ASCE)CF.1943-5509.0000128
- Jiang, X., & Rens, K. L. (2010b). Bridge health index for the city and county of Denver, Colorado. II: Denver bridge health index. Journal of Performance of Constructed Facilities, 24(6), 588–596. doi:https://doi.org/10.1061/(ASCE)CF.1943-5509.0000129
- Johnson, M. B., & Bruton, N. (2014). Incorporating Bridge Preservation Objectives into Asset Management Plans. Presented at the National Bridge Preservation Conference, Orlando.
- MathWorks, MATLAB (2019). Mixed-integer linear programming algorithms. Retrieved from https://www.mathworks.com/help/optim/ug/mixed-integer-linear-programming-algorithms.html#btv2z9y.
- Minnesota Department of Transportation. (2015). Minnesota bridges, Current statistics, Deficient structure summaries, Bridge replacement program.
- Nemhauser, G. L., & Wolsey, L. A. (1988). Integer and combinatorial optimization. Interscience series in discrete mathematics and optimization. John Wiley & Sons.
- New York State Department of Transportation. (1991). Bridge safety assurance, hydraulic vulnerability manual.
- Ohio Department of Transportation (2014). Manual of Bridge Inspection (No. ORC 5501.47).
- Patidar, V., Labi, S., Sinha, K., Thompson, P., Shirolé, A., & Hyman, W. (2007). Performance measures for enhanced bridge management. Transportation Research Record: Journal of the Transportation Research Board, 1991(1), 43–53. doi:https://doi.org/10.3141/1991-06
- Proctor, G. D., Varma, S., & Varnedoe, S. (2012). Asset sustainability index: A proposed measure for long-term performance. US Department of Transportation, Federal Highway Administration. https://rosap.ntl.bts.gov/view/dot/41085.
- Richardson, J., Turner, D., Hale, D. P., & Sharpe, S. (2009). Bridge health monitoring metrics: Updating the bridge deficiency algorithm. Alabama: University Transportation Center for Alabama.
- Shepard, R. W., & Johnson, M. B. (2001). California bridge health index: A diagnostic tool to maximize bridge longevity, investment. TR News, 215, 6–11.
- Sinha, K. C., Labi, S., McCullouch, B. G., Bhargava, A., & Bai, Q. (2009). Updating and enhancing the Indiana bridge management system (IBMS).
- Thompson, P., Sinha, K. C., Labi, S., & Patidar, V. (2008). Multiobjective optimization for bridge management systems. International Bridge and Structure Management, 195–209.
- Virginia Department of Transportation (2015). Fiscal Year 2015 VDOT Annual Budget. Final Report, July 2015. https://www.virginiadot.org/info/resources/bridgeReports/2015-07-FY2015-State_of_the_Structures_and_Bridge_Report-Generated_2015-10-09.pdf.
- Virginia Department of Transportation (2018). Fiscal Year 2018 VDOT Annual Budget. Final Report, June 2018. https://www.virginiadot.org/info/resources/2018-07-FY2018-State-of-the-Structures-and-Bridge-Report-Final.pdf.
- Virginia Department of Transportation (2019a). Fiscal Year 2020 VDOT Annual Budget. Final Report, June 2019. https://www.virginiadot.org/about/resources/budget/Final_VDOT_Budget,_6-18-2019.pdf.
- Virginia Department of Transportation (2019b). Fiscal Year 2019 VDOT Annual Budget. Final Report, June 2019. https://www.virginiadot.org/info/resources/bridgeReports/2019-07-FY2019-State-of-the-Structures-and-Bridges-Report-Final.pdf.
- Zemel, E. (1980). The linear multiple choice knapsack problem. Operations Research, 28(6), 1412–1423. doi:https://doi.org/10.1287/opre.28.6.1412