
 ?Mathematical formulae have been encoded as MathML and are displayed in this HTML version using MathJax in order to improve their display. Uncheck the box to turn MathJax off. This feature requires Javascript. Click on a formula to zoom.
Abstract
The edge beams of reinforced concrete bridges with de-icing salts sprayed experience extensive corrosion damage. The average service life of edge beams needing replacement in Sweden has been reported as only 45 years, causing great economic loss to both owners and users. Hence, finding a durable solution for edge beams would benefit society. Hybrid reinforced concrete structures, produced by adding a low-to-moderate fibre content into traditional reinforced concrete, can effectively limit the service crack width and improve resistance to chloride-induced corrosion damage. In this paper, different alternatives of hybrid and traditional reinforced edge beams were designed for a case study. The service life of the alternatives was compared by conducting chloride diffusion calculations and by applying a corrosion-induced cracking model. The economic and environmental (indicated by greenhouse gas emissions) benefits of using hybrid reinforced edge beams were assessed by life-cycle cost analysis and life-cycle assessment. The results showed that the service life of edge beams made of hybrid reinforced concrete can be prolonged by over 58%, thereby enabling a significant reduction in the total life-cycle costs and annual total greenhouse gas emissions.
1. Introduction
Civil infrastructures play a vital part in the social and economic development of a society and structures of greater importance should be designed to have a service life of over 100 years (International Federation for Structural Concrete, 2010). During their lifespan, structures may experience various types of deterioration due to environmental actions. In chloride environments, such as coastlines and regions where de-icing salt is sprayed on roads, the major deterioration mechanism of reinforced concrete (RC) structures is the corrosion of reinforcing steel, since chloride ions can destroy the passive film on the steel surface. The damage caused by reinforcement corrosion (cover cracking/spalling, bond degradation, and reduction in rebar cross-section) poses a major threat to the durability and safety of RC structures, thus shortening their service life.
Maintaining the function of existing structures under deterioration requires measures which include maintenance, repair and rehabilitation (MR&R). This gives rise to a great amount of MR&R costs during the structures’ service life. A comprehensive survey in 2002 (Koch, Brongers, Thompson, Virmani, & Payer, Citation2002), reported that the annual direct cost of corrosion on infrastructure in the United States was estimated at $22.6 billion. The user costs caused by traffic disruption during maintenance work may even take the major part of the total costs and be higher than the cost of MR&R (Thoft-Christensen, Citation2012). It is therefore of great importance to the whole society to consider the total costs of an infrastructure project. Life-cycle cost analysis (LCCA) is a technique which enables accounting the costs incurred ‘from cradle to grave’ and is becoming an important infrastructure management tool (Salokangas, Citation2013).
To improve the durability and extend the service life of infrastructure such as bridges, a variety of new materials and innovative structural solutions have been developed attempting to partially replace or compensate the traditional reinforced concrete (traditional RC) structures. LCCA has been applied in recent years to evaluate the economic performance of different design solutions or maintenance strategies (Safi, Sundquist, Karoumi, & Racutanu, Citation2013; Veganzones Muñoz, Pettersson, Sundquist, & Karoumi, Citation2016). In addition to the economic costs, environmental impact is another important factor of concern when evaluating alternative solutions; it is imperative nowadays to combat climate change and realise sustainable development (Niu & Fink, Citation2019; Penadés-Plà, Martí, García-Segura, & Yepes, Citation2017). Life-cycle assessment (LCA) is one such approach to quantifying the environmental impact of a project throughout its life cycle.
Bridge edge beams are structural elements known to suffer from extensive reinforcement corrosion damage due to the frequent use of de-icing salt. According to a previous survey of bridges in Sweden (Mattsson, Sundquist, & Silfwerbrand, Citation2007), the average age of 135 edge beams which needed replacement was only 45 years, with a standard deviation of 11 years. This is much shorter than the design life of most bridges. Another study (Racutanu, Citation2001) analysed the inspection reports on 353 bridges in Sweden. The edge beams were found to be the most damaged part of a bridge; 21% of damage was associated with edge beams. According to the Swedish Transport Administration, the cost arising from repair or replacement of a bridge’s edge beam system (mostly the edge beams and railing) may account for as much as 60% of the overall cost of the entire bridge during its lifespan, as stated in a recent study by Veganzones Muñoz et al. (Citation2016). To discover cost-effective solutions for edge beams, recent studies have proposed different alternative designs to the traditional RC edge beam, including concrete edge beams reinforced with stainless steel, or removal of edge beams from bridge structures (Veganzones Muñoz, Citation2016; Veganzones Muñoz et al., Citation2016).
Adding fibres to traditional RC edge beams to create hybrid reinforced concrete (hybrid RC) edge beams, is another possible solution to the traditional choice. Since fibre reinforced concrete (FRC) can achieve better crack control, it is a promising material for alleviating the detrimental effects of concrete cracks and thus achieving prolonged service life. Hybrid RC members can reduce crack width under mechanical loading and restraint forces (Al-Kamyani, Guadagnini, & Pilakoutas, Citation2019; Berrocal & Löfgren, Citation2018; Vandewalle, Citation2000). They also exhibit better durability in chloride environments than traditional RC members. It was shown (Berrocal, Löfgren, Lundgren, & Tang, Citation2015) that the corrosion initiation time in hybrid RC beams was delayed compared to traditional RC beams, even though the maximum width of surface cracks generated under bending was the same; the more tortuous internal crack morphology and reduced interface damage in hybrid RC beams was deemed beneficial in terms of resisting chloride penetration.
A recent investigation found the chloride diffusion coefficient to be reduced by 30-38% in steel fibre reinforced concrete beams compared to plain concrete ones, when the maximum bending stress in each specimen type was half the ultimate strength (Wang, Sun, Guo, Gu, & Zong, Citation2018). Other studies have also shown that adding fibres may significantly reduce corrosion-induced cover cracking, prevent cover spalling (Chen & Yang, Citation2019; Sadrinejad, Ranjbar, & Madandoust, Citation2018) and improve the residual post-peak bond capacity of corroded specimens (Berrocal, Fernandez, Lundgren, & Löfgren, Citation2017), as compared to reinforced mortar or concrete specimens without fibres. Moreover, the residual flexural capacity and ductility of corroded hybrid RC beams were higher than those of traditional RC beams after the same period of rebar corrosion (Berrocal, Löfgren, & Lundgren, Citation2018).
Although hybrid RC has better structural performance and improved cracking resistance compared to traditional RC, structure owners are still reluctant to use hybrid RC due to lack of long-term experience. Due to time constraints, most positive findings regarding rebar corrosion in FRC have been based on short-term laboratory investigations, including natural corrosion tests (Berrocal et al., Citation2015; Blunt, Jen, & Ostertag, Citation2015) and accelerated corrosion tests with impressed current (Chen & Yang, Citation2019; Sadrinejad et al., Citation2018). Moreover, the extra cost of fibres raises a concern that the investment costs of hybrid RC structures may be higher. On the other hand, hybrid RC members are expected to have a longer service life. The MR&R costs and user costs over the whole service life of the infrastructure may thus be reduced. However, the authors found very limited information in the literature regarding the comparison of life-cycle costs (LCC) for hybrid RC and traditional RC applications.
To quantify the benefits of using hybrid RC for structures in chloride environments, this study carried out service life prediction, LCCA and LCA for hybrid and traditional reinforced concrete. This involved a case study of a bridge edge beam, with multiple parameters chosen by carefully considering field data and experimental results from previous studies. The service life of hybrid RC and traditional RC edge beam were predicted via a chloride diffusion analysis and finite element modelling of the corrosion-induced cracking process. The predicted service life guided the replacement time for the edge beam. The other input parameters in the LCCA and LCA were selected by referring to the literature and available databases. Finally, the influence of several main parameters was examined in a sensitivity analysis.
2. Overview of the case study
2.1. Traditional RC edge beam
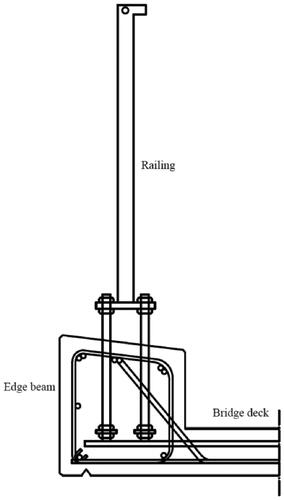
The edge beam is a structural member located at the sides of the bridge deck, see . Its main functions are to support the railing and prevent cars or bridge users from driving or falling off and to accommodate the drainage system. It may also provide stiffness to the bridge deck, helping to distribute concentrated loads. The most common type of edge beam used in Sweden is made of reinforced concrete and integrated into the bridge deck (Veganzones Muñoz et al., Citation2016). Pre-fabricated edge beams are also sometimes used. According to the design rules of the Swedish Transport Administration (Trafikverket, Citation2011), the edge beam must be designed with sufficient load-bearing capacity for the railing attachment and its cross-sectional dimension should be at least 400 × 400 mm. Moreover, it is specified (Trafikverket, Citation2011) that the edge beam should have a longitudinal reinforcement of at least 7Ø16 and a transverse reinforcement of at least Ø10 s 300 mm. depicts a cross-sectional sketch of the edge beam, with the top surface inclined towards the bridge deck.
Figure 1. A bridge edge beam in Sweden with cracks that have been injected and sealed.
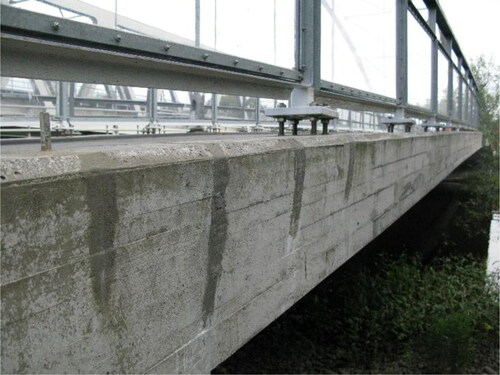
Figure 2. A simple sketch of the cross-section of the edge beam.
The exposure condition of road bridges with de-icing salt sprayed in winter corresponds to class XD3 in the standard BS EN 206:2013 (British Standards Institution, Citation2013). The allowable crack width for class XD3 should be limited to 0.3 mm (European Committee for Standardization, Citation2004). According to Swedish national requirements (Boverket, Citation2019), the allowable crack width in XD3 is even stricter: 0.15 mm for a design life of 100 years, and 0.20 mm for a design life of 50 years. One of the main causes of cracking in edge beams is shrinkage, see the restraint-induced cracks in . Restraint forces arise when edge beams are cast after the bridge deck in a new bridge, or when new edge beams are substituted for the demolished ones. Pre-existing cracks can accelerate the ingress of undesirable substances (such as chloride ions, moisture and oxygen), causing early corrosion in the cracked region. Alongside chloride-induced steel corrosion, frost attack and carbonation are the other two major deterioration mechanisms in edge beams (Mattsson et al., Citation2007). Nevertheless, only chloride-induced corrosion was considered in this study as this is the main cause of degradation.
2.2. Methodology of the case study
The steps of the case study are outlined in . First, the alternative designs of hybrid RC and traditional RC edge beams were performed. The flexural moment capacity and restraint-induced crack width governed the quantity of steel rebars and fibres. A basic design of the traditional RC edge beam was chosen to satisfy the minimum requirements given in the regulations (Trafikverket, Citation2011). The flexural moment capacity of other alternative designs was checked to ensure it was adequate relative to the basic design. However, a detailed design for the necessary moment capacity to resist impact loading on the railing was beyond the scope of this study.
Figure 3. Steps in the case study.
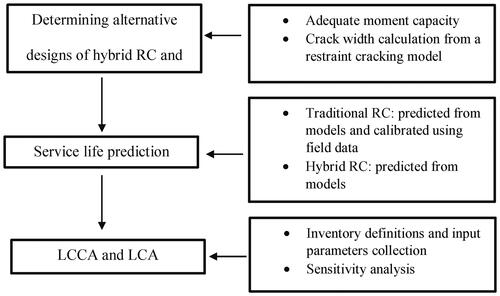
The second step involved predicting the service life of each design, which is a critical input parameter for LCCA and LCA. Although many service life models for RC structures deteriorated by steel corrosion have been proposed in research studies from the literature (cf. François, Laurens, & Deby, Citation2018; Weyers, Citation1998), they are still far from direct practical applicability due to the complex environmental conditions and load actions, probabilistic nature of material properties and so on. Rather, service life data grounded in experience has often been used in LCCA (Salokangas, Citation2013). As for the service life of hybrid RC structures, to the authors’ knowledge, no such field data is currently available. Therefore, a service life model for the edge beam was established in this study. Moreover, the input parameters used in the service life model were calibrated by comparing predicted service life of the traditional RC edge beam with field data.
There then followed a comparative LCCA and LCA of the hybrid RC and traditional RC edge beam. The inventory of LCCA and LCA was defined and only items relating to the edge beam were considered. The necessary information and input parameters were collected from the literature and databases. A sensitivity analysis was conducted as some parameters might display a large scatter in values.
3. Alternative designs in the case study
The edge beam considered in the case study had a length of 15 m and a cross-section of 450 × 450 mm. C40 grade concrete defined in Model Code 2010 (International Federation for Structural Concrete, 2010) was used. The parameters defining the concrete properties were calculated from the code. The total shrinkage strain was set as 600 µε and the restraint degree assumed to be 0.4. The characteristic yield strength of the steel was 500 MPa. The material parameters required in the restraint crack model are given in . The same concrete grade and same mechanical parameters of steel were used in the traditional and hybrid RC designs. The additional parameter in the hybrid RC designs, residual tensile strength of FRC, ft,res (which is dependent on the fibre content, fibre type and geometry), will be chosen in Section 3.2.
Table 1. Material parameters of concrete and reinforcing steel in the restraint crack calculation.
3.1. Analytical modelling of restraint-induced cracking
In the design codes, the width of cracks caused by external loading is usually controlled by designing a minimum reinforcement and limiting the stress in the reinforcement steel. In restrained concrete members subjected to shrinkage or thermal contraction, the calculation of crack width cannot be conducted in the same manner since the restraint force, which depends on the stiffness of the member, is not known a priori. An iterative procedure is needed to determine the number of cracks and their width.
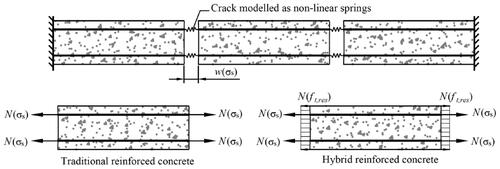
Engström (Citation2007) developed a model to calculate restraint crack width by taking into account the bond-slip behaviour between the reinforcement bar and the concrete. In the model, cracks are modelled as non-linear springs, as illustrated in . At a cracked section in the traditional RC element, all the force is carried by the reinforcement, whereas the concrete is assumed to be stress-free. The model was extended by Löfgren (Citation2007) to include the effect of fibre reinforcement by introducing the residual tensile strength of FRC, as shown in . Berrocal and Löfgren (Citation2018) further modified the model. In their work, the bond-slip relationship given in CEB 228 (Comite Euro-internacional du beton, Citation1995) was replaced by the one suggested in Model Code 2010 (International Federation for Structural Concrete, 2010) and a linear relationship of the debonding length adjacent to the crack due to radial cracking and the steel stress was considered. The equations to calculate the restraint-induced crack width are given in the Supplementary Material 1.
Figure 4. Restraint cracking model of hybrid RC element (after Löfgren, Citation2007); w(σs) is the restraint crack width which is related to the steel stress σs; N(σs) and N(ft,res) is the force carried by the reinforcement bars and FRC respectively.
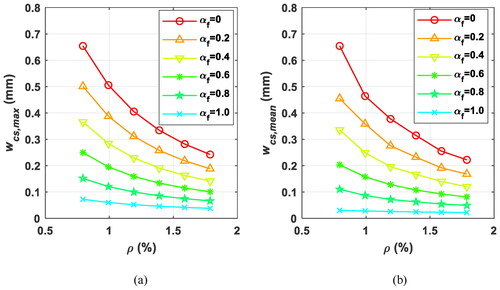
To design the quantity of steel rebars and fibres, the influence of residual tensile strength of FRC (expressed as a fraction of the tensile strength, i.e., αf fctm) and the reinforcement ratio ρ on the predicted maximum and mean crack width (wcs, max and wcs, mean) was first examined for the edge beam with rebar diameter of 16 mm. From the results shown in , the crack width is reduced with increasing reinforcement ratio and increasing residual tensile strength. In addition, the decreasing rate of crack width becomes slower as the quantity of rebar increases. To achieve a similar crack width in the hybrid RC edge beam, the required reinforcement ratio decreases as the residual tensile strength increases.
Figure 5. Influence of reinforcement ratio ρ and residual tensile strength (αf fctm) of FRC on the (a) maximum restraint crack width wcs, max and (b) mean restraint crack width wcs, mean (for the 16 mm diameter rebar, the markers in each curve correspond to the number of rebar, namely 8, 10, 12, 14, 16 and 18 from the leftmost point to the rightmost one).
3.2. Reinforcement design
Six reinforcement designs using the same concrete grade C40 were chosen for the case study: two for the traditional RC edge beams (PL1 and PL2, where ‘PL’ denotes ‘plain concrete’) and four for the hybrid RC edge beams (FRC1, FRC2, FRC3 and FRC4), as listed in . All the designs had the same geometry and same stirrup arrangement (Ø10 s 300 mm). In all designs, the clear cover thickness was 45 mm. The basic design, PL1, was reinforced with 10Ø16 longitudinal steel rebars. In PL2, 16Ø16 longitudinal rebars were used to bring the shrinkage crack width below 0.3 mm. Since the reinforcement layout may influence the corrosion-induced crack pattern and crack width under the same amount of reinforcement, two different reinforcement layouts were considered for PL2: bundled rebars at the corners and middle height (PL2-I) and uniformly distributed bars in the top and bottom layers (PL2-II).
Table 2. Alternative designs in the case study
Steel fibres were used in the design of hybrid RC edge beams. Two volume fractions of fibres were considered: 0.5% vol. fibres for FRC1 and FRC2 and 1.0% vol. fibres for FRC3 and FRC4. The material parameters of the FRC were determined according to previous studies (Berrocal et al., Citation2018; Jepsen, Damkilde, Lövgren, & Berrocal, Citation2018; Löfgren, Stang, & Olesen, Citation2005) which investigated the mechanical properties of FRC with 0.5% vol. and 1.0% vol. Dramix© (65/35) steel fibres and a water/cement ratio of 0.47 (comparable to C40 grade concrete). The two experimental studies (Berrocal et al., Citation2018; Löfgren et al., Citation2005) reported the load-crack mouth opening displacement (CMOD) curves of the FRC obtained from the three-point bending test on notched beams. The tensile stress-crack opening relationship of the FRC was derived inversely (Jepsen et al., Citation2018) by analysing the flexural load-CMOD results. It was shown (Berrocal et al., Citation2018) that the tensile strength of FRC with 0.5% vol. steel fibres was similar to that of plain concrete with a similar mix composition, while the tensile strength of FRC with 1.0% vol. steel fibres was slightly greater than that of FRC with 0.5% vol. steel fibres (Jepsen et al., Citation2018).
Accordingly, in the case study, the tensile strength of FRC with 0.5% and 1.0% vol. steel fibres was taken as 3.5 and 3.6 MPa respectively, see . It should be noted that the corrosion resistance of steel fibres has been found to be superior to that of traditional steel bars. Although low-carbon steel fibres located near the surface or bridging cracks may be readily corroded, embedded fibres have proven to remain free of corrosion despite high chloride contents (Raupach, Dauberschmidt, & Eichler, Citation2004). Therefore, any potential degradation of the mechanical properties of steel fibre reinforced concrete due to fibre corrosion was not considered in this study.
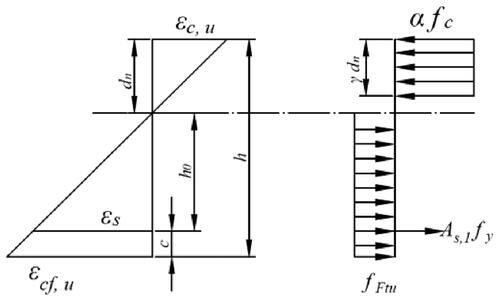
Due to the contribution of fibres, the number or diameter of longitudinal rebars may be reduced. In FRC1, the rebars were the same as in PL1, while FRC2 and FRC3 had the same diameter but a reduced number of rebars. In FRC4, a smaller rebar diameter, Ø12, was used but the number of bars was the same as that of PL1. First, the load capacity at the ultimate limit state was checked. Only one-way flexural capacity was calculated as it is the most important indicator of structural performance. shows the stress block in the section analysis, in which the rigid-plastic model for residual tensile stress distribution in Model Code 2010 (International Federation for Structural Concrete, 2010) was adopted. The moment capacity was calculated using the following equation:
(1)
(1)
where α = 1 and γ = 0.8, according to Model Code 2010 (International Federation for Structural Concrete, 2010), c is the distance from the outer surface to the centroid of the rebars, b and h are the width and height of the section and dn is the height of neutral axis (determined from the force equilibrium on the section). fFtu is determined as fR3/3, where fR3 is the residual flexural tensile strength, corresponding to a CMOD of 2.5 mm. fFtu was taken as 1.5 and 2.4 MPa for FRC with 0.5% and 1.0% vol. steel fibres (according to the experimental results in Löfgren et al., Citation2005 and Berrocal et al., Citation2018). The total steel area As, steel area in one side (top or bottom) As,1 and moment capacity Mu in each design are presented in .
Figure 6. Stress block in hybrid RC cross section.
The residual tensile stress of FRC in the service limit range, ft,res, was used to determine the maximum and mean restraint crack width. The residual tensile strength at the crack width ≤ 0.5 mm was almost a constant value of 2.0 and 3.0 MPa for FRC, with 0.5% and 1.0% vol. steel fibres respectively (Jepsen et al., Citation2018). The restraint crack width was calculated using these parameters (given in ). It can be seen that using an increased number of steel rebars in traditional RC (PL2) or using FRC can reduce the restraint-induced crack width, although the crack width in all four hybrid RC choices is smaller than in PL2. The maximum restraint crack width in all the designs, except FRC3 and FRC4, exceeds the allowable crack width mentioned in Section 2.1. It should be noted that restraint-induced cracking is usually not well considered in current structural design; it is not uncommon to have crack widths exceeding the allowable limit on site. In addition, larger cracks are often injected or sealed to satisfy regulatory requirements, as can be seen from .
4. Service life prediction
4.1. Assumptions in the service life model
The service life of RC deteriorated by reinforcement corrosion consists of the corrosion initiation phase and corrosion propagation phase. One of the main difficulties of service life prediction is understanding the role that concrete cracks play in the corrosion process. Unfortunately, no consensus on the long-term impact of cracks has yet been reached among researchers, although it has been investigated and discussed extensively.
It is generally agreed that transverse cracks generated before corrosion initiation can accelerate the ingress of chlorides, inducing early pitting corrosion in the rebar (Schießl & Raupach, Citation1997). However, structures subjected to decades of corrosion usually exhibit a mixed morphology of general and pitting corrosion. This may be because the chloride content in the region that is free of transverse cracks also reaches a threshold value to initiate corrosion, or because the earlier-corroded region near the transverse cracks spreads the corroded sites along the rebar length with the propagation of longitudinal corrosion-induced cracks, as discussed in a recent study by the authors (E. Chen, Berrocal, Löfgren, & Lundgren, Citation2020). It is a challenging task to model the evolution of the corrosion morphology and interactions between the cracks (transverse and longitudinal) and the corrosion process. To obtain a preliminary estimate, the corrosion initiation time was calculated in the respective cracked and uncracked regions of the edge beam and the time difference was further examined to estimate the level of pitting corrosion.
The corrosion propagation phase is the time from corrosion initiation to a ‘critical state’ when the damage to the structure is unacceptable. From a technical perspective, this critical state depends on the corrosion morphology and application of the RC member. Under uniform corrosion, since the major consequence of the reinforcement corrosion is concrete cover cracking and spalling, corrosion-induced cracking and bond loss is more likely to lead to failure of the member. Under pitting corrosion, the rebars’ mechanical properties, including load resistance and ductility, are more adversely affected than cover cracking and bond degradation.
Previous investigations on real decommissioned edge beams taken from two bridges in Sweden (Robuschi, Sumearll, Fernandez, & Lundgren, Citation2020; Tahershamsi, Fernandez, Lundgren, & Zandi, Citation2017) have reported extensive cover cracking and spalling due to corrosion. Based on this, the corrosion propagation time in the present study was mainly predicted using a corrosion-induced cracking model. Moreover, the cross-sectional area loss percentage was also examined, to check the residual moment capacity. The critical corrosion-induced crack width has been suggested as 0.3 mm for the service limit state (Andrade, Alonso, & Molina, Citation1993). The critical crack width proposed in DuraCrete (Citation2000) is 1 mm for the delamination risk induced by corrosion; however, greater values (2 mm or 3 mm) have been given in other studies (François et al., Citation2018). In this study, the critical corrosion-induced crack width implying the end of service life was determined by combining the predicted results and average service life of real edge beams.
4.2. Predicting corrosion initiation from chloride diffusion
4.2.1. Input parameters for chloride diffusion in uncracked concrete
In uncracked concrete, the chloride diffusion is usually modelled by a one-dimensional diffusion process. The solution of the chloride concentration along the distance x (to the surface) at time t from Fick’s second law is given as:
(2)
(2)
where Cs is the surface chloride content, D0 is the chloride diffusivity of uncracked concrete and erfc is the complementary error function.
A constant surface chloride content was assumed to be 1% by weight of cement (that is, 1.0 wt.-%/cement) based on the average chloride content found in field specimens exposed to a highway in Sweden sprayed with de-icing salts (Tang & Utgenannt, Citation2007). The critical chloride content Ccrit initiating corrosion was assumed to be 0.6 wt.-%/cement, which is a mean value proposed in the code (International Federation for Structural Concrete, Citation2006). According to the experimental results obtained by Berrocal (Citation2017), the addition of steel fibres has a marginal effect on the chloride diffusivity of uncracked concrete. In that study, the chloride diffusion coefficients of PL and FRC with steel fibres with similar mix proportion (with water/cement ratio of 0.47) at age 420 days were 8 × 10⁻¹² and 7.7 × 10⁻¹² m2/s respectively. Consequently, in this case study, D0 was taken as 8 × 10⁻¹² m2/s for both PL and FRC.
4.2.2. Chloride diffusion in cracked concrete
The corrosion initiation time in the cracked regions was predicted using a semi-empirical model proposed by Leung and Hou (Citation2015), see the equations in the Supplementary Material 2. This model is particularly convenient to use as only the chloride diffusivity D0 in EquationEquation (2)(2)
(2) needs to be replaced by an equivalent chloride diffusivity Deq of cracked concrete. Deq is related to D0, the chloride diffusivity in the crack Dcr and the crack width.
To determine Dcr for PL and FRC used in this case study, the experimental results reported previously (Berrocal, Citation2017; Berrocal et al., Citation2015) were examined and used in the semi-empirical model. In Berrocal et al. (Citation2015), the corrosion initiation time tini was measured for rebars in uncracked and pre-cracked traditional and hybrid RC beams cyclically exposed to chloride solution with a chloride concentration of 0.75 wt.-%/concrete (that is, 4.8 wt.-%/cement) (Berrocal, Citation2017). The pre-existing cracks were produced using three-point bending; the maximum crack width reached before unloading (noted as wpre) was set at 0.1, 0.2, 0.3 and 0.4 mm. The surface crack width after unloading in all pre-cracked beams ranged between 0.02 and 0.06 mm. Moreover, the chloride diffusivity of uncracked concrete D0 was also measured (Berrocal, Citation2017).
Note that Dcr was assumed to be constant for the different crack widths in the tested range. The value of Dcr was found by inverse analysis, to match the predicted tini with the experimental results. When Dcr was 45 × 10−10 and 30 × 10−10 m2/s for PL and FRC respectively, the predicted results compared well with the experimental results, except for tini at 0.1 mm crack width, as presented in . The predicted tini at 0.1 mm is higher than the experimental value. This may be because the smaller crack width is difficult to measure accurately in the experiments and tini is very sensitive to crack widths between 0.1 and 0.2 mm. The order of magnitude of Dcr was consistent with the results in Djerbi, Bonnet, Khelidj, and Baroghel-Bouny (Citation2008), although the values reported in that study were several times smaller. Moreover, Dcr in FRC was one third smaller than that in PL. This relationship is close to the results reported in Wang et al. (Citation2018). The obtained Dcr was adopted in the case study to calculate the corrosion initiation time in the cracked region. The input parameters used in the chloride diffusion analysis are summarised in .
Figure 7. Corrosion initiation time versus pre-existing crack width from the model and experiments of Berrocal et al. (Citation2015).
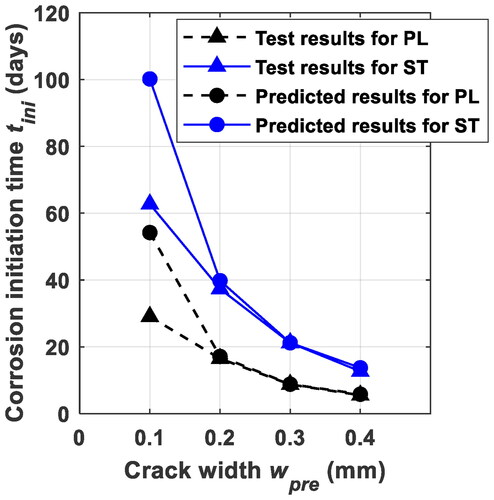
Table 3. Input parameters used in the chloride diffusion analysis.
4.3. Finite element modelling of corrosion-induced cracking
4.3.1. Corrosion model
The corrosion-induced cracking propagation was modelled with the finite element (FE) software DIANA10.3. Uniform corrosion was assumed, so a two-dimensional plane-strain model was set up. The corrosion effect was modelled using a corrosion model developed by Lundgren (Citation2005). In this model, corrosion expansion is simulated by applying swelling of the 2 D zero-thickness interface layer between concrete and steel. The constitutive law of the corrosion products is described by a power law (σn=Kcorr·εcorrp) to simulate the granular nature of corrosion products. For further details of the formulation, the reader is referred to the original work (Lundgren, Citation2005). The model is implemented by applying the corrosion penetration depth xu incrementally in time steps. With the volumetric ratio of corrosion products nv given, the free radial displacement of the interface ufree is calculated by:
(3)
(3)
where r is the initial radius of the rebar and the other parameters are defined in .
Figure 8. Physical interpretation of the variables in the corrosion model under uniform corrosion (after Lundgren, Citation2005).
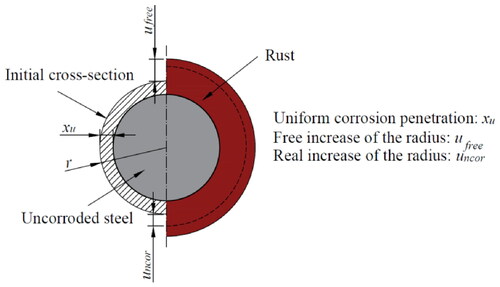
Due to the constraint of concrete cover, the real displacement of the interface uncor is smaller than the free increase. This results in a compressive state in the rust and generates compressive radial stresses and tensile hoop stresses in the concrete. Through the equilibrium and compatibility conditions in concrete elements, interface elements and steel elements, the stress and strain variables in concrete can be solved with the help of numerical schemes.
4.3.2. Description of the FE model
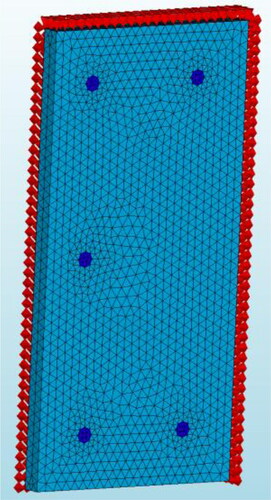
A thin slice of half the edge beam cross-section (with 20 mm thickness) was modelled, to reduce the number of elements and computational time. The displacement of the rear surface of the slice was constrained in the normal direction, to take the effect of surrounding concrete into account. A symmetrical boundary condition was applied at the mid-line of the cross-section. The top of the section was vertically constrained to avoid rigid body movement. In this modelling, only the rebars in the bottom layer were assumed to have corroded. This was to reduce the cracking elements and thereby computational time. Due to the large distance between the bars at the top and bottom, the corrosion in the top layer would have little influence on the internal stress distribution at the bottom region and vice versa. The element type for concrete and reinforcement bars was 3 D tetrahedral (TE12L). The steel-concrete interface was modelled using a 2 D interface element (T18IF). The meshes and boundary conditions of the case PL1 are shown in .
Figure 9. Finite element mesh and boundary conditions for the corrosion-induced cracking analysis of a thin slice.
The constitutive law of concrete was described by the compressive and tensile stress-strain curves including the softening branch. In addition to the strength and elastic modulus given in , the compressive behaviour of both PL and FRC was modelled using the curve suggested by Thorenfeldt (Citation1987). The tensile softening of PL was modelled using the softening law proposed by Hordijk (Citation1991) and the fracture energy of PL was calculated as 148 N/m, according to Model Code 2010 (International Federation for Structural Concrete, 2010). For the tensile behaviour of FRC, the multilinear curve obtained through an inverse analysis of the flexural test results (by Jepsen et al., Citation2018) was used. Concrete cracking was simulated using the total strain rotating crack model. The crack band width was set as the cube root of the element volume (as proposed by Rots, Citation1988). The parameters of rust suggested by Lundgren (Citation2005) were used: Kcorr = 14 GPa, p = 7 and the volumetric ratio nv = 2. The applied corrosion penetration depth was 2 µm at each time step. A Newton-Raphson iterative scheme was used in the FE analysis to solve the equilibrium equations.
5. Life-cycle cost analysis
5.1. Definitions of inventory
LCCA considers all relevant costs over a period of analysis and is expressed as a monetary value. The LCC of an infrastructure project is usually divided into three parts: agency costs, user costs and society costs (Salokangas, Citation2013). Agency costs are also called owner costs and include the costs of the planning and design, construction, maintenance and operation, and disposal phases. Costs arising from traffic delay and vehicle operations during the maintenance period are user costs. Society costs are associated with environmental impacts and accident costs.
This study considered the investment costs due to construction (noted as ‘INV’), maintenance costs due to the edge beam replacement (noted as ‘REP’) and user costs caused by the replacement work (noted as ‘USE’). Other items were excluded for various reasons. Some of them do not cause any obvious differences between different alternatives, such as the planning and design costs and accident costs. Some may account for a minor proportion of the total costs, such as regular inspection and minor repair costs compared to replacement costs. Disposal costs were not considered since they are related to the reuse or recycle strategies, which are uncertain.
LCC is represented by the sum of the three parts considered in this study, see EquationEquation (4)(4)
(4) . The calculation equations for each part are presented in the Supplementary Material 3.
(4)
(4)
5.2. Input parameters in the case study
In the case study, different alternatives for the edge beam were designed for the same road bridge. The design service life of the bridge may influence the replacement interval of the edge beam. Two different lifespans T, of 80 and 120 years, were considered. Since the bridge length Lbridge influences the affected roadway length during the road work and thereby the user costs, a short bridge of 15 m and a long bridge of 150 m were both considered. The road type was assumed to be two-way single-lane, with lane width 3.5 m and shoulder width 2.0 m in each direction. The corresponding traffic speed for this road type was assumed based on the data given in (Veganzones Muñoz et al., Citation2016). The region of the bridge was not specified, but the average daily traffic ADT was assigned in the range of 5000-20000 vehicles/day for the sensitivity analysis.
The unit cost of steel fibres mf on the market is normally in the range 15-25 SEK/kg (SEK = Swedish krona). Marginal additional costs may arise if the workability of the concrete is affected by adding fibres, but generally no additional labour cost for casting fibres is required. If zinc-coated or stainless-steel fibres were to be used to eliminate surface corrosion spots for aesthetic reasons, the price would be higher. A fibre cost ranging from 10 to 60 SEK/kg was therefore used in the sensitivity analysis.
The discount rate p is an important factor in LCCA where future costs are involved. A higher discount rate implies a lower present value of future costs. The currently recommended discount rate in Sweden is from 3.5% to 4%, although the actual future discount rate is uncertain. Thus, a greater range of discount rates from 2% to 7% was chosen in the sensitivity analysis. All the input parameters in LCCA are given in the Supplementary Material 3. The unit cost of the edge beam replacement provided in the literature was regarded as the cost of the basic design (PL1). The unit replacement cost for other alternatives was adjusted by scaling the replacement cost of the basic design, based on the ratio of their investment cost.
6. Life-cycle assessment
6.1. Definitions in LCA
The environmental impacts evaluated in the life-cycle assessment are categorised into classes according to the type of environment issues. The indicators related to potential environmental impacts from construction (EPD, Citation2019) include: global warming potential (GWP), acidification potential (AP), eutrophication potential (EP), formation potential of tropospheric ozone (POCP), abiotic depletion potential and water scarcity potential. They should be incorporated into the environmental product declarations (EPD) of a product.
A complete LCA of construction works should involve four stages of the life cycle (British Standards Institution, Citation2012): (1) material production stage (labelled A1-A3) including raw material extraction, transport of raw materials and manufacturing; (2) construction process stage (A4-A5) including transportation of the materials and equipment to the construction site, installation and construction work; (3) user stage (B1-B7) including maintenance, repair, replacement (MR&R) and operational energy and water use; and (4) end-of-life stage (C1-C4) including demolition, waste processing and associated transport and disposal. The reuse and recycling of materials beyond the life cycle may also be a part of LCA.
The environmental impacts during the construction process stage A4-A5 for the traditional and hybrid reinforced structures may be regarded as similar, so they were not considered in this comparative study. The environmental impacts caused by the edge beam replacement during the bridge’s lifespan may be different; however, the EPD of the materials produced in the future decades are uncertain. Since the European Union aims to attain zero emissions by 2040/2050, both the steel and cement industries are looking at carbon capture and utilisation (CCU) and carbon capture and storage (CCS) strategies to reach the goal. If carbon neutrality is realised in the future, the EPD data of materials reported nowadays will not hold then. Therefore, the LCA analysis of the replaced edge beams was limited to a cradle to gate approach. Moreover, concrete absorbs CO2 through carbonation in both its service life and recycling stage (Stripple, Ljungkrantz, Gustafsson, & Andersson, Citation2018). However, taking this into account is not straightforward. Due to these limitations, only the greenhouse gas emissions responsible for the GWP during the material production stage (A1-A3) of the edge beam at the bridge construction stage were considered.
6.2. EPD of the materials
The greenhouse gas emissions of a product are reported in kg CO2 equivalents in the EPD. The EPD of concrete from Svensk Betong and steel fibres from Mapei were collected from EPD-Norge Program (EPD-Norge, Citation2017a, EPD-Norge, Citation2017b). For steel rebars, it was found that the average GWP value provided by different producers may have several times variance; therefore, three producers (Arcelormittal, n.d.; Celsa, n.d.; UK CARES, n.d.) reporting distinct values were all considered. lists the GWP arising from raw materials extraction, transport and manufacturing (A1-A3) used in this study.
Table 4. EPD (A1-A3) of the materials from different producers.
7. Results and discussion
7.1. Results on the service life prediction
7.1.1. Corrosion initiation time
gives the corrosion initiation time in cracked and uncracked regions for each design. The corrosion initiation time in the uncracked region ti,u was the same in all designs, while the corrosion initiation time in the cracked region ti,cr is longer at smaller crack width. The time difference between ti,u and ti,cr is reduced as the restraint crack width is decreased. The possible consequence of this reduced time difference may be a reduction in localised pitting corrosion before corrosion morphology becomes generalised.
Table 5. Corrosion initiation time in cracked and uncracked region.
Since pitting corrosion causes much less cover cracking (including crack width and crack length) than uniform corrosion, it was assumed that the corrosion initiation for uncracked concrete occurs before any cover cracking due to pitting corrosion. Considering this, in the service life model of the present study, the corrosion initiation time was taken as the time for the uncracked region ti,u, after which the corrosion propagation period mainly exhibiting generalised corrosion started. It should be noted that this assumption may overestimate the service life. Furthermore, this overestimation is greater for PL1 and PL2 than the FRC groups as the time difference of ti,u and ti,cr is greater in PL1 and PL2.
7.1.2. Corrosion propagation time
The FE modelling simulated the crack propagation with increasing corrosion depth. The contour plots of the maximum principal crack width at different corrosion depths are shown in . Note that greater corrosion depths were selected for the FRC cases since cracking appears later and propagates more slowly in the FRC. As observed, crack localisation took place along a single row of elements, so the crack band width chosen for the model was appropriate.
Figure 10. Corrosion-induced crack patterns at different corrosion penetration depths. (a) PL1 at xu = 100, 150, 200, 250 µm; (b) PL2-I at xu = 100, 150, 200, 250 µm; (c) PL2-II at xu = 100, 150, 200, 250 µm; (d) FRC1 at xu = 150, 250, 350, 450 µm; (e) FRC2 at xu = 150, 250, 350, 450 µm; (f) FRC3 at xu = 150, 250, 350, 450 µm; (g) FRC4 at xu = 150, 250, 350, 450 µm.
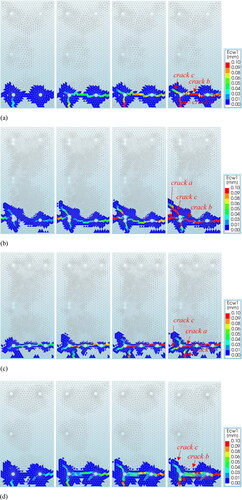
From , the difference in the final crack pattern for different reinforcement layouts can also be observed. Initially, the first localised crack or ‘main crack’ (marked as ‘crack a’) propagated to the nearest surface in all cases except PL2-II; in PL2-II, the main crack was formed between the rebars due to the smaller rebar spacing. In PL1, PL2-I, FRC1 and FRC4, with increasing corrosion depth, a second crack (marked as ‘crack b’) developed in the horizontal direction and connected with the horizontal crack caused by corrosion in the neighbouring rebar. The third crack (marked as ‘crack c’) was subsequently formed in an inclined direction. Once it reaches the outer surface, cover spalling in the corner will occur. The connected horizontal cracks may also cause delamination of the cover. The predicted crack patterns are close to those observed on-site. No horizontal delamination was formed in FRC2 and FRC3, as rebar spacing in them is greater than in PL1, PL2 and FRC1. Rather, the second crack tended to develop inclinedly towards to the edge. In FRC4, where smaller rebar diameter (Ø12) was used, the cracking level was the lowest.
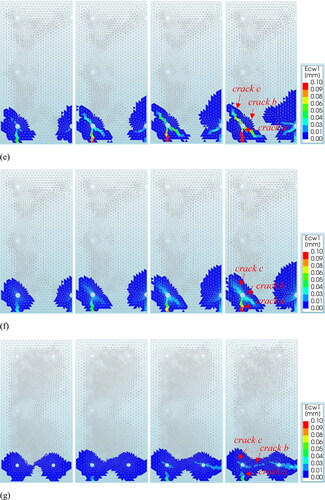
The crack width of the main crack (‘crack a’) versus the uniform corrosion depth (wcorr - xu relation) is plotted in . The crack width wcorr = 0.05 mm, which at close proximity is visible to the naked eye, was defined as the surface crack initiation. It can be seen that surface crack initiation is delayed in all the FRC cases. Moreover, the crack starting from the steel-concrete interface propagated to the surface in a sudden way in PL, whereas the progress was more gradual in FRC. It took the greatest corrosion depth for the visible crack to propagate to the surface in FRC4. After the surface crack initiation, the crack width increases almost linearly with the corrosion depth in PL1 and PL2, but slightly nonlinearly in the FRC. For the sake of comparison, a linear fitting was conducted to describe the wcorr - xu relationship in all cases. In those cases where results might not be accurately obtained due to convergence problems in the FE analysis, the crack width was calculated from this linear relationship. It is noteworthy that the predicted crack width from the linear fitting for the FRC would be slightly conservative.
Figure 11. Corrosion-induced crack width versus corrosion penetration depth from FE analysis and simplified linear fitting.
From , the slope of the wcorr - xu relationship is smaller in FRC than in PL. With the same fibre volume fraction but different reinforcement layouts, FRC2 (with 8Ø16) induces a larger surface crack width than FRC1 (with 10Ø16) since the second crack developing horizontally in FRC1 (due to smaller steel spacing) slowed the widening of the main crack. From all the FRC cases, FRC4 reduced the corrosion crack width the most. For the PL cases, the corrosion crack width in both PL2-I and PL2-II is larger than that in PL1 at the same corrosion depth. This can be explained by the fact that in PL2-I, a bundle of two rebars was used, thus exhibiting a similar effect to that of increasing the rebar diameter on the corrosion crack width, and that in PL-II, the decreased rebar spacing aggravated the horizontal crack propagation. As a result, although increasing the number of rebars can reduce the mechanically and restraint-induced crack width, it causes earlier corrosion cracking and increases the crack width of the main corrosion crack regardless of whether the rebars are bundled or placed at smaller spacing.
7.1.3. Service life comparison
For the corrosion propagation time, the corrosion rate is an important parameter for converting the corrosion depth in the model to time. A constant corrosion rate of 10 µm/year was assumed in all cases. This corresponds to a corrosion rate in the ‘high corrosion’ state as measured for beams exposed to de-icing salts on a highway (Tang & Utgenannt, Citation2007), or a ‘moderate corrosion rate’ according to Bertolini, Elsener, Pedeferri, Redaelli, and Polder (Citation2013). Taking the critical crack width as 0.5 mm, the critical corrosion depth xw0.5,u and corrosion propagation time tw0.5,u were determined. The results are presented in . For the basic design PL1, the time to reach critical crack width, tw0.5,u, was 35.5 years, and the service life, Teb, was about 50 years, after adding the corrosion initiation time ti,u (14.3 years). The predicted service life is very close to the average service life of the edge beam in practice (that is, 45 years). Therefore, the critical crack width of 0.5 mm was regarded as a reasonable criterion in the present model, for those cases in which corrosion-induced cracking dominates the decommission of the edge beam.
Table 6. Corrosion-induced crack width under uniform corrosion, and check of the residual moment capacity.
For FRC4, it was found that the required corrosion penetration depth to induce a 0.5 mm crack width was excessively large, namely xu/r > 0.29 (where r = 6 mm). This resulted in a very high percentage of cross-sectional area loss ΔAs (49.8%). This may cause the residual capacity of FRC4 to fail to satisfy the safety requirement well before reaching the critical crack width. Accordingly, the residual capacity criterion was also examined, to calculate the limit of cross-sectional area loss ΔAs for the safety consideration. To the authors’ knowledge, there is not a consensus regarding the admissible capacity loss in corroded RC structures. For residual safety considerations, a limit of 10% in rebar area reduction was suggested in Cairns, Du, and Law (Citation2003) whereas 30% was used by Amey, Johnson, Miltenberger, and Farzam (Citation1998). In terms of load capacity loss, a limit of 50% was given by Torres-Acosta and Martnez-Madrid (Citation2003), and a strength loss limit of 60% was used by Li (Citation2004).
It should be noted that the relationship between the strength/capacity loss and the rebar cross-sectional area loss strongly depends on the corrosion pattern (uniform corrosion or pitting corrosion) and whether the cross-sectional area loss is given as the average or the maximum local loss along the rebar. This may be one of the main reasons explaining the large variations in the admissible cross-sectional area loss or capacity loss proposed by different researchers. Considering the nature of generalised corrosion in this case study, a 15% limit of capacity loss was assumed. The limit value of ΔAs, as well as the corresponding corrosion depth xΔMu=15% and corrosion propagation time tΔMu=15% are given in . The smaller value of tw0.5,u and tΔMu=15% was taken as the corrosion propagation time tp. With the exception of FRC4, the crack width criterion limits the end of service life for all cases.
The service life of different designs is compared in . The service life of PL2 is slightly shorter than PL1, while FRC1 and FRC2 extend the service life of the basic design by 94% and 58% respectively. FRC3 and FRC4 extend it by 104% and 154% respectively. The service life of FRC4 is even longer than the design life of most bridges. With the same amount of fibres, FRC1 performs better than FRC2 (for vf = 0.5% vol.) and FRC4 better than FRC3 (for vf = 1.0% vol.), due to the different reinforcement amounts and layouts and, therefore, corrosion crack widths.
Table 7. Comparison of the service life of difference designs.
7.2. Lcca results
The cost results were expressed as the costs per bridge length. The base values of the parameters which varied in the sensitivity analysis were selected as: T = 120 years, Lbridge = 15 m, mf = 20 SEK/kg, p = 3.5%, and ADT = 10000 vehicles/day. Detailed results are included in the Supplementary Material 4.
7.2.1. Influence of unit cost of fibre on investment costs and life-cycle costs
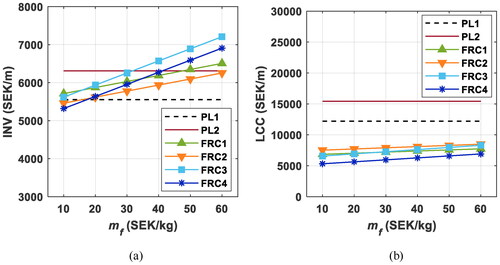
depicts the influence of mf on investment costs. When mf is equal to, or less than, 20 SEK/kg, the investment costs of all FRC cases are close to, or slightly higher than, that of PL1 but less than that of PL2. Therefore, using a greater amount of reinforcement may be more expensive than using fibres to control the transverse crack width. At the highest fibre cost (which might correspond to, say, stainless-steel fibres), the investment costs of FRC3 and FRC4 are about 30% and 24% higher than that of PL1. The total LCC after considering replacement and user costs is compared in . The LCC in all the FRC cases is less than in PL1 and PL2, even at the highest fibre cost. Under a normal fibre cost (mf = 20 SEK/kg), the total LCC of different hybrid RC designs is 37-54% lower than that of the basic traditional RC design.
Figure 12. Influence of unit cost of fibre on (a) investment costs (INV) and (b) life-cycle costs (LCC), under the parameters T = 120 y, Lbridge = 15 m, ADT = 10000 veh/d, p = 3.5%.
7.2.2. Sensitivity analysis on life-cycle costs
The influence of the bridge design life T, bridge length Lbridge, average daily traffic ADT, and discount rate p, on the life-cycle costs are presented in , respectively. The main findings from the sensitivity analysis are: i) in all the studied cases, hybrid RC designs have lower LCCs than the traditional RC designs PL1 and PL2; ii) LCC is most sensitive to the discount rate but only slightly affected by the bridge design life, bridge length and average daily traffic; iii) the replacement and user costs of hybrid RC designs are reduced substantially, compared to that of traditional RC ones.
Figure 13. Influence of the design life of a bridge (T = 120 or 80 y) on the LCC (including INV, REP and USE, representing investment, replacement and user costs respectively) for the six designs under the parameters mf = 20 SEK/kg, Lbridge = 15 m, ADT = 10000 veh/d, p = 3.5%.
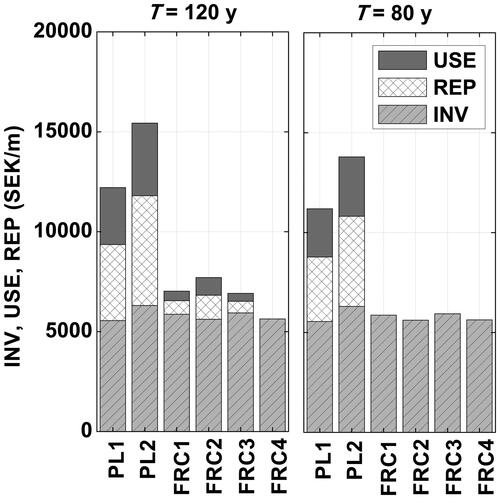
Figure 14. Influence of bridge length (Lbridge = 15 or 150 m) on LCC (including INV, REP and USE, representing investment, replacement and user costs respectively) for the six designs under the parameters mf = 20 SEK/kg, T = 120 y, ADT = 10000 veh/d, p = 3.5%.
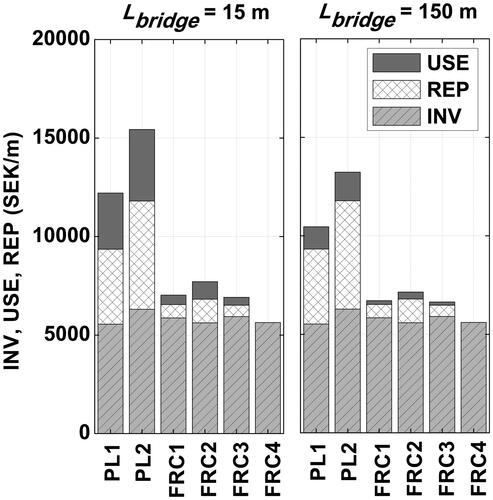
Figure 15. Influence of the average daily traffic (ADT = 5000, 10000, 15000, and 20000 veh/d) on LCC (including INV, REP and USE, representing investment, replacement and user costs respectively) for the six designs under the parameters mf = 20 SEK/kg, T = 120 y, Lbridge = 15 m, p = 3.5%.
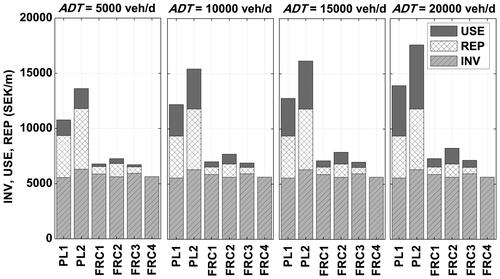
Figure 16. Influence of the discount rate (p = 2%, 3.5%, 5% and 7%) on LCC (including INV, REP and USE, representing investment, replacement and user costs respectively) for the six designs under the parameters mf = 20 SEK/kg, T = 120 y, Lbridge = 15 m, ADT = 10000 veh/d.
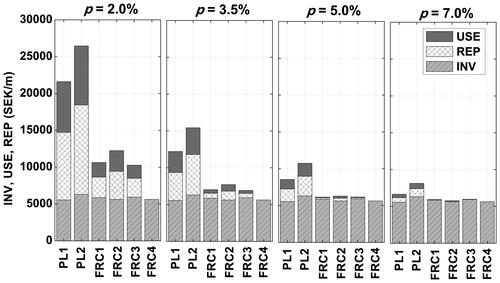
It is worth noting that, although the replacement and user costs at the investment time (that is, year 0) are similar, the present value of the replacement and user costs at the end of the edge beam’s life for each design has a major difference. This is mainly because the present value of the future costs is related exponentially to the replacement time (that is, the service life of the edge beam). The significantly longer service life of hybrid RC edge beams delays the first-time replacement by over 29 years (see ). In the traditional RC edge beam, the sum of replacement and user costs are comparable to the investment costs under a normal discount rate of 3.5%. However, in the hybrid RC edge beam, they are only a small fraction of the investment costs, or even zero.
The bridge length and average daily traffic only influence the user costs, as presented in and . Under the same average daily traffic, the user costs per meter are less for the longer bridge. As ADT increases, user costs occupy a higher portion of the total LCC. However, these two parameters have only a minor influence on the relative difference of LCC for hybrid RC and traditional RC designs.
The discount rate has a major influence on both the replacement and user costs. At the lowest discount rate of 2.0%, the replacement and user costs of the traditional RC designs are even significantly higher than the investment costs, while they decrease to only a small fraction of the investment costs as the discount rate increases, see . The replacement and user costs in the three hybrid RC designs (FRC1, FRC2 and FRC3), which need one-time replacement, are still less than the investment costs, even when the discount rate is very low due to the delayed replacement (as mentioned) and almost negligible at the highest discount rate. As for the total LCC, the reduction ratio of LCC for the hybrid RC designs relative to that of PL1 is greatest at the lowest discount rate and becomes insignificant as the discount rate increases to 7%. Therefore, hybrid RC designs can bring greater cost benefit at a lower discount rate. Only when the discount rate and fibre cost are both very high might the LCC of the hybrid RC designs be higher than that of traditional RC ones.
7.3. Lca results
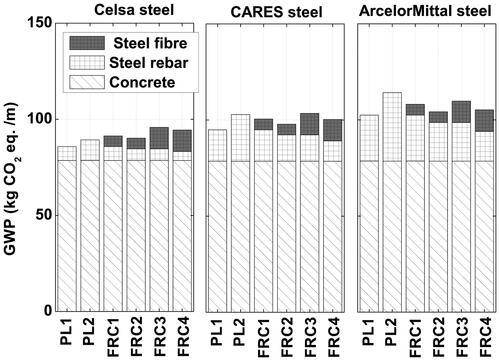
The total GWP of the materials to produce the edge beam were calculated and expressed as kg CO2 eq. per unit length of edge beam. The original data is included in the Supplementary Material 5. gives the GWP from the concrete, steel rebar and steel fibre in each alternative design. The results show that concrete takes up the majority of the total GWP. When steel rebar produces 0.37 or 0.839 kg CO2 eq./kg, the total GWP in all the hybrid RC designs is slightly higher than that of traditional RC designs PL1; nevertheless, the difference is small. Under higher CO2 eq. of steel rebar (1.23 kg CO2 eq./kg), PL2 stands out a little, with the highest total GWP. This implies that when the GWP of steel rebar is high, it is not environmentally friendly to control the transverse crack width by increasing the number of steel rebars.
Figure 17. Global warming potential (GWP) from the concrete, steel rebar and steel fibre in each design, with steel producers Celsa, CARES and ArcelorMittal respectively.
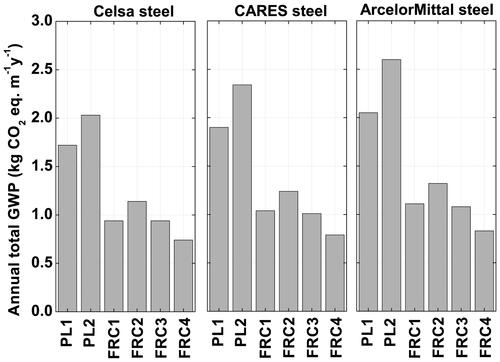
The annual total GWP of each design within the service life of the edge beam Teb is compared in . The annual total GWP of all the hybrid RC designs is lower than that of the traditional RC ones, regardless of the GWP value of steel rebar and it can be reduced by 33-60% relative to the basic traditional design PL1.
Figure 18. Comparison of the annual total global warming potential (GWP) in each design with steel producers Celsa, CARES and ArcelorMittal respectively.
8. Conclusions
This paper presents a case study of a bridge edge beam in Sweden, in which the service life, economic and environmental performance of hybrid and traditional reinforced concrete were compared. The results obtained in this study demonstrate that a hybrid RC edge beam with a low-to-moderate fibre content can reach a significantly longer service life than the traditional edge beam. It also provides a sustainable solution for the edge beam, from the economic and environmental points of view.
The main conclusions from this study are as follows:
Adding fibres can effectively control the restraint-induced cracking and corrosion-induced cracking, while possibly reducing the required number and/or diameter of traditional reinforcement bars. Conversely, increasing the amount of steel rebars to control restraint crack width in the traditional RC design had a negative effect on corrosion-induced crack propagation.
Among the different reinforcement configurations investigated, using 1.0% vol. steel fibres and reduced diameter of steel rebars was the most favourable combination for controlling corrosion cracks. However, the corrosion level required to reach the critical crack width entailed a great loss of steel area, thus posing a safety issue. Moreover, it should be noted that common warning signs of severe corrosion, such as wide corrosion cracks and cover spalling, may not be present in hybrid RC if high amounts of fibres are used.
The service life of the edge beam can be extended by 58-94% when adding 0.5% vol. fibres and by 104-154% when adding 1.0% vol. fibres.
The total LCC of different hybrid RC edge beam designs is about 37-54% less than the basic traditional RC design, under the base values for all the variable parameters. The investment costs of the hybrid RC designs are slightly higher than those of the traditional RC design at higher fibre costs, while the total LCC in all the hybrid RC designs is lower, due to delayed replacement and reduced instances of replacement. The bridge design life, bridge length and average daily traffic do not obviously affect the comparative LCC results, while the discount rate has a major impact. The benefit in reducing LCC by using hybrid RC is greater at a lower discount rate.
LCA shows that the total GWP from the materials used in producing the hybrid RC edge beam is close to or slightly higher than that of the basic traditional design. However, the annual total GWP in the hybrid RC designs is 33-60% lower, owing to the longer service life.
The LCC and LCA results provided in the paper cannot be extrapolated to all sorts of structures, as they are very much dependent on the assumptions taken in the analysis. In addition, for new structural materials, due to the lack of long-term field data, the accuracy of the service-life model becomes central for the LCC and LCA analysis. Further studies on the criteria used to define the end of the corrosion propagation stage for hybrid RC are required to improve the developed service-life model in this paper.
Supplemental Material
Download MS Word (56.8 KB)Disclosure statement
No potential conflict of interest was reported by the authors.
Additional information
Funding
References
- Al-Kamyani, Z., Guadagnini, M., & Pilakoutas, K. (2019). Impact of shrinkage on crack width and deflections of reinforced concrete beams with and without steel fibres. Engineering Structures, 181, 387–396. doi:10.1016/j.engstruct.2018.12.031
- Amey, S. L., Johnson, D. A., Miltenberger, M. A., & Farzam, H. (1998). Predicting the service life of concrete marine structures: an environmental methodology. Structural Journal, 95(2), 205–214.
- Andrade, C., Alonso, C., & Molina, F. (1993). Cover cracking as a function of bar corrosion: Part I-Experimental test. Materials and Structures, 26(8), 453–464. doi:10.1007/BF02472805
- Arcelormittal. (n.d.). Environmental Product Declaration https://epd-online.com/PublishedEpd/Download/9604.
- Berrocal, C. G. (2017). Corrosion of steel bars in fibre reinforced concrete: Corrosion mechanisms and structural performance (Doctoral Thesis). Chalmers University of Technology, Sweden
- Berrocal, C. G., & Löfgren, I. (2018). Hybrid Reinforcement Systems for Crack Width Control in Concrete Structures. (Report No. SBUF project number 12250). Chalmers University of Technology, Sweden
- Berrocal, C. G., Fernandez, I., Lundgren, K., & Löfgren, I. (2017). Corrosion-induced cracking and bond behaviour of corroded reinforcement bars in SFRC. Composites Part B: Engineering, 113, 123–137. doi:10.1016/j.compositesb.2017.01.020
- Berrocal, C. G., Löfgren, I., & Lundgren, K. (2018). The effect of fibres on steel bar corrosion and flexural behaviour of corroded RC beams. Engineering Structures, 163, 409–425. doi:10.1016/j.engstruct.2018.02.068
- Berrocal, C. G., Löfgren, I., Lundgren, K., & Tang, L. (2015). Corrosion initiation in cracked fibre reinforced concrete: influence of crack width, fibre type and loading conditions. Corrosion Science, 98, 128–139. doi:10.1016/j.corsci.2015.05.021
- Bertolini, L., Elsener, B., Pedeferri, P., Redaelli, E., & Polder, R. (2013). Corrosion of steel in concrete. KGaA, Weinheim: Wiley-VCH Verlag GmbH & Co.
- Blunt, J., Jen, G., & Ostertag, C. P. (2015). Enhancing corrosion resistance of reinforced concrete structures with hybrid fiber reinforced concrete. Corrosion Science, 92, 182–191. doi:10.1016/j.corsci.2014.12.003
- Boverket (2019). Boverkets konstruktionsregler, EKS11. Swedish National Board of Housing, Building and Planning, Sweden.
- British Standards Institution. (2012). Sustainability of construction works-Environmental product declarations-Core rules for the product category of construction products (BS EN 15804:2012).
- British Standards Institution. (2013). Concrete. Specification, performance, production and conformity (BS EN 206:2013).
- Cairns, D., Du, Y., & Law, D. (2003). Structural assessment of corrosion damaged bridges. Proceedings of the 10th International Conference and Exhibition-Structural Faults and Repair Conference 2003, London, July 2003.
- Celsa. (n.d.). Environmental Product Declaration https://gryphon4.environdec.com/system/data/files/6/8564/epd305%20Celsa%20Steel%20Service%202018.pdf.
- Chen, E., Berrocal, C. G., Löfgren, I., & Lundgren, K. (2020). Correlation between concrete cracks and corrosion characteristics of steel reinforcement in pre-cracked plain and fibre-reinforced concrete beams. Materials and Structures, 53(2), 33. doi:10.1617/s11527-020-01466-z
- Chen, Z., & Yang, E.-H. (2019). Microstructural investigation of steel corrosion in strain hardening cementitious composite (SHCC). Construction and Building Materials, 211, 185–198. doi:10.1016/j.conbuildmat.2019.03.247
- Comite Euro-internacional du beton. (1995). High performance concrete, recommended extensions to the model code 90, research needs (Bulletin 228).
- Djerbi, A., Bonnet, S., Khelidj, A., & Baroghel-Bouny, V. (2008). Influence of traversing crack on chloride diffusion into concrete. Cement and Concrete Research, 38(6), 877–883. doi:10.1016/j.cemconres.2007.10.007
- DuraCrete (2000). Probabilistic performance based durability design of concrete structures The European Union–Brite EuRam III, Final technical report of Duracrete project, Document BE95‐1347/R17.
- Engström, B. (2007). Restraint cracking of reinforced concrete structures. Sweden: Chalmers University of Technology.
- EPD. (2019). International EPD system. PCR basic module. CPC divisioin 53: Constructions. Version 3.02 https://www.environdec.com/PCR/Detail/?Pcr=7070.
- EPD-Norge (2017a). Mapei. The Norweigian EPD Foundation https://www.epd-norge.no/fiber-reinforcement/steelfibre-de-35-0-55-de-50-0-75-og-de-50-1-0-article1633-423.html.
- EPD-Norge (2017b). Svensk Betong. The Norweigian EPD Foundation https://www.epd-norge.no/betongvarer/betong-for-vagbro-article1540-316.html.
- European Committee for Standardization. (2004). Eurocode 2: Design of concrete structures: Part 1-1: General rules and rules for buildings (BS EN 1992-1-1:2004). British Standards Institution.
- François, R., Laurens, S., & Deby, F. (2018). Corrosion and its consequences for reinforced concrete structures. Elsevier.doi:10.1016/C2016-0-01228-7
- Hordijk, D. A. (1991). Local approach to fatigue of concrete (Doctoral dissertation). Delft University of Technology, Netherlands
- International Federation for Structural Concrete. (2006). Model Code for Service Life Design (Bulletin 34).
- International Federation for Structural Concrete. (2010). fib Model Code for Concrete Structures 2010.
- Jepsen, M. S., Damkilde, L., Lövgren, I., & Berrocal, C. (2018). Adaptive inverse analysis (AIA) applied and verified on various fiber reinforced concrete composites. Materials and Structures, 51(3), 60. doi:10.1617/s11527-018-1177-0
- Koch, G. H., Brongers, M. P., Thompson, N. G., Virmani, Y. P., & Payer, J. H. (2002). Corrosion cost and preventive strategies in the United States (Report No. FHWA-RD-01-156, R315-01). United States. Federal Highway Administration
- Leung, C. K., & Hou, D. (2015). Numerical simulation of chloride-induced corrosion initiation in reinforced concrete structures with cracks. Journal of Materials in Civil Engineering, 27(3), 04014122. doi:10.1061/(ASCE)MT.1943-5533.0001057
- Li, C. Q. (2004). Reliability based service life prediction of corrosion affected concrete structures. Journal of Structural Engineering, 130(10), 1570–1577.
- Löfgren, I. (2007). Calculation of crack width and crack spacing. Nordic Mini Seminar, Fibre reinforced concrete.
- Löfgren, I., Stang, H., & Olesen, J. F. (2005). Fracture properties of FRC determined through inverse analysis of wedge splitting and three-point bending tests. Journal of Advanced Concrete Technology, 3(3), 423–434. doi:10.3151/jact.3.423
- Lundgren, K. (2005). Bond between ribbed bars and concrete. Part 2: The effect of corrosion. Magazine of Concrete Research, 57(7), 383–395. doi:10.1680/macr.2005.57.7.383
- Mattsson, H.-Å., Sundquist, H., & Silfwerbrand, J. (2007). The real service life and repair costs for bridge edge beams. Restoration of Buildings and Monuments, 13(4), 215–228. doi:10.1515/rbm-2007-6140
- Niu, Y., & Fink, G. (2019). Life Cycle Assessment on modern timber bridges. Wood Material Science & Engineering, 14(4), 212–225. doi:10.1080/17480272.2018.1501421
- Penadés-Plà, V., Martí, J. V., García-Segura, T., & Yepes, V. (2017). Life-cycle assessment: A comparison between two optimal post-tensioned concrete box-girder road bridges. Sustainability, 9(10), 1864. doi:10.3390/su9101864
- Racutanu, G. (2001). The real service life of Swedish road bridges (Doctoral dissertation, Institutionen för byggkonstruktion). Sweden
- Raupach, M., Dauberschmidt, C., & Eichler, T. (2004). Corrosion behaviour of steel fibres in concrete containing chlorides. EUROCORR2004 - European Corrosion Conference, Long Term Prediction and Modelling of Corrosion, Nice.
- Robuschi, S., Sumearll, J., Fernandez, I., & Lundgren, K. (2020). Bond of naturally corroded, plain reinforcing bars in concrete. Structure and Infrastructure Engineering, 53(2), 1–17.
- Rots, J. G. (1988). Computational modeling of concrete fracture (Doctoral dissertation). Delft University of Technology, Netherlands
- Sadrinejad, I., Ranjbar, M. M., & Madandoust, R. (2018). Influence of hybrid fibers on serviceability of RC beams under loading and steel corrosion. Construction and Building Materials, 184, 502–514. doi:10.1016/j.conbuildmat.2018.07.024
- Safi, M., Sundquist, H., Karoumi, R., & Racutanu, G. (2013). Development of the Swedish bridge management system by upgrading and expanding the use of LCC. Structure and Infrastructure Engineering, 9(12), 1240–1250. doi:10.1080/15732479.2012.682588
- Salokangas, L. (2013). ETSI project: Bridge Life Cycle Optimisation: stage 3. Finland: School of Engineering, Aalto University.
- Schießl, P., & Raupach, M. (1997). Laboratory studies and calculations on the influence of crack width on chloride-induced corrosion of steel in concrete. Materials Journal, 94(1), 56–61.
- Stripple, H., Ljungkrantz, C., Gustafsson, T., & Andersson, R. (2018). CO2 uptake in cement-containing products: Background and calculation for IPCC implementation. (Report No. B 2309). IVL Swedish Environmental Research Institute, Sweden.
- Tahershamsi, M., Fernandez, I., Lundgren, K., & Zandi, K. (2017). Investigating correlations between crack width, corrosion level and anchorage capacity. Structure and Infrastructure Engineering, 13(10), 1294–1307. doi:10.1080/15732479.2016.1263673
- Tang, L., & Utgenannt, P. (2007). Chloride Ingress and Reinforcement Corrosion in Concrete under De-Icing Highway Environment-A study after 10 years' field exposure (Report No. 2007:76). SP Technical Research Institute of Sweden
- Thoft-Christensen, P. (2012). Infrastructures and life-cycle cost-benefit analysis. Structure and Infrastructure Engineering, 8(5), 507–516. doi:10.1080/15732479.2010.539070
- Thorenfeldt, E. (1987). Mechanical properties of high-strength concrete and applications in design. Symposium Proceedings, Utilization of High-Strength Concrete, Norway.
- Torres-Acosta, A. A., & Martnez-Madrid, M. (2003). Residual life of corroding reinforced concrete structures in marine environment. Journal of Materials in Civil Engineering, 15(4), 344–353. doi:10.1061/(ASCE)0899-1561(2003)15:4(344)
- Trafikverket (2011). TRVR Trafikverkets tekniska råd Bro 2011: 086 D.1.4.1.6. Swedish Transport Administration.
- UK CARES. (n.d.). Environmental Product Declaration https://ukcares.com/downloads/general/BREG%20EN%20EPD%20000125.pdf.
- Vandewalle, L. (2000). Cracking behaviour of concrete beams reinforced with a combination of ordinary reinforcement and steel fibers. Materials and Structures, 33(3), 164–170. doi:10.1007/BF02479410
- Veganzones Muñoz, J. J. (2016). Bridge edge beams: LCCA and structural analysis for the evaluation of new concepts (Licentiate thesis). KTH Royal Institute of Technology, Sweden
- Veganzones Muñoz, J. J., Pettersson, L., Sundquist, H., & Karoumi, R. (2016). Life-cycle cost analysis as a tool in the developing process for new bridge edge beam solutions. Structure and Infrastructure Engineering, 12(9), 1185–1201. doi:10.1080/15732479.2015.1095770
- Wang, Q., Sun, W., Guo, L., Gu, C., & Zong, J. (2018). Prediction of chloride ingress in steel fibre reinforced concrete under bending load. Ceramics–Silikáty, 62(1), 59–66.
- Weyers, R. E. (1998). Service life model for concrete structures in chloride laden environments. ACI Materials Journal, 95(4), 445–453.
