
Abstract
Visual inspection is currently the industry standard for assessing sewer and stormwater pipelines – a method prone to uncertainties as shown by previous studies. The data gathered from the visual inspection procedures is the main information base on which rehabilitation and replacement strategies are founded in current practice. Consequently, this study evaluates the quality of visual inspection data by quantifying the uncertainty and assessing its impact on the output of a deterioration model. The study was carried out by re-classifying pipe condition classes using the same video footage and transferring differences in the classifications into a distribution that was used as a measure of input data uncertainty. This quantified uncertainty was then propagated into a deterioration model using a Monte Carlo approach to assess its impact on the model behaviour. Results show that there is a considerable uncertainty in condition classes coded according to the Norwegian standard, and that it is comparable to uncertainties estimated in other studies using various European coding systems. The uncertainty assessment indicates that the uncertainties have a considerable impact on the model predictions, which in consequence demonstrates that the uncertainty in the visual inspection methodology can heavily influence the decisions for rehabilitation and replacement strategies.
1. Introduction
Sewer and stormwater infrastructure provide critical service to public health and safety as well as urban flooding prevention and provide pollution control of the natural aquatic environment (EN 752, Citation2008). It is therefore important that the sewer system is kept in a condition that assures that these services are upheld, which the United Nations (Citation2021) strongly emphasise by highlighting the value of water from different perspectives. From a cost perspective, the value of urban drainage infrastructure assets represents a major public or private investment and their management has significant economic impact. For example, the sewer network in the European Union has an overall length of 2.5 million kilometres and a replacement value of 2.5 trillion € (Brüggemann, Citation2017).
Investment needs for urban water supply and drainage infrastructure combined, if countries want to comply with current European directives, are expected to amount to total cumulative additional expenditures of 289 billion Euros for the 28 EU member states by 2030, with sanitation representing the lion's share of the total additional expenditures (OECD, Citation2020). In general, the European countries are spending well below those investment needs on the rehabilitation of their urban drainage infrastructure (Tscheikner-Gratl et al., 2019). In Norway in 2018, about 218 km of urban drainage pipes were replaced, while 322 km of new ones were constructed, showing a higher development rate than renewal rate, which has been the case since 2002 (SSB, Citation2021). Although significant investments are being made in places, the sewer network is in poor condition with a renewal rate of 0.6% per year and a non-increasing trend in the future, as there is a large variability in the progress of different municipalities (RIF, Citation2019).
The municipalities planning investments do so mainly by developing and applying condition or risk-based rehabilitation strategies (Bruaset, Citation2019; Rokstad & Ugarelli, Citation2015), which rely heavily on the information provided by visual inspection techniques and the subsequent condition assessment methods and forecasting of the condition deterioration using statistical models. The most prevalent method for visual inspection and acquiring sewer inspection data is using Closed-Circuit Television (CCTV). CCTV is considered the industry standard for inspecting sewers, in parts due to its low price compared to other methods that exist for sewer inspection (Roghani, Cherqui, Ahmadi, Le Gauffre, & Tabesh, Citation2019). However, CCTV inspection produces only a video depicting the internal conditions of sewer pipes, and only by registering and describing the severity of defects and dysfunctionalities, the pipes are classified into condition classes (CC) by an operator.
This process is fraught with uncertainties due to shortcomings inherent in such an endeavour: subjectivity of the defect description and defect detection due to the human factor (Dirksen et al., Citation2013) and variability between operators, defects not being observed due to technical properties of the camera (Plihal, Kuratko, Schmidt, Hörandner, & Ertl, Citation2014), dependence on description from guidelines in itself and the varying national guidelines (e.g. Norsk Vann Rapport 2355 (2018) in Norway) and tools (for an overview see e.g. Kley, Kropp, Schmidt, & Caradot (Citation2013)), for establishing the condition states which make comparisons difficult, although they often base on the same standards (in Europe EN 13508-2 (Citation2011)).
Though it would be of interest to mitigate these uncertainties, there have not been considerable efforts to do so. Sousa, Ferreira, Meireles, Almeida, and Saldanha Matos (Citation2013) reported that the inspector’s uncertainty had a marginal influence in the selection of the sewers for additional analysis when compared to the uncertainty associated with the coding protocol used. CCTV inspection protocols entail two dimensions, namely coding the defects and grading the defects. Despite the differences in national standards (usually simplifications), there is a common European standard for defects coding (EN 13508-2, Citation2011) and so, to a certain extent, this is valid at an international level. The latter is slightly distinct since there is no European standard for grading sewer defects but rather various national standards on defects rating.
A defects rating reflects the relative weight that each type of defect has on the sewer condition. Since they have been developed mostly based on expert opinion (with limited and biased statistical information), there are substantial differences between them depending on the context of each country. This suggests that alterations in the coding protocol could be an effective way to reduce the uncertainties. According to van der Steen, Dirksen, and Clemens (Citation2014), more detailed coding protocols to describe the defects had a negative influence on the recognition of defects. From a pragmatic point of view, this makes sense. There is a limit to humans’ ability to process and respond to information, and by introducing several possibilities to describe a defect, one also increases the possibility of making errors.
To account for this, van der Steen et al. (Citation2014) recommend that coding systems should avoid doubt by making the various methods of describing a defect unambiguous. Dirksen et al. (Citation2013) suggest investigating the effect of using photographs that describe defects in the coding protocols, which has been done in the Norwegian Guideline (Norsk Vann Rapport 235, Citation2018). Another possible way to reduce uncertainty in the sewer inspection data, based on the findings from Caradot, Rouault, Clemens, and Cherqui (Citation2018), is to improve the data management procedures so that improper inspections and undocumented rehabilitations do not affect the data used for calibrating deterioration models. Tscheikner-Gratl et al. (2019) point out that the human factor may be diminished using artificial intelligence in the upcoming years, but this may not completely cancel out the uncertainties of visual condition assessment.
Although this issue has been first raised almost a decade ago (Dirksen et al., Citation2013) and is also not questioned by practitioners, and even though this data is the basis for rehabilitation and replacement strategies, the research on the uncertainties and their influence on the deterioration models supporting the decision-making process is scarce and focussed only on some few case studies. While there are a lot of studies focussing on the development and application of different deterioration models especially with the applicability of machine learning techniques (e.g. Caradot, Riechel, et al., Citation2018; Laakso, Kokkonen, Mellin, & Vahala, Citation2018; Malek Mohammadi et al., Citation2019) uncertainties of those models are so far not investigated in detail in most applications. A few studies exist: For example, recent studies (Mancuso, Compare, Salo, Zio, & Laakso, Citation2016; Roghani et al., Citation2019) looked into the negative influence of uncertainties on the efficiency of sewer inspection programs. Caradot et al. (Citation2020) showed the influence of uncertainties in the input data to a deterioration model by propagating the input uncertainty derived from repeated inspections directly in the survival curves of the deterioration model.
The uncertainty assessments have often focussed on structural uncertainty by comparing prediction performance of different models on the same data set. For example, non-homogeneous Markov Chain models with random forest (Rokstad & Ugarelli, Citation2015), or artificial neural networks and support vector machines (Sousa et al., Citation2014) to name a few. Other studies focussed on the influence of data availability and completeness (Ahmadi, Cherqui, De Massiac, & Le Gauffre, Citation2015, Citation2014; Taillandier, Elachachi, & Bennabi, Citation2020), sample size for model calibration (Ahmadi, Cherqui, Aubin, & Le Gauffre, Citation2016), lack of data about historical pipe replacements as a source of uncertainty (Egger, Scheidegger, Reichert, & Maurer, Citation2013) and the influence of data heterogeneity (Rokstad & Ugarelli, Citation2016). When input uncertainties have been quantified (Caradot, Rouault, et al., Citation2018; Dirksen et al., Citation2013; Sousa et al., Citation2013; van der Steen et al., Citation2014), the numbers differ from case study to case study between 25% and 50% of CC variation with repeated inspections of the same pipe, but the main message stays the same: CCTV inspection introduces a high level of uncertainty into every modelling endeavour based on its outcome.
In order to contribute to more evidence and data to the topic, this study seeks to answer the following research questions: how big is the uncertainty in the closed-circuit-television inspection data of sewer pipes in Norway compared to literature and how does the uncertainty influence the output of a commonly used sewer deterioration model on a network level? The research questions are addressed by assessing the quality of existing CCTV inspection data and quantifying the uncertainty magnitude, using the data’s ability to get reproduced as a measure to evaluate the uncertainty. To assess the reproducibility of the data, a condition re-assessment of existing CCTV inspection videos was conducted and compared to the classification originally made by the operator. The existing differences were used to quantify the uncertainty in the CCTV inspection data. Consequently, the effect of this uncertainty is assessed by evaluating its influence on the output of a sewer deterioration model.
2. Materials and methods
This study aims at assessing the uncertainty in CCTV data codified using the Norwegian condition classification standard (Norsk Vann Rapport 235, Citation2018), and the impact this uncertainty has on the predictions in a sewer deterioration model (Le Gat, Citation2008) commonly used in Norway. The Norwegian condition classification standard is based on the European standard (EN 13508-2, Citation2011), and contains defect codes pertaining to similar defects as the ones described in the European standard (e.g. deformation, fissures, surface damage, intruding connections, roots, deposits, infiltration/exfiltration etc.).
However, the Norwegian classification standard is somewhat simplified compared to the European standard, as it contains fewer distinct defect codes, and fewer characterisation codes describing the details of each defect. For example, the Norwegian standard only has one defect code describing cracks and collapses of pipes, where the European standard uses several codes (fissure, break/collapse, defective brickwork, missing mortar). Defect codes are rated on an ordinal scale from 1 to 4, where 1 is a mild defect and 4 a very severe defect. Each rating corresponds to a weighting factor (which is different for each defect code), that sums up to the aggregated condition score. The CC is then determined based on the sum of all assigned weighting factors. The study is undertaken in two parts (see ):
Figure 1. Schematic illustration of the applied method.
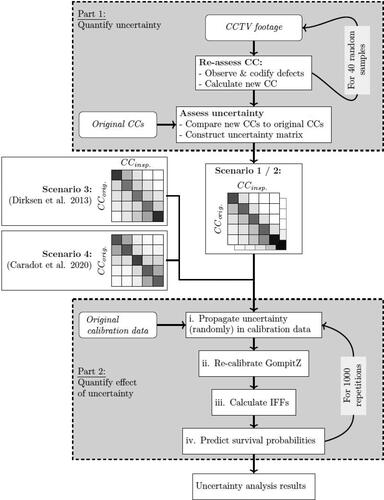
Part 1: First, the uncertainty in the CCTV data is quantified by repeating the interpretation of inspections (see Section 2.2).
Part 2: Then, the resulting uncertainty is propagated into the data used to calibrate a sewer deterioration model, and the resulting output uncertainty is assessed by Monte Carlo simulation (see Section 2.3).
2.1. Background on sources of uncertainty in CCTV inspection data and condition deterioration modelling
Dirksen et al. (Citation2013) made the first comprehensive evaluation of the quality of visual sewer inspection data. More specifically, this research assessed the consistency of CCTV-derived condition data, by analysing its reproducibility (i.e. how well an inspection result can be reproduced by another operator). The authors identified three sources of uncertainty in CCTV inspection data:
The recognition of defects. This involves both technical and human aspects. Technical errors are introduced when features of the pipe cannot be observed by the CCTV camera. These errors can occur for instance when there is insufficient lighting, the camera lens is fouled, or the inspection is carried out too rapidly for the defects to appear in the images (Dirksen et al., Citation2013). Another issue is that CCTV inspection can only capture the defects that are visible for the camera. Obstacles to visualisation (the state of the sewer at the time of inspection, e.g. flow retention) and the capabilities of the cameras to detect defects (characteristics of the camera) are sources of uncertainty that can affect the quality of the inspection data (Sousa et al., Citation2013).
The description of defects according to a prescribed coding system. When a defect can be observed from the CCTV footage, it must be detected and codified by the inspector, which introduces the possibility for two errors to occur: a) a false negative (FN) occurs when the inspector misses a defect that is there or considers the defect to be less severe than it really is, and b) a false positive (FP) occurs when the inspector reports a defect that is not there or considers the defect to be more severe than it is in reality (Roghani et al., Citation2019). There are several reasons why FNs and FPs can occur when codifying defects based on CCTV footage of sewers. An inspector might be too focussed on one specific defect (leading to FPs), that other defects might be neglected (leading to FNs). The incidence rate might also affect which defects are more easily observed than others (Dirksen et al., Citation2013). Factors that influence the variability in identified defects between different operators could be experience and competence, while variability between inspections codified by the same operator could be due to concentration and fatigue (Sousa et al., Citation2013), both of which can be regarded as systematic errors. The description of defects according to a prescribed coding system concerns the characterisation, quantification of magnitude, and the location of the defect, and errors in describing these can also contribute to uncertainty in the inspection data. Such errors can be made when the coding system is ambiguous, or by incorrect application of the coding system (Dirksen et al., Citation2013). Moreover, different coding protocols might have different ways of determining the sewer CC, and studies indicate that the uncertainty introduced by the coding protocols has a significant influence on the resulting structural condition grades to which the sewer pipes are assigned (Sousa et al., Citation2013).
The interpretation of the final inspection report. This step concerns the sewer managers’ (or decision makers’) opinion about the inspection data’s implication for the sewer pipes’ replacement and rehabilitation strategies, which also introduces uncertainty because these opinions can be subjective. Furthermore, non-reported considerations may have been considered in this step, which may render the interpretation of the report non-repeatable.
FNs are generally more likely than FPs, when comparing repeated inspections. The prevalence of FNs over FPs is often caused by the fact that certain defects (e.g. cracks) can be hidden and/or difficult to detect visually on the CCTV footage (for example due to sediments or water covering the defect). One of the studies indicated that the probability of a FN was around 25%, while the probability of a FP was about 4%. This means that it is more likely that defects are not detected and coded accordingly, than defects being over-reported (Dirksen et al., Citation2013).
Later, several studies (Caradot, Riechel, et al., Citation2018; Sousa et al., Citation2013; van der Steen et al., Citation2014) using similar methodologies have yielded similar results, demonstrating that the occurrence of FNs is generally more prevalent than that of FPs. The different studies show different results depending on which classification standard that has been used, but on the overall, one can conclude from literature that the uncertainties in defect detection and coding are considerable, owing to their subjective nature. Most of the studies found in the literature on this topic has focussed on the ability to recognise defects and the associated FN and FP rates for individual defects; the judgement of the defects’ severities, and their consequent impact on the resulting CC, have therefore not been emphasised in most studies.
Given that there seems to be a significant uncertainty within the CCTV sewer inspection data, it is of interest to know how this uncertainty affects the decisions of replacement and rehabilitation strategies. Deterioration models can be used to predict the evolution of a sewer network’s condition given different investment strategies (Caradot et al., Citation2020) and they are a prerequisite for a proactive management of sewer infrastructures (Roghani et al., Citation2019). Even though CCTV inspection is an economic choice in assessing sewer conditions, they come at a cost, and it is not practically feasible to inspect an entire network by CCTV regularly. Therefore, it is more beneficial to inspect a subset of the whole pipe network and use deterioration models to extrapolate this to the rest of the network to save inspection resources (Caradot et al., Citation2017).
Thus, if there is uncertainty in the CCTV data used to calibrate a sewer deterioration model, this uncertainty will affect the confidence one can place in the predictions from said model, and consequently the decisions which are made based upon the model results. A feasible way to assess the influence of uncertainty in CCTV data is therefore to assess the results from the deterioration models. Rokstad and Ugarelli (Citation2015) assessed the benefits of applying sewer deterioration models for infrastructure asset management and found that, on a network level, the predictions from sewer deterioration models were not more informative than an uninformed estimate of the distribution of CCs based solely on the CC data used for calibration. The authors pointed out that inconsistent data can be a reason for the uncertain predictions (Rokstad & Ugarelli, Citation2016).
Furthermore, Roghani et al. (Citation2019) investigated the impact of uncertainty in assessed condition data on a deterioration model and whether it was better to over- or underestimate the deterioration of a segment. The study concluded that uncertainties in the assessed condition data had a negative impact on the inspection efficiency, and that underestimation of the deterioration had a more severe impact than overestimation. Considering that the literature on uncertainty in CCTV defect detection is consistent in reporting that underestimation (FNs) of sewers happens more frequently, this finding indicates that the impact of CCTV inspection data uncertainty can be severe when used for deterioration modelling. However, the study concludes that condition prediction models are worth using even if there exists uncertainty in the condition assessment of sewers. Caradot et al. (Citation2020) found an indication that old pipes in bad condition were more prone to FNs than FPs, compared to newer, less deteriorated pipes. Moreover, their analysis showed that when uncertainties were not considered, the required replacement rate to maintain a constant network condition were underestimated.
Thus, from the literature one can ascertain that CCTV-derived sewer condition classification data can have considerable uncertainties, owing to the subjective nature of the detection and coding procedure entailed in most sewer classification standards. The level of uncertainty depends on the condition deterioration of the sewers and the classification standard used. Moreover, this uncertainty can impact the quality of predictions made from sewer deterioration models which are calibrated based on the uncertain CCTV data, and consequently impact the adequacy of investment and rehabilitation.
2.2. Estimation of uncertainty in the CCTV condition classification procedure
Similar to Dirksen et al. (Citation2013), this study analyses the reproducibility of CCTV inspection data, and uses it as a measure of the data’s uncertainty. This reproducibility uncertainty was analysed by performing a re-classification (re-observing and re-codifying defects) of sewer pipes according to the Norwegian Guidelines at the time (NORVAR Rapport 150, Citation2007), and comparing the newly obtained classification result with the result from the original classification. The re-classification is performed using the same footage as in the original classification. The difference in results between the original CC and the CC obtained in this study is then used as a measure of the data’s uncertainty. This uncertainty is then expressed by an uncertainty matrix (Caradot, Rouault, et al., Citation2018), which summarises the probability of observing a CC given the original CC observation.
The original and repeated classifications were performed by different persons, and the original CC result was not revealed to the operator until after the reclassification was completed. The repeated classification of each pipe should as such be considered as independent of the original classification. The original classification was performed by expert inspectors/operators (holding certifications of training in the Norwegian coding system), while the re-classification was performed by an unskilled operator with quality control by an expert. This is a means to observe the maximum uncertainty in the data as the uncertainty between trained operators may, but does not necessarily have to (as shown by (Dirksen et al., Citation2013)), be smaller.
2.3. Estimation of CCTV data uncertainty impact on condition deterioration modelling results
The results of the CC uncertainty estimation using CCTV footage (Section 2.2) yields a distribution of deviations between the CCs obtained by the authors and the professional pipe inspectors’ condition classifications. The impact this uncertainty distribution has on the deterioration model predictions can be assessed by means of a Monte Carlo simulation (Robert & Casella, Citation2010), checking the convergence with a stopping criterion based on the 95% confidence level of mean and variance (Lea, Citation2011) of the number of pipes in a certain CC. By using the Monte Carlo simulation, the uncertainty distribution is propagated by repeatedly changing the CCs in the calibration data set according to the deviation probabilities obtained from the uncertainty matrix from part 1 (see ), recalibrating and performing predictions with the recalibrated model, one can estimate the resulting uncertainty propagated through the model. This approach was selected since the CCTV inspection data is not merely input to the model but has a major influence on the calibration of the model and in consequence the model parameters. This puts them between input and calibration uncertainties (Deletic et al., Citation2012).
The statistical sewer deterioration model GompitZ (Le Gat, Citation2008) was chosen for this case study, as this model has already been used in several case study projects in Norway in the past (e.g. Rokstad & Ugarelli, Citation2015). The performance of predictions from GompitZ given uncertain CCTV-derived Norwegian CC data is therefore highly pertinent. GompitZ models the deterioration of sewer CCs using a non-homogeneous Markov chain, meaning that the transition probabilities between Markov states (i.e. the probability that a pipe transitions from one condition to another) varies with time. Furthermore, the transition probabilities are derived from Gompertz distribution, which allows one to include (time-dependent and -independent) explanatory variables (covariates) that may explain the variability in condition deterioration of the sewer pipes. The parameters in GompitZ are calibrated/estimated by maximum likelihood estimation.
The time-independent covariates account for the initial CC, while the time-dependent covariates include variables that can explain the deterioration rate (speed) of the pipe (Le Gat, Citation2008). CC predictions are made in two different ways in GompitZ, depending on whether the condition of a pipe has been observed: a) if a pipe’s condition has been observed at least once, the condition prediction is based on the calibrated survival curve function and the estimated individual frailty factor (IFF), which accounts for the difference between model prediction and observation at the time of inspection; b) if a pipe’s condition has not been observed, the prediction is made using only the survival curve functions (the marginal model).
The Monte Carlo simulations are performed as follows (compare with ):
The uncertainty is propagated into the calibration data set by changing CCs randomly according to the probabilities obtained in Part 1.
GompitZ is calibrated using this randomised data set.
Based on calibrated parameters the individual frailty factors (IFFs) are calculated for pipes which have been observed.
Survival probabilities are calculated for each CC for 5-year age groups (where the age refers to the age of the pipe at the time of observation).
The process returns to step (i) until the number of desired repetitions has been reached.
The uncertainty obtained in Part 1 (compare with ) was propagated into the model calibration using two different assumptions:
Scenario 1: Age-independent uncertainties. Uncertainties were propagated as calculated in the matrix in Part 1, without any changes. This assumes that the uncertainties are equally valid for all pipes.
Scenario 2: Age-dependent linear increase. The complete data set of inspections contains results from inspections of pipes of all ages. New pipes are often inspected as part of the quality assurance during construction. Young pipes are therefore generally less prone to defects than old pipes, and consequently also less susceptible to uncertainty in the condition assessment process. The assumption in scenario 1, that all pipes equally disposed to the uncertainty, is therefore not necessarily valid. To account for this age-dependency, it was assumed that there was no uncertainty in inspection results for pipes inspected at age zero, and that the uncertainty increased linearly for pipes between ages zero and the youngest pipe (age = 29 years) which was re-classified and found exhibiting a deviation from the original classification in Part 1.
To expand the scope of the study, and make the results comparable to previous studies, Part 2 (see ) of the analysis was also performed using uncertainty data derived from previous studies:
Scenario 3: The data presented by Dirksen et al. (Citation2013). These results were based on the old German standard (ATV-M 149, Citation1999), where 0 was the worst condition and 4 was the best. The data were therefore translated to the same numeric system (1 to 5) which is currently used in the Norwegian classification system
Scenario 4: The data presented by Caradot et al. (Citation2020). This study assumed a system containing only three CCs, where 1 was the best and 3 was the worst condition class. The uncertainty matrix has been kept as is, while the input data was adjusted in the following way to fit the uncertainty matrix: CC1 and CC2 were combined into a common CC1, CC3 translated into CC2 and CC4 and CC5 were combined into a common CC3.
The uncertainty matrices for Scenario 3 and 4 can be seen in , and the ones for Scenario 1 and 2 in the results section in . The Monte Carlo simulations were performed with 1000 repetitions (for each uncertainty assumption), which were found in preliminary tests to be sufficient to represent the uncertainty distribution, with e.g. for Scenario 1 a confidence interval of the current mean estimate (Lea, Citation2011) below ±0.3% for each CC after 1000 repetitions. Based on the results from the Monte Carlo simulations the 5% and the 95% percentiles of the survival probabilities were calculated to represent the uncertainty bands.
Figure 2. Bar chart showing the deviation between this project's and professional pipe inspector’s condition classification of the same CCTV video and the derived uncertainty matrix showing the probability of a pipe to be really in condition y when inspected in condition x.
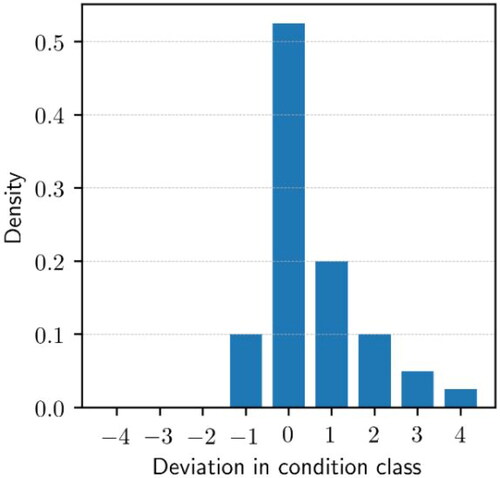
Table 1. Uncertainty matrices for scenario 3 and 4.
Table 2. Uncertainty matrix for scenario 1 and 2.
2.4. Case study area description
Data from the sewer system of Trondheim, Norway, was used for this case study. As of 2016, the municipality of Trondheim’s database of sewer pipes contained 30,131 segments (from manhole to manhole), where 26,180 are registered to be in use. The total length of the sewer pipes that are in use is 1196.60 km. Gravity-based combined sewers, separate sewers, and storm water sewer pipes make up 320.51 km, 352.15 km, and 455.54 km of the pipe system lengths, respectively. These pipes make up 94.3% of the total sewer network, where the combined sewer pipes, foul sewer pipes, and the stormwater pipes respectively make up 26.78%, 29.43% and 38.07% of the sewer network that are registered to be in use.
Other pipe types are pressurised combined sewer pipes, combined sewer tunnel segments, stormwater overflow pipes, and pressurised sewer pipes that ranges from 10-15 km each. Concrete is the prevalent material in the sewer network in Trondheim, making up 83% of the whole network. 9% of the pipes are PVC and the rest are clay, different types of PE, synthetic fibre, and glass fibre pipes. Of this network 43.12% were inspected as of 2020. There is a major overrepresentation of segments in CC1 (49.28% - see ) and one can clearly see the indications of survival bias in the data, e.g. when looking at the CC of the pipes constructed before 1900.
Table 3. Distribution (%) of installation periods and observed CC for concrete pipes.
The re-classification was performed based on CCTV footage from 40 (to fulfil the requirements of the central limit theorem) different sewer pipes in Trondheim, which were selected randomly to represent the concrete pipes of the system with a focus on the two largest drainage zones. Only concrete pipes were included in this study, as concrete is the dominant material used in Trondheim’s sewer systems. The available inspection data are from the period 2008-2017, for which the NORVAR Rapport 150 (Citation2007) was the standard for sewer condition assessments in Norway. The age of the pipes varied from 0 to 102 years at the time of inspection and the diameters from 125 mm to 600 mm. This information was used as input for the GompitZ deterioration model, and as covariates if found statistically significant during the calibration process.
3. Results and discussion
3.1. Estimated uncertainty
presents the resulting deviation of this study’s condition assessment from the original CC and the resulting uncertainty matrix. A deviation of 0 means that that this study has found a pipe to be in the same CC as the original inspector. When the deviation in CC is negative, this means that this study’s CC is lower than what the inspector has given. Similarly, a positive deviation in CC means that this study has given a higher CC to the pipe than the original inspector. The terms FN and FP will be used in this study to compare the results with other studies, as most of the literature on the uncertainty in CCTV sewer inspection (e.g. Caradot, Rouault, et al., Citation2018; Dirksen et al., Citation2013) has used these terms using the second classification as the ‘correct’ one, although the authors are aware that it in reality is impossible to say which of the two classifications is correct, as a condition class is not an objective and measurable property. FNs arise when a defect that is in the pipe is not recognised, or its severity is reported to be lower than it is. This means that FN can underestimate the pipe’s CC because the pipe’s damage score becomes lower. Conversely, FPs are introduced when a defect that is not really there is reported, or its severity is reported to be more serious than it really is. Therefore, FPs can overestimate the pipe’s CC because its damage score become larger due to the introduced errors.
In the case study data from Trondheim (see ) there is a probability of 52.5% to reproduce the CC data from CCTV sewer inspection. This is in accordance with the literature that assessed the uncertainties in describing sewer defects using similar condition classification schemes. Müller (Citation2005) used data from 307 sewer pipes which were inspected twice within 3 years using the German guidelines ATV-M 149 (Citation1999), where 0 was the worst condition and 4 was the best. This resulted in a nearly normal distribution of deviation with only 45% of the pipes being classified in the same CC twice, very similar to the data presented by Dirksen et al. (Citation2013) but lower than the 65% observed by Caradot, Rouault, et al. (Citation2018). Of these 45%, only 65% were able to also describe the same defects in both original and repeated inspection. This is in line with the findings of Dirksen et al. (Citation2013) that there was over a 50% probability to incorrectly recognise and describe defects with data acquired from Austria using EN 13508-2 (Citation2011). What is observable is that for this case study, the proportion of FPs is larger than FNs.
This study finds that there is a 10% probability of FN, whereas the probability of FP is 37.5%. This is not in accordance with the findings of Caradot, Rouault, et al. (Citation2018) which have found the proportion of FN to be significantly larger than FP. It is important to note that most of the literature has used repeated measurements within a period (mostly 3 years) and not the same video footage as base for the uncertainty assessment, which may include some more uncertainty. In this study the same footage has been used for both assessments, thus singling out the uncertainty arising from the interpretation of the footage (i.e. the human factor). The Norwegian coding system also differs significantly from the German coding system (ATV-M 143-2, Citation1999) used by Caradot, Rouault, et al. (Citation2018), which might also explain the difference in the observed rates of FNs and FPs. Furthermore, the sample size of this study is smaller (40 pipes), so it might be that this sample was dominated by the FP pipes in the population. This might explain why this study’s results differ from the literature.
3.2. Effect of the uncertainty on the model output
The plots in and illustrate the probability of a pipe with a certain age to be in a certain condition class or the respective boundaries between those probabilities, as predicted by GompitZ. During the calibration process it became apparent that no additional covariates were statistically significant for this case study. The line CC1/2 represents the boundaries for a pipe where below this threshold it is in CC1 and above in CC2 or worse and so on for the other condition states. The lines are stepwise due to the inherent quality of the model to use 5-year steps. shows the model results including the IFF, which accounts for the difference between model prediction and observation at the time of inspection, while shows the results of the marginal model. The Scenarios 1-4 account for the different uncertainty matrices (compare and ). Scenario 4 differs in the sense that only 3 CC were used and therefore only two curves are plotted. As those correspond to the curves between CC2/3 and CC3/4, they are shown in those colours. Uncertainty is represented as the area in corresponding colour to the lines, with the 5% and 95% percentiles as boundaries.
Figure 3. Condition probabilities of the calibrated GompitZ model with IFF and the corresponding uncertainty bands for the four defined scenarios.
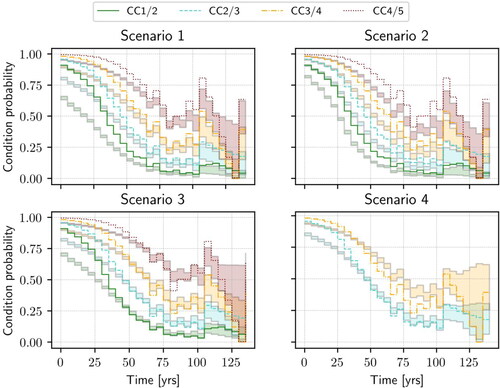
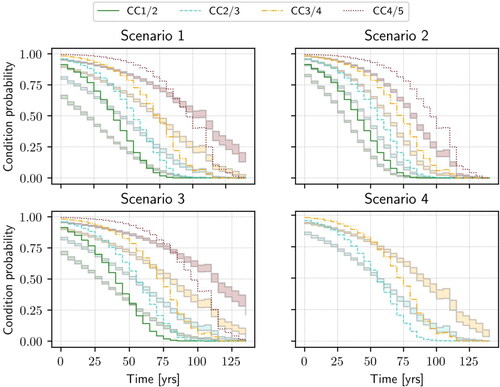
Figure 4. Condition probabilities of the calibrated marginal GompitZ model and the corresponding uncertainty bands for the four defined scenarios.
The general trend from the Monte Carlo analysis for the IFF model is that the uncertainty bands are quite narrow for the younger pipes and that they gradually get wider for the older pipes. This is most likely due to fewer existing older pipes, where a change in CC will have a higher impact. The marginal models on the other hand is more consistent in their uncertainty bands where the bound widths stay the same for most of pipe ages. Another prominent feature is the shift between the uncertainty bands and the model from the original data, which in consequence indicates that the original model is more of an outlier in most time periods. For the younger pipes up to about 50 years, the calibration results are relatively far away from the uncertainty bands. We can see for example for the model with IFF that the original model starts off for the age group of 0-5 years with condition probability between CC1 and CC2 of 0.91 for the different uncertainty scenarios that changes to 0.62 to 0.68 (scenario 1), 0.81 to 0.83 (scenario 2) and 0.69 to 0.72 (scenario 3). For scenario 1 this is logical due to the skewedness of the uncertainty matrix towards worse condition classes. For scenario 3 and 4 it cannot be explained by the uncertainty matrix alone.
However, as in the data set almost 50% of the pipes inspected were found to be in CC1(see ) the probability of them to worsen has a much higher impact on the outcome than the possibility of other condition classes being underrated. One possible explanation is the higher probability of younger pipes to be in CC1, that can be observed in the data. This led to the formulation of Scenario 2, which showed an effect in decreasing the shift between the uncertainty band and the original calibration result, as well as showing more similar aging properties of the curves, which is to be expected as it is formulated with an inherent age dependency. Still it did not eliminate the shift completely, due to the calibration, which poses the question if the existing model is too optimistic. This is in contrast to the observation of Caradot et al. (Citation2020), whose original model was mainly within the boundaries of its uncertainty bands. This may be caused by the difference in uncertainty propagation, i.e. including the uncertainty before the calibration (as done in this study) rather than applying it on the deterioration curves (e.g. Caradot et al., Citation2020), and the difference in data availability.
egarding the impact the uncertainty could have for practical situations, it is appropriate to evaluate what happens with CC4 and CC5 since these are the pipes that are subject to replacement or rehabilitation measures according to the recommendation from Norsk Vann Rapport 235 (Citation2018). It is important to note that these survival graphs represent the calibration results of the models and do not consider renewal rates of the sewer network. As most sewer utility managers have a certain pipe renewal rate each year and that they will use it to forecast the deterioration into the future, this assessment will not be realistic in that regard. However, it will show the trend of how the quantified uncertainty could influence practical situations for asset managers. We will therefore concentrate on the marginal model in to discuss this, as this would consider the not inspected pipes. According to the original model 50% of the pipes in this cohort would stay in CC1 until 35 to 40 years.
For the different uncertainty scenarios this changes considerably. For Scenario 1 it would only be 10 to 15 years, for Scenario 2 and 3 it would be 25 to 30. A similar picture can be seen when one considers how long 50% of the pipes are expected to be in a better condition than CC5, i.e. the threshold at which a sewer pipe would require immediate action. In the original model one could expect that to be 90 to 95 years, for Scenario 1 and 3 already 105 to 115 years, for Scenario 2 only 75 to 85 years. If we look at Scenario 4, 50% of the pipes would be better than CC2 until 50 to 55 years and better than CC4 until 70-75 years. Thus, if one had used the predictions from the models in Scenario 1 or 3 to make decisions about e.g. long-term budgets needed for pipe replacement, without considering the uncertainties, one would most likely grossly overestimate the ageing and consequently the future budgets needed to deal with CC5 pipes.
All but Scenario 2 present a similar behaviour, i.e. the uncertainties estimated in this case study are comparable and corroborated by the data from previous studies. Scenario 2, where it is assumed that the inspection data uncertainties are time-dependent, is the odd one out of all four scenarios in the marginal models, which indicates that the time-dependency assumption is quite a crucial assumption. For instance, for all other scenarios, one will be expected to overestimate the time until 50% of the pipes reaches CC5, while one for Scenario 2 will underestimate it. One can also observe that the uncertainty bands of the CC transitions in Scenario 2 are much steeper compared to the other scenarios, and thus that one with this assumption obtains a result where younger pipes are generally expected to be in better conditions, but that they deteriorate more quickly compared to the predictions in the other scenarios. The validity of the assumption that there is less uncertainty in the CCTV condition data for younger pipes is therefore very important, as it seems to influence the resulting rate of deterioration strongly, and more research should be conducted to verify or reject this assumption.
The abovementioned numbers do not say anything about how the quality of the model calibration, which showed convergence with all model parameters significant with p < 0.05 in the original calibration as well as in the subsequent calibration runs for the different scenarios, is affected by the uncertainty propagated in the input data. Nevertheless, the results highlight that the basis of decisions may be influenced heavily by the estimated uncertainties in the input data. Depending on which of the models is to be believed to represent the ‘real’ data set, the uncertainty could lead to large over- or underestimations of life-expectancies, inspection priorities, necessary rehabilitation rates and in consequence funds allocation.
4. Conclusions
In this study the uncertainty in Norwegian CCTV sewer inspection data has been quantified, and its consequent impact on sewer deterioration model predictions has been demonstrated. The study shows that the uncertainty in condition classes coded according to the Norwegian standards are considerable, and comparable to the uncertainties estimated for other European coding systems found in the literature. The impact of the uncertainties, when propagated in a condition deterioration model, were also found to be considerable, and the results demonstrate that the uncertainty in the model predictions can influence the strategic decisions one makes based upon these results strongly.
All scenarios that assumed that the CCTV data uncertainty was time-independent showed similar results, thus corroborating that the uncertainty using the Norwegian coding system is comparable to that of previous studies. However, the results from the scenario assuming time-dependent uncertainties (Scenario 2) produced results with a much more distinct ageing process. The practical implications of this finding are that one can risk either under- or overestimating the time until pipes reach a condition class which requires renewal action, depending on whether the assumption of time-dependency is true or false. Further studies therefore need to be undertaken to confirm or reject this assumption of time-dependent uncertainty in CCTV condition class data. This point also highlights that it is beneficial to assess how the calibration of the deterioration model is affected by the uncertainty in the calibration data, compared to propagating the uncertainty through an already calibrated model.
This study corroborates earlier research that points out the weaknesses of the CCTV inspection method to estimate sewer pipe conditions and in consequence model-based asset management plans. One of these weaknesses, the subjectivity of the inspector doing the condition assessment, may be improved by the usage of machine learning in the upcoming years (e.g. Meijer, Scholten, Clemens, & Knobbe, Citation2019). Still the uncertainties will stay considerable, as well as the need for researching those uncertainties, and the question arises if the method of using video footage for assessing condition of sewer pipes is appropriate for the task of making informed decisions on the need for replacing and rehabilitating sewers and the high investments connected to this or if measurements of physical qualities will be necessary (e.g. Lepot, Stanić, & Clemens, Citation2017).
Acknowledgements
The authors would like to thank François Clemens - Meyer, David Steffelbauer and Robert Meier for their input and the discussions during the writing process. We would also like to acknowledge the input of and good cooperation with Trondheim kommune, the operating company of the case study which provided the data for this study.
Disclosure statement
No potential conflict of interest was reported by the authors.
References
- Ahmadi, M., Cherqui, F., Aubin, J.-B., & Le Gauffre, P. (2016). Sewer asset management: impact of sample size and its characteristics on the calibration outcomes of a decision-making multivariate model. Urban Water Journal, 13(1), 41–56. doi:10.1080/1573062X.2015.1011668
- Ahmadi, M., Cherqui, F., De Massiac, J.-C., & Le Gauffre, P. (2015). Benefits of using basic, imprecise or uncertain data for elaborating sewer inspection programmes. Structure and Infrastructure Engineering, 11(3), 376–388. doi:10.1080/15732479.2014.887122
- Ahmadi, M., Cherqui, F., De Massiac, J.-C., & Le Gauffre, P. (2014). Influence of available data on sewer inspection program efficiency. Urban Water Journal, 11(8), 641–656. doi:10.1080/1573062X.2013.831910
- ATV-M 143-2 (1999). Optische Inspektion - Inspektion, Instandsetzung, Sanierung und Erneuerung von Abwasserkanälen und -leitungen (Merkblatt). Deutsche Vereinigung für Wasserwirtschaft, Hennef, Germany: Abwasser und Abfall e. V.
- ATV-M 149 (1999). Zustandserfassung, -klassifizierung und -bewertung von Entwässerungssystemen außerhalb von Gebäuden (Merkblatt). Deutsche Vereinigung für Wasserwirtschaft, Abwasser und Abfall e. V., Hennef, Germany.
- Bruaset, S. (2019). Long term sustainable asset management for water infrastructure (PhD). Trondheim, Norway: NTNU.
- Brüggemann, T. (2017). Länge und Wiederbeschaffungswert der Unterirdischen Infrastruktur in Deutschland und in der Europäischen Union (Length and replacement value of underground infrastructure in Germany and the European Union). Gelsenkirchen, Germany: IKT - Institut für Unterirdische Infrastruktur.
- Caradot, N., Riechel, M., Fesneau, M., Hernandez, N., Torres, A., Sonnenberg, H., … Rouault, P. (2018). Practical benchmarking of statistical and machine learning models for predicting the condition of sewer pipes in Berlin, Germany. Journal of Hydroinformatics, 20(5), 1131–1147. doi:10.2166/hydro.2018.217
- Caradot, N., Riechel, M., Rouault, P., Caradot, A., Lengemann, N., Eckert, E., … Cherqui, F. (2020). The influence of condition assessment uncertainties on sewer deterioration modelling. Structure and Infrastructure Engineering, 16(2), 287–296. doi:10.1080/15732479.2019.1653938
- Caradot, N., Rouault, P., Clemens, F., & Cherqui, F. (2018). Evaluation of uncertainties in sewer condition assessment. Structure and Infrastructure Engineering, 14(2), 264–273. doi:10.1080/15732479.2017.1356858
- Caradot, N., Sonnenberg, H., Kropp, I., Ringe, A., Denhez, S., Hartmann, A., & Rouault, P. (2017). The relevance of sewer deterioration modelling to support asset management strategies. Urban Water Journal, 14(10), 1007–1015. doi:10.1080/1573062X.2017.1325497
- Deletic, A., Dotto, C. B. S., McCarthy, D. T., Kleidorfer, M., Freni, G., Mannina, G., … Tait, S. (2012). Assessing uncertainties in urban drainage models. Physics and Chemistry of the Earth, Parts A/B/C, Estimating and Representing Uncertainty in Applied Hydrology, Hydraulics and Water Quality Studies, 42–44, 3–10. doi:10.1016/j.pce.2011.04.007
- Dirksen, J., Clemens, F. H. L. R., Korving, H., Cherqui, F., Le Gauffre, P., Ertl, T., … Snaterse, C.T.M. (2013). The consistency of visual sewer inspection data. Structure and Infrastructure Engineering, 9(3), 214–228. doi:10.1080/15732479.2010.541265
- Egger, C., Scheidegger, A., Reichert, P., & Maurer, M. (2013). Sewer deterioration modeling with condition data lacking historical records. Water Research, 47(17), 6762–6779. 10.1016/j.watres.2013.09.010.
- EN 13508-2 (2011). Investigation and assessment of drain and sewer systems outside buildings - Part 2: Visual inspection coding system (European Standard). Brussels, Belgium: European Comittee for Standardization.
- EN 752 (2008). Drain and sewer systems outside buildings (European Standard). Brussels, Belgium: European Committee for Standardization.
- Kley, G., Kropp, I., Schmidt, T., & Caradot, N. (2013). Review of technologies and methodologies for sewer condition evaluation (Deliverable No. 1.1). Berlin, Germany: SEMA..
- Laakso, T., Kokkonen, T., Mellin, I., & Vahala, R. (2018). Sewer condition prediction and analysis of explanatory factors. Water, 10(9), 1239. doi:10.3390/w10091239
- Le Gat, Y. (2008). Modelling the deterioration process of drainage pipelines. Urban Water Journal, 5(2), 97–106. doi:10.1080/15730620801939398
- Lea, J.D. (2011). Bootstrapping procedure to determine convergence in Monte Carlo simulations. Transportation Research Record: Journal of the Transportation Research Board, 2226(1), 127–134. doi:10.3141/2226-14
- Lepot, M., Stanić, N., & Clemens, F. H. L. R. (2017). A technology for sewer pipe inspection (Part 2): Experimental assessment of a new laser profiler for sewer defect detection and quantification. Automation in Construction, 73, 1–11. doi:10.1016/j.autcon.2016.10.010
- Malek Mohammadi, M., Najafi, M., Kaushal, V., Serajiantehrani, R., Salehabadi, N., Ashoori, T. (2019). Sewer Pipes Condition Prediction Models: A State-of-the-Art Review. Infrastructures, 4, 64. doi:10.3390/infrastructures4040064
- Mancuso, A., Compare, M., Salo, A., Zio, E., & Laakso, T. (2016). Risk-based optimization of pipe inspections in large underground networks with imprecise information. Reliability Engineering & System Safety, 152, 228–238. doi:10.1016/j.ress.2016.03.011
- Meijer, D., Scholten, L., Clemens, F., & Knobbe, A. (2019). A defect classification methodology for sewer image sets with convolutional neural networks. Automation in Construction, 104, 281–298. doi:10.1016/j.autcon.2019.04.013
- Müller, K.P. (2005). Strategien zur Zustandserfassung von Kanalisationen (Strategies for sewer condition assessment) (PhD). Aachen, Germany: RWTH Aachen.
- Norsk Vann Rapport 235. (2018). Dataflyt – Klassifisering av avløpsledninger. Hamar, Norway: Norsk Vann BA.
- NORVAR Rapport 150. (2007). Dataflyt – Klassifisering av avløpsledninger. Hamar, Norway: Norsk Vann BA.
- OECD. (2020). Financing water supply, sanitation and flood protection: challenges in EU member states and policy options. Paris, France: OECD Publishing.
- Plihal, H., Kuratko, A., Schmidt, B.-J., Hörandner, C., & Ertl, T. (2014). Innovative Methoden der Kanalinspektion zur Optimierung selektiver Betriebsstrategien (Innovative methods for sewer inspection to optimize selective operational strategies). BMLRT, Vienna, Austria: INNOKANIS.
- RIF. (2019). State of the Nation – Norges tilstand: Vannforsyning- og Avløppsanlegg. Oslo, Norway: Rådgivende Ingeniørers Forening.
- Robert, C., & Casella, G. (2010). Introducing Monte Carlo methods with R. New York, NY: Springer New York. doi:10.1007/978-1-4419-1576-4
- Roghani, B., Cherqui, F., Ahmadi, M., Le Gauffre, P., & Tabesh, M. (2019). Dealing with uncertainty in sewer condition assessment: Impact on inspection programs. Automation in Construction, 103, 117–126. doi:10.1016/j.autcon.2019.03.012
- Rokstad, M. M., & Ugarelli, R. M. (2015). Evaluating the role of deterioration models for condition assessment of sewers. Journal of Hydroinformatics, 17(5), 789–804. doi:10.2166/hydro.2015.122
- Rokstad, M. M., & Ugarelli, R. M. (2016). Improving the benefits of sewer condition deterioration modelling through information content analysis. Water Science and Technology: A Journal of the International Association on Water Pollution Research, 74(10), 2270–2279. 10.2166/wst.2016.419.
- Sousa, V., Ferreira, F. M., Meireles, I., Almeida, N., & Saldanha Matos, J. (2013). Comparison of the inspector and rating protocol uncertainty influence in the condition rating of sewers. Water Science and Technology: A Journal of the International Association on Water Pollution Research, 69(4), 862–867. doi:10.2166/wst.2013.764
- Sousa, V., Matos, J. P., & Matias, N. (2014). Evaluation of artificial intelligence tool performance and uncertainty for predicting sewer structural condition. Automation in Construction, 44, 84–91. doi:10.1016/j.autcon.2014.04.004
- SSB. (2021). Statistics Norway [WWW Document]. ssb.no. https://www.ssb.no/.
- Taillandier, F., Elachachi, S. M., & Bennabi, A. (2020). A decision-support framework to manage a sewer system considering uncertainties. Urban Water Journal, 17(4), 344–355. doi:10.1080/1573062X.2020.1781908
- Tscheikner-Gratl, F., Caradot, N., Cherqui, F., Leitão, J.P., Ahmadi, M., Langeveld, J. G., … Clemens, F. (2019). Sewer asset management – state of the art and research needs. Urban Water Journal, 16(9), 662–675. doi:10.1080/1573062X.2020.1713382
- United Nations. (2021). The United Nations world water development report 2021: Valuing water. Paris, France: UNESCO.
- van der Steen, A. J., Dirksen, J., & Clemens, F. H. L. R. (2014). Visual sewer inspection: detail of coding system versus data quality? Structure and Infrastructure Engineering, 10(11), 1385–1393. doi:10.1080/15732479.2013.816974
