
 ?Mathematical formulae have been encoded as MathML and are displayed in this HTML version using MathJax in order to improve their display. Uncheck the box to turn MathJax off. This feature requires Javascript. Click on a formula to zoom.
Abstract
About 80% of the observed damage in existing reinforced concrete structures is related to corrosion. Typical corrosion-associated phenomena that affect structural capacity concern: (i) cross-section and ductility reduction of steel, (ii) concrete cracking, (iii) concrete area reduction due to spalling and (iv) modification of the bond properties. A number of models have been presented in recent years addressing these issues. The paper presents a critical review of such models and their application to the analysis of corroded reinforced concrete members using nonlinear finite element analysis. The accuracy of different modelling approaches is assessed through comparison with experimental results on corroded beams subjected to monotonic and cyclic loading. Specimens showing different failure modes were selected, such as flexure, combined flexure-shear and bond failure. Sensitivity studies are performed in order to gain better understanding of the contribution of each degradation phenomenon. Finally, recommendations are given for reliable capacity assessment of existing concrete structures affected by corrosion.
1. Introduction
Most of existing structures, even if not located in particularly aggressive environments, suffer from carbonation and/or chloride attack over their life-span resulting in some level of corrosion. Field inspections on European bridge infrastructure report that 70% of observed deterioration is related to corrosion (Gehlen, Mayer, & Greve, Citation2012). Meanwhile, several experimental and theoretical studies have pointed out the detrimental effects of corrosion-induced deterioration on the structural capacity (Castel, François, & Arliguie, Citation2000; Rodriguez, Ortega, & Casal, Citation1997; Zandi, Kettil, & Lundgren, Citation2011), among others. However, the influence of corrosion is not always taken into account at ultimate limit state assessment, despite the fact that design codes require using updated material properties for verification of existing structures. Corrosion is typically regarded a durability issue that is limited to service life assessment based on critical chloride content and/or carbonation front penetration.
Several studies addressed corrosion initiation and propagation proposing diffusion models for carbonation, chloride penetration and steel area reduction from an electrochemical stand point (Osterminski & Schießl, Citation2012). The DuraCrete (200) project developed improved models for carbonation and chloride induced corrosion of uncracked concrete that were later incorporated in the fib Model Code for Service Life Design (fib Bulletin N°34, Citation2006). Regarding the propagation phase, the associated uncertainties and large number of model parameters have prevented so far reaching sound prediction capabilities for structural capacity assessment under exposed environment. A more direct approach suitable for existing structures is based on combining on-site characterization with mechanistic models derived from studies on degraded members. These studies usually consist of subjecting isolated specimens to natural or accelerated corrosion followed by load testing with the purpose of investigating: (i) cross-section reduction and stress-strain response of corroded reinforcing bars under uniform and concentrated (pitting) corrosion (Almusallam, Citation2001; Apostolopoulos & Papadakis, Citation2008; Cairns, Plizzari, Du, Law, & Franzoni, Citation2005; Kashani, Crewe, & Nicholas, Citation2013), establishing empirical relationships for yield and ductility reduction as a function of mass loss and mechanistic models for fatigue deterioration (Fernandez, Bairán, & Marí, Citation2016); (ii) cracking and spalling of concrete cover (Molina, Alonso, & Andrade, Citation1993; Morinaga, Citation1996; Vidal, Castel, & Francois, Citation2004), including time to cracking and spalling initiation, prediction of crack widths and reduction in the concrete compressive strength; (iii) bond properties of corroded reinforced concrete (RC) (Lundgren et al., Citation2012; Val, Stewart, & Melchers, Citation1998), addressing the bond capacity and slip at different levels of corrosion and the influence of bar diameter and concrete cover thickness.
Despite significant progress in the understanding of corrosion-induced degradation mechanisms, its effect on the global capacity of structural systems has remained an open question, which hinders a practical application to the assessment of existing structures. Recent studies have addressed experimentally the capacity of corroded members, such as beams and columns, and only a few proposed numerical models that could be applicable at the system level. Experimental tests on corroded flexure- and shear critical beams under monotonic loading have been reported by Rodriguez et al. (Citation1997), Castel et al. (Citation2000), Belletti et al. (2020) and Vecchi et al. (Citation2020), among others. Coronelli (Citation1998) tested beams with pull-out failure using a novel set up where portions of the bottom reinforcement were debonded from surrounding concrete. Cyclic tests on corroded columns have been recently carried out in the context of earthquake engineering (Celik et al., Citation2020; Meda, Mostosi, Rinaldi, & Riva, Citation2014).
In the case of nonlinear finite element analysis (NLFEA), the effects of corrosion can be accounted for through modification of the non-corroded material properties of steel, concrete and bond. A number of models have been proposed in the last decades following this approach. Nonlinear beam elements taking into account corrosion degradation of reinforcement and concrete in compression where presented (Biondini & Vergani, Citation2012; Afsar, Madandoust, & Kashani, Citation2018). However, these formulations neglected the effect of bond degradation and verifications were limited to beam and column experiments failing in flexure-compression. Coronelli and Gambarova (Citation2004) developed a membrane finite element (FE) which included most of the corrosion degradation effects, however bond and shear failure were not addressed. In Zandi et al. (Citation2011), who followed a similar approach to Coronelli and Gambarova (Citation2004), numerical results deviated for shear critical highly corroded specimens. Prestressed beams without shear reinforcement were addressed in Belleti et al. (Citation2020), who used a membrane element based on the modified PARC_CL crack model.
The paper presents an overview of the available models for corrosion-induced damage and their application to NLFEA of complex failures. Experiments on corroded and non-corroded beam specimens subjected to monotonic and cyclic loading were used as a benchmark. Models with varying levels of complexity were defined in order to gain better understanding of the contribution of each mechanism and its influence on the collapse load and mode. Finally, recommendations are given for reliable capacity assessment of existing structures affected by corrosion.
2. Models for corrosion-induced deterioration
2.1. Steel reinforcement
2.1.1. Uniform and local corrosion
Cross-section reduction of steel reinforcement is the most relevant effect of corrosion. It initiates once the passive layer around the reinforcement is destroyed by carbonation and/or chloride penetration, causing uniform and localized (pitting) corrosion (). Uniform corrosion can be directly accounted for in the analysis thorough reduction of the bar diameter as:
(1)
(1)
where dc is the corroded and do the initial bar diameter, and x the corrosion attack penetration. Attack penetration can be obtained either from direct measurements or estimated using analytical models for corrosion progression as a function of the current density.
Figure 1. Modelling schemes for uniform and pitting corrosion of single reinforcement bar (effective cross-section of the corroded bar equals to the shaded area).
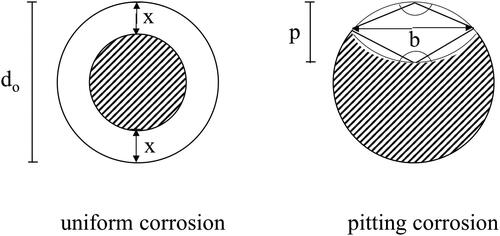
Pitting corrosion varies randomly along the reinforcement, forming at imperfections in the passive layer. It is quantified with a pitting factor, R, representing the ratio between maximum pit depth, p, and average corrosion penetration calculated indirectly from weight loss. Typical R values for naturally corroded specimens vary between 4 and 8, and between 5 and 13 for accelerated corrosion (Gonzalez, Andrade, Alonso, & Feliu, Citation1995). Some probabilistic models have been proposed addressing the effects of fatigue and spatial variability of pitting corrosion, predicting the maximum pit depth as a function of time of corrosion exposure, reinforcement bar diameter and bar length (Darmawan & Stewart, Citation2006; Ma, Guo, Wang, & Zhang, Citation2020). However, a reasonable assumption is to localize pitting corrosion at critical sections such as mid-span or supports regions. An expression for the pit area as a function of the maximum penetration depth has been proposed by Val and Melchers (Citation1997) assuming a hemispherical form:
(2)
(2)
where:
(3)
(3)
(4)
(4)
(5)
(5)
(6)
(6)
(7)
(7)
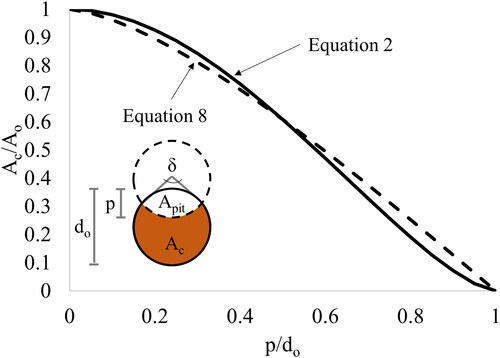
depicts the normalized corroded area (Ac/Ao where Ac = corroded area; Ao = uncorroded (virgin) area) as a function of the maximum penetration depth over initial diameter (p/do). EquationEquation (2)(2)
(2) is compared with a more straightforward equation and without significant loss of accuracy based on the overlapping area between two circles of diameter do penetrating an amount p given as:
(8)
(8)
(9)
(9)
Figure 2. Normalized rebar cross-section as a function of normalized pitting corrosion comparing EquationEquations (2)(2)
(2) and Equation(8)
(8)
(8) .
2.1.2. Mechanical properties of steel reinforcement
It is generally agreed that corrosion causes ductility reduction of steel, i.e. reduction in the tensile fracture strain. However, some experimental tests show that yield and maximum stress remain unaffected (Apostolopoulos & Papadakis, Citation2008). Theoretically, this corresponds to the case when corrosion is completely uniform. In the presence of pitting corrosion, however, there is a reduction in the yield and maximum stresses. Experimental observations suggest a linear relationship for strength and ductility reduction as follows:
(10a)
(10a)
(10b)
(10b)
(10c)
(10c)
where fyc, fy is the yield stress, fuc, fu the maximum stress and εuc, εu the ultimate strain of corroded and un-corroded steel, respectively. Qc is the percentage of cross-section loss. Suggested values for αy vary between 0.0 and 0.005, for αu between 0.0 and 0.007, referred to the mean corroded cross-section of the rebar, and for αε between 0.0 and 0.060 (Andrade, Alonso, Garcia, & Rodriguez, Citation1991; Apostolopoulos & Papadakis, Citation2008; Cairns et al., Citation2005; Du, Clark, & Chan, Citation2005; Kashani et al., Citation2013; Molina et al., Citation1993; Morinaga, Citation1996). This scatter may be attributed to differences in the experimental technique (e.g. gauge length), corrosion method and type (accelerated vs. natural, chloride vs. carbonation), type of steel and rebar diameter and type (smooth vs. deformed). Regarding the mode of failure, also different conclusions have been reported. In some cases yielding with ductility reduction was observed, whereas in others brittle fracture occurred after 20% section loss (Stewart & Al-Harthy, Citation2008).
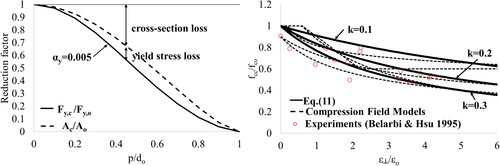
(left) presents the effect of pitting corrosion on the normalized tensile yield capacity (Fy,c/Fy,o where Fy,c = corroded yield stress × corroded area; Fy,o = uncorroded yield stress × uncorroded area) of reinforcement for different levels of normalized pit depth and αy values. Also shown is the cross-section reduction (Ac/Ao). Since pitting corrosion affects both cross-section and yield stress, the relationship between yield capacity and cross-section loss is quadratic. For normalized pit depths of less than 10%, the loss in yield capacity is relatively small, as well as the influence of αy. For larger pit depths, αy values greater than 0.005 lead to excessive loss of yield capacity when the corroded cross-section is used in the calculation. It is therefore suggested to use αy = 0.005 when the cross-section is explicitly reduced in the model. In this case, it can be seen that most of the contribution to the yield capacity loss is due to the cross-section reduction.
Figure 3. Normalized cross-section loss and normalized yield capacity calculated using the corroded area due to pitting corrosion (left), concrete compressive strength reduction due to corrosion cracking and comparison with compression field models (right).
Regarding the response of steel reinforcement in compression, recent studies have suggested a linear relationship between inelastic buckling stress of corroded rebars and uncorroded yield strength, identical to Equation (10) with αy = 0.005 calculated based on the average corroded cross section (Kashani et al., Citation2013). The monotonic post-buckling envelope was estimated using available analytical models with corroded rebar properties. Cyclic effects were investigated by Lavorato et al. (Citation2020), who considered the effect of corrosion on the free rebar length and adopted a variable αy coefficient linearly dependent on Qc.
2.2. Concrete
2.2.1. Compressive strength
Tensile strains orthogonal to the direction of principal compression can cause reduction in the compressive concrete strength. This phenomenon, known as compression softening, has been previously observed for members in biaxial stress conditions within the context of compression field models (Vecchio & Collins, Citation1986). Corrosion-induced expansion orthogonal to the compression field, e.g. cracks parallel to the compression reinforcement, can produce a similar effect, which has been also quantified as a function of the orthogonal tensile strain as (Coronelli & Gambarova, Citation2004):
(11)
(11)
(12)
(12)
where fcc and fco are the corroded and uncorroded compressive strengths, respectively, k is a factor related to bar diameter and roughness, εo is the strain at peak compressive stress, ε┴ is the smeared orthogonal tensile strain estimated as a function of the number of cracks, n, the average crack width for each bar, wcr, and the member width bo.
(right) compares EquationEquation (11)(11)
(11) with different expressions proposed in the context of compression field models (Belarbi & Hsu, Citation1995). A similar overall trend can be observed, with k between 0.1 and 0.3 covering most of the range. For k = 0.1, as proposed in (Coronelli & Gambarova, Citation2004) for medium-diameter ribbed bars, EquationEquation (11)
(11)
(11) yields less conservative reductions. It should be noted that in the case of corrosion, tensile strains occur in the circumferential direction due to internally restrained volume expansion, whereas compression field expressions were derived from biaxial panel testing (plane stress conditions) under direct monotonic loading.
2.2.2. Corrosion-induced crack width
The main challenge in EquationEquation (12)(12)
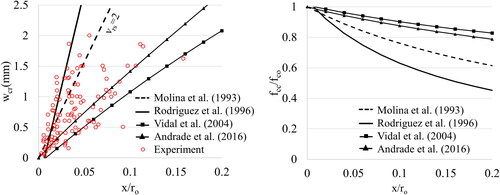
(12) , however, relies in the estimation of wcr, which depends on several factors such as corrosion rate and type of oxide products, concrete strength, concrete cover-to-bar diameter ratio and confinement. Different, usually linear, expressions have been proposed to quantify wcr as a function of corrosion penetration (Andrade, Cesetti, Mancini, & Tondolo, Citation2016; Molina et al., Citation1993; Rodriguez, Ortega, Casal, & Diez, Citation1996; Vidal et al., Citation2004) (). Most of these models take into account the concrete cover-to-bar diameter ratio, whereas only the model by Andrade et al. (Citation2016) and Rodriguez et al. (Citation1996) depend on concrete material properties. The expression proposed by Molina et al. (Citation1993) only depends on the ratio of volumetric expansion of oxides with respect to virgin materials, vrs, and takes the values of vrs = 1.7 for FeO and vrs = 6.15 for Fe(OH)33H2O. vrs = 3.4 has been suggested from experimental observations (Bhargava, Ghosh, Mori, & Ramanujam, Citation2006). A value of vrs = 2 has been commonly used for numerical analysis (Zandi et al., Citation2011).
Table 1. Summary of proposed crack width—corrosion attack relationships available in the literature.
(left) compares the proposed models with experimental data collected in Andrade et al. (Citation2016). The data corresponds to natural corrosion tests or accelerated tests with current densities <200 μA/cm2 and maximum crack opening of 2 mm. The model by Rodriguez et al. (Citation1996), which predicts the largest crack widths, is based on characteristic rather than mean values. The effect on the concrete compressive strength is shown in (right) assuming k = 0.1, n = 2, εo = 0.002 and bo = 1000 mm in EquationEquations (11)(11)
(11) and Equation(12)
(12)
(12) . For a corrosion penetration of 5% the uncorroded rebar radius, predicted crack widths vary between 0.5 and 2.5 mm. As a consequence, concrete compressive strength reductions range between 0.80 and 0.95.
Figure 4. Corrosion-induced crack width as a function of normalized corrosion penetration (left) and corrosion-induced compressive strength reduction according to EquationEquation (11)(11)
(11) (right).
2.3. Bond
Corrosion generates flaky rust products around the rebar that affect bond adhesion and friction with surrounding concrete. A number of empirical models have been proposed usually based on pull-out tests of corroded bars with different diameters, concrete cover and presence of transverse reinforcement (fib Bulletin N°10, Citation2000). It was shown that bond strength increases at early corrosion stages due to volume expansion and friction. Afterwards, a rapid loss of bond strength occurs until reaching a residual value which remains approximately constant ( (left)). The ratio between maximum corroded, τbmax,c, and uncorroded, τbmax,o, bond strengths in the degrading phase has been empirically quantified by several authors, usually as a function of the weight loss, Q:
(13)
(13)
Figure 5. Left: Reduction of bond strength between reinforcement and concrete (adapted from fib Bulletin N°10 (2000)) as a function of corrosion. Right: Comparison between used models for bond reduction, with r being the ratio between maximum bond strengths in corroded and non-corroded state.
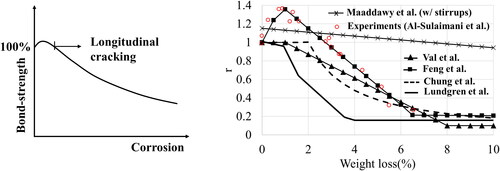
summarizes models reported in the literature (Chung, Cho, Kim, & Yi, Citation2004; Feng, Visintin, & Oehlers, Citation2016; Lundgren, Kettil, Zandi, Schlune, & San Roman, Citation2012; Maaddawy et al., Citation2005; Val et al., Citation1998) among others. The model by Val et al. (Citation1998) was based on pull out tests without stirrups, neglecting any bond reduction up to 1% weight loss. Chung et al. (Citation2004) provides the simplest formulation. The model was based on flexural tests on slab specimens with corroded reinforcement. Maaddawy, Soudki, and Topper (Citation2005) introduced the current intensity-dependent parameters based on test with confining stirrups. Lundgren et al. (Citation2012) proposed an expression based on interpolation of confined and unconfined bond-strengths according to Model Code 2010 taking into account the influence of stirrups and cover-to-diameter ratio. A plastic shift of the bond-slip envelope was introduced with respect to the uncorroded case equal to 8.1 times the corrosion penetration. The model by Feng et al. (Citation2016) used numerical analysis on a data base of 377 tests to quantify the effects on bond-strength and bond-slip.
Table 2. Bond strength reduction models for corroded reinforcement.
(right) displays the ratio between maximum corroded and non-corroded bond strengths as a function of the weight loss and the experimental results reported by Al-Sulaimani, Kaleemullah, Basunbul, and Rasheeduzafar (Citation1990). The confining effect of stirrups can be observed in the model by Maaddawy et al. (Citation2005) which provides significantly less reduction. Most of the proposed models neglect the initial increase in bond strength and only consider the degrading phase. The model by Lundgren et al. (Citation2012) quickly drops after reaching the weight loss corresponding to concrete cover cracking, since only the contribution of unconfined bond strength is taken into account in the case of no stirrups. Note that, with exception of Chung et al. (Citation2004), a constant residual bond strength in the range of 10%–20% is observed. Differences between models are mostly due to the experimental data used for calibration, which is affected by the test set-up, specimen geometry, and current densities applied to accelerate corrosion.
3. Finite element implementation
The previously presented damage models have been implemented into a 4-node membrane FE assuming small displacements and nonlinear material behavior. The constitutive model to represent the response of cracked concrete is based on an orthotropic, smeared-fixed-crack membrane model presented in (Kagermanov, Citation2019; Kagermanov & Ceresa, Citation2016, Citation2017) and modified here to account for corrosion-induced damage.
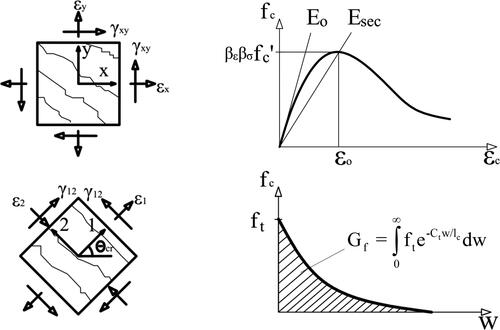
The state determination procedure is based on total strains in the crack directions, ε12, which are obtained from the local x-y strains at each integration point, εxy, as:
(14)
(14)
where T is the transformation matrix and θcr the crack orientation angle obtained at first cracking when the principal tensile stress exceeds the concrete cracking stress. This angle is kept constant throughout the analysis which induces shear stress components in the crack directions due to deviation of the latter from the principal strain directions ().
Figure 6. Left: membrane strain components in the x-y and 1-2 reference systems. Right: Constitutive laws for cracked concrete in compression and tension.
Additional cracks formed upon load reversal are assumed orthogonal to the first ones. Shear stresses, τ12, and strains, γ12, acting on the crack are related through the shear retention factor, β, as:
(15)
(15)
where Go is the elastic shear modulus. In the case of corroded transverse reinforcement, β is reduced proportionally to the cross-section loss. The maximum value of shear stress that can be transferred across the crack is limited by vci,max, which represents the aggregate interlock resistance. The empirical expression proposed by Vecchio and Collins (Citation1986) is used to estimate vci,max as a function of the total crack width, w, which accounts for mechanical and corrosion-induced strains:
(16)
(16)
where ag is maximum aggregate size. In the normal 1–2 directions, equivalent uniaxial laws are used to model the response in tension and compression. The compression envelope is given by the Popovics curve as:
(17)
(17)
where x = εc/εo, r = Eco/(Eco
Esec), Esec = fcc/εo, Eco is the initial tangent modulus.
This envelope is reduced in the presence of transverse tensile strains by the factor βε as discussed in section 2.2.1. In the case of confinement due to transverse compressive stresses, an increase of the envelope occurs which is quantified by the βσ factor:
(18)
(18)
where σ1 is the compressive stress in the orthogonal direction. The response in tension after cracking is given by the exponential decay curve shown in . Its rate of decay is controlled by the parameter Ct, which for the case of unreinforced or lightly RC elements can be related to the fracture energy, Gf, and characteristic element length, lc, as follows:
(19)
(19)
where ft is the effective tensile strength of concrete affected by corrosion.
For the case of RC elements, Ct accounts for smeared bond and reinforcement orientation effects with respect to the crack. The contribution of reinforcement both in tension and compression is superposed to that of concrete. Thus the total material stiffness matrix expressed in the x-y reference system is given as:
(20)
(20)
where Dcxy and Dsixy are the material stiffness matrices for concrete and steel, respectively, and ρsi the corroded reinforcement ratio of the ith reinforcement layer.
4. Application case studies
4.1. Flexure beams
Two beam specimens tested by Rodriguez et al. (Citation1997) were selected for analysis. The specimens consisted of simply supported rectangular RC beams loaded in 4-point bending. Beam B111 was non-corroded, whereas beam B116 was corroded by adding calcium chloride to the mixing water and subjecting the specimen to accelerated corrosion with a current density of 100μA/cm2 during a period 190 days. Afterwards the specimen was kept another 180 days under natural corrosion. Material and reinforcement properties are summarized in . Measured values of attack penetration for uniform and pitting corrosion are summarized in .
Table 3. Material and reinforcement properties of specimens B111 and B116.
Table 4. Measured values of attack penetration for uniform and pitting corrosion for B116.
Given the symmetry conditions, only half of the beam was modeled with 105 plane stress (membrane) FE elements (). Bottom flexural reinforcement was defined as discrete with nonlinear truss elements connected to concrete with interface bond elements. The backbone curve for these elements was based on CEB-FIP Model Code (1990) which specifies different parameters depending on confinement and bond conditions. The influence of corrosion was considered by reducing the maximum bond strength according to section 2.3 and assuming “all other bond conditions” (as opposed to “good bond conditions”) for corroded reinforcement, which affects the residual bond strength and the slip value s3. Note that bond strength enhancement due to clamping action at the supports is not considered. Top flexural and transverse reinforcement were defined as smeared with equivalent reinforcement ratios. Steel was modeled with a uniaxial bilinear material model.
Figure 7. FE Model of RC beam with corroded reinforcement: geometry and cross-section layout (in mm).
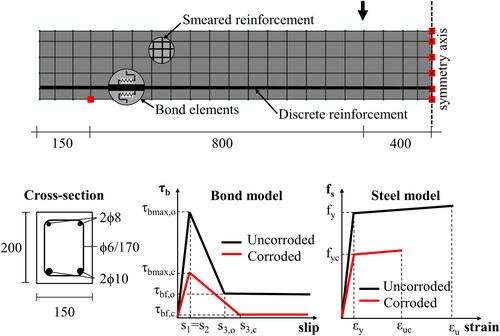
In order to quantify the contribution of each damage mechanism, models with increasing degree of complexity were defined. Modifications to the non-corroded FE model of beam B111 were successively introduced starting from uniform corrosion and adding the effects of pitting corrosion, yield strength reduction, etc. according to . Note that the yield strength reduction was applied to elements modeled with the mean corroded cross-section. The effect of pitting is therefore considered in the yield strength reduction. For the elements with pitting corrosion, assumed to be located at mid-span, the pit area was subtracted from the virgin area and the uncorroded yield strength was used. Additional discussion on the modelling approach adopted in is provided in section 4.3.
Table 5. Modelling variables: U: uniform corrosion, P: pitting corrosion, fy: yield strength, fc: concrete compressive strength, ft: concrete tensile strength, τb,c: bond strength.
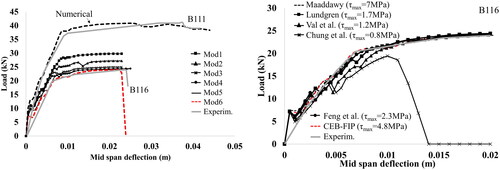
Load-deflection results are shown in (left). For the response of beam B111, the concrete tensile strength and initial tangent modulus were estimated as fct = 0.65fc0.33 and Ec = 5000fc0.5, which resulted in 2.4 MPa and 35.355 GPa, respectively. With these values better agreement was found in the crack-development phase. We observed that the curves gradually converge to the experimental response of the corroded beam B116. As expected for flexural failure due to yielding of bottom reinforcement, the maximum load is controlled by uniform and pitting corrosion and reduction in the yield strength. Reduction in the concrete strength has very little influence, and reduction in the bond strength no influence at all provided the failure mode does not change. Bond shows some influence in the post-cracking stiffness prior to initiation of yielding.
Figure 8. Left: Load deflection results for beams B111 (non-corroded reference beam) and B116 (corroded beam). Right: Sensitivity results for beam B116 comparing different models for degradation of bond between reinforcement and concrete under corrosion.
In Model 6 an additional modification was introduced, which consisted in reducing the tensile strength based on the corroded compressive strength. This last model showed the best overall agreement with the experiment. Given that failure is characterized by yielding of bottom longitudinal reinforcement, the displacement capacity is fully controlled by its fracture. Unfortunately, there was no data regarding the ultimate strain of uncorroded reinforcement. Hence, a value of 10% was assumed. The corroded ultimate strain was estimated according to EquationEquation (10c)(10c)
(10c) with αu = 0.017 (Andrade et al., Citation1991).
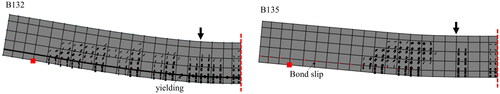
The results discussed so far used the CEB-FIP1990 bond model for unconfined concrete and all other bond conditions for the corroded member, which resulted in a maximum bond strength of 4.8 MPa. Values for the maximum corroded bond strength using expressions from section 2.3 were investigated next in (right) for beam B116. The maximum corroded bond strength ranged between 0.8 and 2.3 MPa for models without stirrup confinement and 7 MPa for the model by Maaddawy et al. which considers stirrup confinement. It can be seen that, as long as bond failure does not occur, the maximum capacity remains the same and only differences in the post-cracking stiffness are observed. If the bond strength is significantly reduced, such as by Chung et al., bond failure of the bottom flexural reinforcement occurs, resulting in an undesirable brittle failure at about 20% of the failure load at flexural yielding. Further discussion on bond models is provided in section 4.3. Crack patterns reported in show that a single vertical crack develops to the left of the applied load. Limited crack propagation occurs in the case of pull-out/splitting failure, whereas several vertical cracks develop in the case of flexural yielding failure.
Figure 9. Crack patterns in corroded beam B116 at flexural failure (left) and at bond-slip failure (right).
4.2. Shear beams
Beams B132 and B135 tested by Rodriguez et al. (Citation1997) were analyzed next. These beams failed in shear and shear combined with anchorage failure. The bottom tension reinforcement was replaced with 4ϕ12 rebars in order to increase the flexural strength, the rest of parameters being similar to beams B111 and B116. In addition, 50% of the bottom tension reinforcement was anchored outside the support zone in order to investigate lack of transverse confinement on the anchorage resistance. Material and reinforcement properties are summarized in . B132 was uncorroded, whereas B135 was kept 175 days under accelerated corrosion. The measured values of uniform and pitting corrosion are summarized in .
Table 6. Material and reinforcement properties of specimens B132 and B135.
Table 7. Measured values of attack penetration for uniform and pitting corrosion for B135.
The numerical model was similar to that used for beams B111 and B116, in which only half of the specimen was modeled due to symmetry. As before, models with increasing complexity were defined by sequentially introducing additional corrosion degradation mechanisms similarly to . Uniform corrosion of stirrups was modeled by reducing the transverse reinforcement ratio for all elements, whereas for pitting it was reduced locally for the elements located in the middle of the shear span. The concrete strength reduction was initially estimated based on Molina et al. with vrs = 2 (Mod5Equation(1)(1)
(1) in (left)). This model, however, overestimated the stiffness degradation. Hence the model by Vidal et al. was introduced (Mod5Equation(2)
(2)
(2) ), which provided less conservative reductions. Bond strength reduction was based on Chung et al. which resulted in a reduction coefficient of 14% for a weight loss of 12.5%. Note that this value is approximately the average among all the unconfined bond reduction models at this level of weight loss. For the confined bond model by Maaddawy et al. same results as those reported for Model 4 in were obtained, suggesting that, in this case, the effect of stirrup confinement on bond enhancement is negligible.
Figure 10. Left: Load deflection results for beams B132 (non-corroded reference beam) and B135 (corroded beam) including corrosion in the reinforcement. Right: Excluding corrosion in the reinforcement.
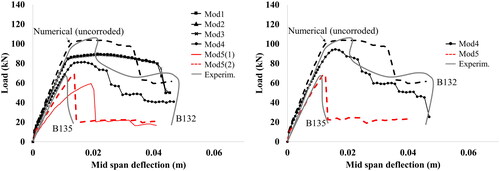
(left) compares numerical and experimental responses. B132 failed in combined flexure-shear after yielding of bottom longitudinal reinforcement. Shear mainly caused a reduction in the displacement capacity of the member. Good agreement was found in terms of initial stiffness and peak load. The displacement capacity of B135 was also adequately captured. The post-peak behavior of B132 was more challenging to capture given that softening occurs after yielding of bottom reinforcement. Models 1 to 3, in which steel related degradation was accounted for (uniform + pitting + yield strength reduction), were very similar, i.e. pitting and yield strength reduction had negligible contribution. Uniform corrosion was 12.5%, which reduced the capacity about 10%. These values are comparable to the flexure-controlled beams B111 and B112, in which the capacity reduction per unit uniform corrosion was also about 1%. From Models 4 and 5 it can be seen that concrete and bond strength have significant influence. Reduction in the concrete strength (both compressive/tensile and tangent modulus) reduces further the capacity, ductility and failure mode. The response is more brittle showing softening shortly after reaching the peak. Once bond degradation is introduced, capacity and ductility are significantly reduced, reaching a maximum capacity of 65 kN. The overall reduction with respect to the B132 is 35%.
In order to quantify the influence of steel related damage, the analyses were repeated using uncorroded properties for reinforcement. It can be observed from (right) that introducing corrosion-induced damage to concrete and bond only is enough to capture the response of B135.
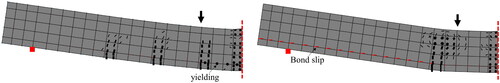
illustrates the crack patterns at failure. Several flexural cracks initiating at the bottom reinforcement as well as reinforcement yielding spreading towards the supports can be identified for B132. Note also diagonal shear cracking in the web region. For B135 bond slip and diagonal cracking approximately in the middle of the shear span govern the response.
Figure 11. Crack patterns of uncorroded beam B132 (left) and corroded beam B135 (right) at failure.
4.3. Modelling recommendations
The following modelling recommendations can be made based on the previous analyses of flexure and shear critical beams:
Uniform corrosion can be modelled directly either by reducing the cross-section diameter of the element, for the case of discrete reinforcement, or by reducing the reinforcement ratio, for the case of smeared reinforcement. The mechanical properties remain the same as those of the uncorroded rebar.
Modelling of pitting corrosion can be undertaken either implicitly, i.e. by reducing the mechanical properties according to section 2.1.2 while keeping the same diameter (or reinforcement ratio) as that of the uncorroded rebar, or explicitly, i.e. using elements with reduced cross-sections but unreduced mechanical properties. In the latter case, spatial variability of pits needs to be taken into account. Also, the influence of pit dimensions and the necessity of reducing the tensile fracture strain should be clarified. A simplified approach combining explicit modelling at critical sections and implicit modelling elsewhere was adopted herein. For the yield strength and ultimate strain reduction, αy = 0.005 and αu = 0.017 were adopted, respectively, which agreed well with the experimental data of beams.
Appropriate selection of corrosion penetration-crack width relationships should be further investigated. This can be decisive when the failure mode is sensitive to the concrete compressive strength, which is used to derive stiffness and tensile strength parameters. However, it does not affect bond strength since this is calculated based on the uncorroded compressive strength.
The present results also suggest that explicit modelling of concrete cover spalling by element removal is unnecessary since this is already considered in the reduction of the concrete compressive strength.
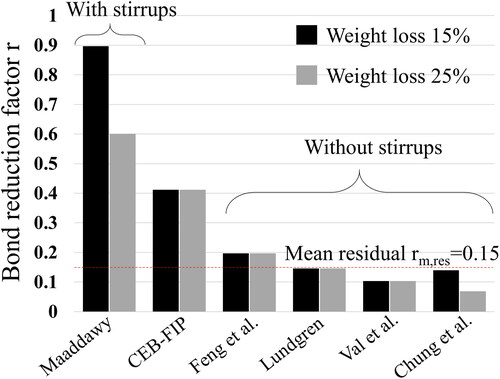
A simplified bond strength reduction consisting of using the CEB-FIP1990 bond model for “unconfined concrete” and “all other bond conditions” (as opposed to good bond conditions) was found sufficient for stiffness estimates in serviceability. However, this model does not depend on the level of corrosion (). More refined models are required to adequately capture corrosion-induced bond-failure. Among those investigated here, it can be concluded that a lower limit should be set on the bond-strength reduction in order to avoid unrealistic bond failures at large weight loss reductions, as it was the case of beam B116 when using the model by Chung et al. for a weight loss of 25% (). For the lower limit a value of rm,res = 0.15 is suggested as showed in .
The analyses performed here also showed that bond-reduction models derived from unconfined specimens (without stirrups) are more suitable for the analysis of lightly reinforced beams in shear, partly because more confinement reinforcement was provided to the tested specimens than to the present beams, which had 170mm stirrup spacing, 6mm rebar diameter and 90° end hooks. This should be, however, verified in future studies aimed at quantifying the level of confinement provided by largely spaced, corroded shear reinforcement.
Figure 12. Comparison of bond reduction models for corroded reinforcement for a weight loss of 15% (beam B132) and 25% (beam B116).
4.4. Contribution of corrosion-induced degradation mechanisms
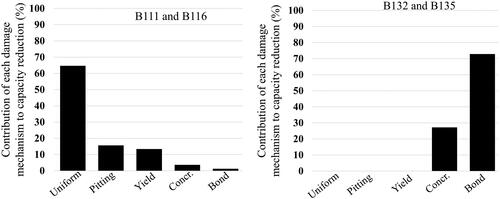
The contribution of each corrosion-induced degradation mechanism was quantified based on the analysis presented in and . Note that modifications were introduced incrementally starting from the last damaged model rather than from the original one, which may have some influence on the results. For the flexural beams B111 and B116 degradation of reinforcement (area and yield strength) amounts to 95% of the total load reduction. These mechanisms can be regarded as primary mechanisms. Secondary mechanisms would be in this case concrete compressive and tensile strength, and bond. For the shear critical beams B132 and B135 the results reported in (right) were used. Concrete related degradation contributes to about 30% of the capacity reduction, whereas bond to 70%.
It should be noted that beams B111 and B116 have low tensile reinforcement ratio, thus the compression concrete chord that balances the tensile force is small and the main corrosion parameters affecting failure are those related to the bottom reinforcement. Moreover, bottom reinforcement is well anchored and enhanced by the clamping action in the support area, making bond degradation as not critical. For beams B132 and B135 essentially the opposite happens. Higher tensile reinforcement ratio and deficient anchorage in the support area result in high sensitivity to the concrete compressive strength and bond degradation.
Results in suggest that as long as a ductile member continues behaving ductile despite corrosion, consideration of brittle sources of behavior can be neglected. Similarly, for initially brittle members, corrosion degradation of ductile sources will not significantly affect the capacity and modeling can focus on brittle sources only. In the case of potential switch or uncertainty regarding the dominant failure mode, detailed consideration of all corrosion-induced damage mechanisms is required.
Figure 13. Contribution of each corrosion-induced damage mechanism to capacity reduction for flexural beams (left) and shear critical beams (right).
4.5. Cyclic response of corroded shear beams
Five beam specimens tested by Ou, Tsai, and Chen (Citation2012) under reversed cyclic loading were analyzed (). The beams were fixed on one end and free on the other where the imposed displacement was applied. All specimens were equally reinforced with 5#5 (ϕ15.8 mm) reinforcing bars for the top and bottom longitudinal reinforcement and #3@10cm (ϕ9.5 mm) for the transverse reinforcement. The specimens were designed according to ACI 318 to fail in flexure, neglecting the concrete contribution to shear. Thus the nominal shear resistance due to transverse reinforcement was 281 kN, whereas the shear corresponding to the expected flexural strength was estimated as 127 kN.
Figure 14. Beam specimen geometry, reinforcement, FE-Model and applied drift in the numerical analysis.
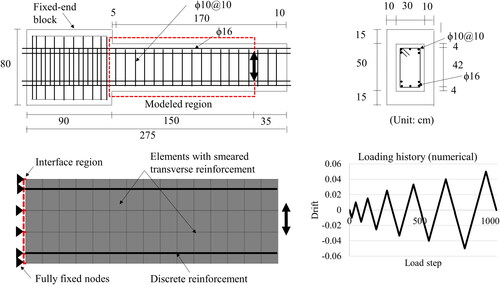
The plastic hinge region extending 50 cm from the fixed end was corroded in a water tank containing 5% NaCl under constant current of 0.25 A. Five levels of corrosion duration were applied 0, 12.5, 25, 50 and 150 days (). Non-uniform corrosion was observed in both longitudinal and transverse reinforcement. Corners of the transverse reinforcement exhibited larger pit corrosion. The theoretical weight loss predicted by the Faraday’s law (ΔwF) was significantly higher than the experimental one (Δwt). The efficiency factor (Ef), defined as the ratio between these two, varied between 0.45 and 0.12, decreasing with increasing corrosion duration. The average weight loss (Δw) was higher for the transverse reinforcement compared to the longitudinal one due to the smaller diameter of the former. A similar observation was made for the maximum corrosion pit depth (pmax) and the residual cross-section areas of reinforcement (At and Al) which reached maximum values of 3.14 mm and 8cm2, respectively.
Table 8. Values of corrosion characterization for corroded beams.
Only the region between the fixed end and the point of applied displacement was modeled. Shear as well as axial zero-length elements were included in the interface region accounting for sliding and strain penetration of the longitudinal reinforcement. The latter was modeled with discrete truss elements concentrated at the location of the top and bottom reinforcement. The transverse reinforcement was modeled as smeared within the plane-stress concrete elements. The reported concrete strength of the uncorroded specimen was 25 MPa and the yield strength of reinforcement 448 MPa.
summarizes the main inputs regarding uniform corrosion, pitting, reduction in the yield strength, concrete strength and bond strength. The reduction in the yield strength was calculated with αy = 0.005 and was only considered for the elements where pitting corrosion is not explicitly modelled. Elements with pitting corrosion were assigned an uncorroded yield strength. These were placed in the following critical locations: at the fixed end for the longitudinal reinforcement and in the middle of the plastic hinge region for the transverse reinforcement. The model from Molina et al. (Citation1993) with vrs = 2 was used for the estimation of crack widths and compressive strength reduction. For an average weight loss of less than 2% there is an increase in the bond strength. This effect, which was the case of specimens B-0, B-12.5 and B-25, was neglected. For specimens B-50 and B-150 bond strength reduction factors were 0.91 and 0.57, respectively, estimated according to Chung et al. (Citation2004).
Table 9. : Model input parameters for the corroded beams.
compares the experimental and numerical predictions in terms of force-drift response. In the experiment the applied drift was gradually increased from 0.25% to 6%, applying two cycles within each drift level. In the numerical analysis the applied drift history was simplified, neglecting small amplitude drifts and applying only one cycle within each drift level in order to reduce computational time and after noting that cyclic strength degradation was not significant before collapse. The specimens showed overall a flexural response with a stable plateau up to drift levels of approximately 4%. This was the case for all levels of corrosion between B-0 and B-50. After 4% drift strength degradation was observed due to concrete crushing, cover spalling and buckling of longitudinal reinforcement. For B-150 substantial strength degradation initiated at about 2% drift accompanied by fracture of transverse reinforcement. By 4% drift the specimen had lost more than 50% of its load carrying capacity.
Figure 15. Experimental and numerical load-drift responses of specimens B-0, B-12.5, B-25, B-50, B-150; local stress-strain response of longitudinal top and bottom bars for specimen B-150.
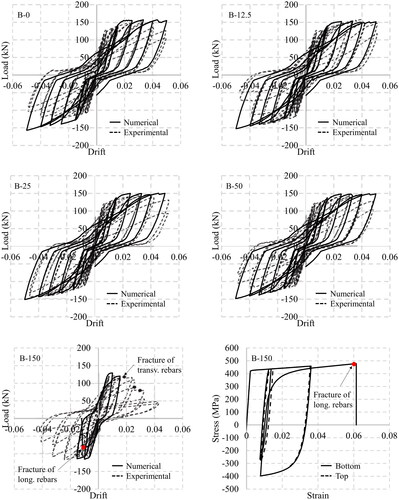
Numerical predictions were overall in good agreement with the experiments in terms of maximum strength, unloading/reloading stiffness and hysteretic pinching. Strength degradation at the onset of collapse was not accurately captured since secondary effects such as buckling of longitudinal reinforcement were not taken into account. Neglecting repeated cyclic loading within each drift level may have contributed as well. For specimen B-150, a reduced ultimate strain of steel due to corrosion was considered in the model, which was estimated as 4% according to EquationEquation 10(10a)
(10a) assuming an uncorroded value of 10%. In the simulation, fracture of longitudinal top rebar occurred at 1% drift, after which no further convergence was possible since the five rebars were modeled with one single truss element. Note that the responses of B-0 to B-50 are nearly identical, i.e. an average weight loss below approximately 2%–4% did not affect the response in this case. Note also that specimens B-0 to B-50 reached a flexural capacity of 150 kN, which is higher than 127 kN estimated in design using an expected yield strength of 1.25fy and a strength reduction factor of 1.0.
5. Conclusions
Local degradation models for corrosion-induced damage have been successfully implemented and applied to FE analysis of corroded beam members under monotonic and cyclic loading conditions. It should be noted that rather than forecasting corrosion initiation and propagation, these models use the corrosion attack penetration as the main input parameter. Hence, their application must be combined with either corrosion initiation and propagation models or site measurements of corroded reinforcement.
A number of local degradation models were selected from an extensive literature review and compared, showing differences regarding corrosion-induced bond degradation, crack width and compression softening. These differences were attributed to variability in testing conditions (loading and boundary conditions) as well as method of corrosion (natural or accelerated) and current intensity. Recommendations for appropriate model selection were given based on a limited number of numerical tests performed here and should be further verified with additional data. Investigations concerning spatial variability of pitting corrosion, the influence of corrosion penetration- crack width relationships on the capacity of brittle members, and the quantification of bond enhancement provided by corroded, largely spaced stirrups in relation to the application of unconfined bond models to members with transverse reinforcement, should be addressed in future studies.
Nevertheless, relatively accurate predictions were obtained for both flexure and shear critical members including combined modes of failure such as shear and bond failure. The numerical implementation into existing nonlinear FE programs featuring advanced computational models for cracked concrete is relatively straightforward, since most of the modifications concern model input parameters. Results for flexure-critical beams controlled by yielding of tensile reinforcement indicated that corrosion-induced degradation of reinforcement (cross-section and yield strength) amounts to 95% of the total strength reduction. These mechanisms can be regarded as primary mechanisms. Secondary mechanisms, such as reduction in the concrete compressive strength and bond, were found to have a smaller influence.
For shear/bond critical beams, concrete strength and bond were found as the primary mechanisms. Reinforcement degradation had negligible effect on the strength reduction. Under significant degradation secondary mechanisms can become dominant, producing a switch in the failure mode from ductile to brittle. Both primary and secondary mechanisms should be considered for adequate serviceability and ultimate limit state assessment in this case. Cyclic analysis of corroded squat beams designed to fail in flexure showed negligible influence of corrosion-induced damage up to an average weight loss of approximately 2% for longitudinal reinforcement and 4% for transverse reinforcement. Significant strength and energy dissipation reduction was observed for higher corrosion levels. Modelling cyclic strength and stiffness degradation and failure mode at these higher corrosion levels was found more challenging and should be addressed in future studies.
References
- Afsar, E., Madandoust, R., & Kashani, M. (2018). Modelling the effect of corrosion on failure modes of RC Columns subject to lateral seismic loading. 16th European Conference on Earthquake Engineering, 18–21 June, Thessaloniki, Greece.
- Almusallam, A. (2001). Effect of degree of corrosion on the properties of reinforcing steel bars. Construction and Building Materials, 15(8), 361–368. doi:10.1016/S0950-0618(01)00009-5
- Al-Sulaimani, G., Kaleemullah, M., Basunbul, I., & Rasheeduzafar, I. (1990). Influence of corrosion and cracking on bond behavior and strength of reinforced concrete members. ACI Structural Journal, 87(2), 220–231.
- Andrade, C., Alonso, C., Garcia, D., & Rodriguez, J. (1991). Remaining life time of reinforced concrete structures: Effect of corrosion on the mechanical properties of steel. In Life prediction of corrodible structures (pp. 12/1–1211). Cambridge, UK: NACE.
- Andrade, C., Cesetti, A., Mancini, G., & Tondolo, F. (2016). Estimating corrosion attack in reinforced concrete by means of crack opening. Structural Concrete, 17(4), 533–540. doi:10.1002/suco.201500114
- Apostolopoulos, C.A., & Papadakis, V.G. (2008). Consequences of steel corrosion on the ductility properties of reinforcement bar. Construction and Building Materials, 22(12), 2316–2324. doi:10.1016/j.conbuildmat.2007.10.006
- Belarbi, A., & Hsu, T. (1995). Constitutive laws of softened concrete in biaxial tension-compression. ACI Journal, 92(5), 562–573.
- Belletti, B., Vecchi, F., Bandini, C., Andrade, C., & Sanchez, J. (2020). Numerical evaluation of the corrosion effects in prestressed concrete beams without shear reinforcement. Structural Concrete, 21(4).
- Bhargava, K., Ghosh, A. K., Mori, Y., & Ramanujam, S. (2006). Model for cover cracking due to rebar corrosion in RC structures. Engineering Structures, 28(8), 1093–1109. doi:10.1016/j.engstruct.2005.11.014
- Biondini, F., & Vergani, M. (2012). Damage modeling and nonlinear analysis of concrete bridges under corrosion. In Bridge maintenance, safety, management, resilience and sustainability (pp. 941–947). London, UK: Routledge.
- Cairns, J., Plizzari, G.A., Du, Y., Law, D.W., & Franzoni, C. (2005). Mechanical properties of corrosion damaged reinforcement. ACI Material Journal, 102(4), 256–264.
- Castel, A., François, R., & Arliguie, G. (2000). Mechanical behavior of corroded reinforced concrete beams—Part 1: Experimental study of corroded beams. Materials and Structures, 33(9), 539–544. doi:10.1007/BF02480533
- Celik, A., Yalciner, H., Kumbasaroglu, A., & Ihsan Turan, A. (2020). Cyclic Loading Test on Highly Corroded Reinforced Concrete Columns. Proceedings of the fib CACRCS DAYS 2020 - Capacity Assessment of Corroded, 1-4 December 2020.
- Chung, L., Cho, S.-H., Kim, J.-H J., & Yi, S.T. (2004). Correction factor suggestion for ACI development length provisions based on flexural testing of RC slabs with various levels of corroded reinforcing bars. Engineering Structures, 26(8), 1013–1026. doi:10.1016/j.engstruct.2004.01.008
- Coronelli, D. (1998). Bar corrosion in steel-concrete bond: Material and structural effects in RC (Doctoral dissertation). Politecnico di Milano, Italy.
- Coronelli, D., & Gambarova, P. (2004). Structural assessment of corroded reinforced concrete beams: Modeling guidelines. Journal of Structural Engineering, 130(8), 1214–1224. doi:10.1061/(ASCE)0733-9445(2004)130:8(1214)
- Darmawan, M.S., & Stewart, M.G. (2006). Effect of spatially variable pitting corrosion on structural reliability of prestressed concrete bridge girders. Australian Journal of Structural Engineering, 6(2), 147–158. doi:10.1080/13287982.2006.11464951
- Du, Y.G., Clark, L.A., & Chan, A.H.C. (2005, April 3). Residual capacity of corroded reinforcing bars. Magazine of Concrete Research, 57, 135–147.
- DuraCrete. (2000). Probabilistic performance based durability design of concrete structures. Final Technical Report, Project BE95-1347, Document BE95-1347/R17. The European Union–Brite EuRam III.
- Feng, Q., Visintin, P., & Oehlers, D.J. (2016). Deterioration of bond–slip due to corrosion of steel reinforcement in reinforced concrete. Magazine of Concrete Research, 68(15), 768–781. doi:10.1680/jmacr.15.00217
- Fernandez, I., Bairán, J.M., & Marí, A. (2016). Mechanical model to evaluate steel reinforcement corrosion effects on s-e and fatigue curves. Experimental calibration and validation. Engineering Structures, 118, 320–333. doi:10.1016/j.engstruct.2016.03.055
- fib Bulletin N°10. (2000). Bond of reinforcement in concrete. State of the art report. Federation Internationale du Beton (fib), Lausanne, Switzerland.
- fib Bulletin N°34. (2006). Model code for serviceability life design. Federation International du Beton, Laussanne, Switzerland.
- Gehlen, C., Mayer, T. F., & Greve, S. (2012). Beton Kalender 2011: Lebensdauerbemessung. Hoboken, NJ: Ernst & Sohn.
- Gonzalez, J.A., Andrade, C., Alonso, C., & Feliu, S. (1995). Comparison of rates of general corrosion and maximum pitting penetration on concrete embedded steel reinforcement. Cement and Concrete Research, 25(2), 257–264. doi:10.1016/0008-8846(95)00006-2
- Kagermanov, A. (2019). Finite element analysis of shear failure of reinforced and prestressed concrete beams. Hormigón y Acero (ACHE), 70(287), 75–84.
- Kagermanov, A., & Ceresa, P. (2016). Physically-based cyclic tensile model for RC membrane elements. Journal of Structural Engineering, 142(12), 04016118. doi:10.1061/(ASCE)ST.1943-541X.0001590
- Kagermanov, A., & Ceresa, P. (2017). Fiber-section model with an exact shear strain distribution for RC frame elements. Journal of Structural Engineering, 143(10), 04017132. doi:10.1061/(ASCE)ST.1943-541X.0001839
- Kashani, M., Crewe, A., & Nicholas, A. (2013). Nonlinear stress–strain behaviour of corrosion-damaged reinforcing bars including inelastic buckling. Engineering Structures, 48, 417–429. doi:10.1016/j.engstruct.2012.09.034
- Lavorato, D., Fiorentino, G., Pelle, A., Rasulo, A., Bergami, A.V., Briseghella, B., & Nuti, C. (2020). A corrosion model for the interpretation of cyclic behavior of reinforced concrete sections. Structural Concrete, 21(5), 1732–1746.
- Lundgren, K., Kettil, P., Zandi, K., Schlune, H., & San Roman, A.S. (2012). Analytical Model for the Bond-Slip Behavior of Corroded Ribbed Reinforcement. Structure and Infrastructure Engineering, 8(2), 157–169. doi:10.1080/15732470903446993
- Ma, Y., Guo, Z., Wang, L., & Zhang, J. (2020). Probabilistic life prediction for reinforced concrete structures subjected to seasonal corrosion-fatigue damage. Journal of Structural Engineering, 146(7), 04020117. doi:10.1061/(ASCE)ST.1943-541X.0002666
- Maaddawy, T., Soudki, K., & Topper, T. (2005). Analytical model to predict nonlinear flexural behavior of corroded reinforced concrete beams. ACI Structural Journal, 102(4), 550–559.
- Meda, A., Mostosi, S., Rinaldi, Z., & Riva, P. (2014). Experimental evaluation of the corrosion influence on the cyclic behaviour of RC columns. Engineering Structures, 76, 112–123. doi:10.1016/j.engstruct.2014.06.043
- Molina, F.J., Alonso, C., & Andrade, C. (1993). Cover cracking as a function of rebar corrosion 2—Numerical model. Materials and Structures, 26(9), 532–548. doi:10.1007/BF02472864
- Morinaga, S. (1996). Remaining life of reinforced concrete structures after corrosion cracking. In C. Jostrom (Ed.), Durability of buildings materials and components (pp 127–137). London, UK: E&FN Spon.
- Osterminski, K., & Schießl, P. (2012). Design model for reinforcement corrosion. Structural Concrete, 13(3), 156–165. doi:10.1002/suco.201200003
- Ou, Y.-C., Tsai, L.-L., & Chen, H.-H. (2012). Cyclic performance of large-scale corroded reinforced concrete beams. Earthquake Engineering & Structural Dynamics, 41(4), 593–604. doi:10.1002/eqe.1145
- Rodriguez, J., Ortega, L.M., & Casal, J. (1997). Load carrying capacity of concrete structures with corroded reinforcement. Construction and Building Materials, 11(4), 239–248. doi:10.1016/S0950-0618(97)00043-3
- Rodriguez, J., Ortega, L.M., Casal, J., & Diez, J.M. (1996). Corrosion of reinforcement and service life of concrete structures. In C. Jostrom (Ed.), Durability of buildings materials and components (pp. 117–126). London, UK: E&FN Spon.
- Stewart, M.G., & Al-Harthy, A. (2008). Pitting corrosion and structural reliability of corroding RC structures: Experimental data and probabilistic analysis. Reliability Engineering & System Safety, 93(3), 373–382. doi:10.1016/j.ress.2006.12.013
- Val, D., Stewart, M.G., & Melchers, R.E. (1998). Effect of reinforcement corrosion on reliability of highway bridges. Engineering Structures, 20(11), 1010–1019. doi:10.1016/S0141-0296(97)00197-1
- Val, D.V., & Melchers, R.E. (1997). Reliability of deteriorating RC slab bridges. Journal of Structural Engineering, 123(12), 1638–1644. doi:10.1061/(ASCE)0733-9445(1997)123:12(1638)
- Vecchi F., Belletti B., Franceschini L., Andrade C., Rodriguez J., & Sánchez Montero J. (2020). Flexural Tests on Prestressed Beams Exposed to Natural Chloride Action. Proceedings of the fib CACRCS DAYS 2020-Capacity Assessment of Corroded, 1-4 December 2020.
- Vecchio, F., & Collins, M. (1986). The modified compression field theory for RC elements subjected to shear. ACI Journal, 9, 82–S22.
- Vidal, T., Castel, A., & Francois, R. (2004). Analyzing crack width to predict corrosion in reinforced concrete. Cement and Concrete Research, 34(1), 165–174. doi:10.1016/S0008-8846(03)00246-1
- Zandi, H.K., Kettil, P., & Lundgren, K. (2011). Analysis of mechanical behavior of corroded reinforced concrete structures. ACI Structural Journal, 108(5), 532–541.