
 ?Mathematical formulae have been encoded as MathML and are displayed in this HTML version using MathJax in order to improve their display. Uncheck the box to turn MathJax off. This feature requires Javascript. Click on a formula to zoom.
Abstract
Disaster resilient civil infrastructure systems are essential for disaster resilient communities. Measuring the resilience of these systems is the first step towards their improvement. This, however, is not easy: civil infrastructure systems are highly complex, operate in different ways, and are affected differently in different disasters. Adding to the complexity are the dynamic interdependencies among components of such systems, that change as the community is recovering. The Re-CoDeS framework for quantifying disaster resilience measures the lack of resilience of a system (e.g., a community) as the amount of the system’s unmet demand for a considered resource or service over the resilience assessment interval. This paper presents a novel demand/supply-based method to consider dynamic component interdependencies by extending the Re-CoDeS framework: whenever the demand of a component is not met by the currently available supply capacity of the system, that component ceases to operate and its supply capacity decreases. The proposed iRe-CoDeS framework is demonstrated on a virtual community served by three interdependent civil infrastructure systems producing five types of resources and services. Step-by-step instructions for defining a community model within the iRe-CoDeS framework are presented to facilitate the use of the proposed framework.
1. Introduction
The ability of civil infrastructure systems (CISs) to provide services during their lifetime is often challenged by extreme events, such as natural disasters, that can cause an abrupt decrease in their service-delivering performance. Increasing the disaster resilience of these systems is adopted by government agencies, owners, and infrastructure managers worldwide as the preferred strategy to improve the ability of communities to overcome disasters (Brunner & Giroux, Citation2009; OECD, Citation2019; PPD-8, 2011).
Community disaster resilience has to be quantified so that different strategies for its improvement can be compared and evaluated (McAllister et al., Citation2019). Researchers affiliated with the Multidisciplinary Centre for Earthquake Engineering Research (MCEER) proposed a framework to quantify seismic resilience of a community using a measure of community’s function provision over time after an earthquake (Bruneau et al., Citation2003). The so-called resilience triangle, tracing the loss and recovery of a community function over time, became an emblematic illustration of community resilience. Key community functions, such as provision of electric power, potable water and communications, are provided by interdependent CISs: thus, it is important to define and assess the performance of community’s CISs after a disaster, while viewing the community as a system of interdependent systems (Kröger, Citation2008).
This paper begins with a review of the state-of-the-art in quantification of disaster resilience of communities with interdependent CISs. Then, an extension of the Resilience – Compositional Demand/Supply (Re-CoDeS) quantification framework (Didier et al., Citation2015, Citation2018a, Citation2018b) that accounts for dynamic interdependencies among CISs, iRe-CoDeS, is presented. Finally, the iRe-CoDeS framework is used to quantify the disaster resilience of a virtual community with 3600 inhabitants who occupy the community building stock and are supplied by three interdependent CISs that produce five types of services and resources.
2. Quantification of community’s CIS disaster resilience
Based on the MCEER community resilience framework (Bruneau et al., Citation2003), various models and methods to quantify the disaster resilience of a community and its CISs have been proposed (Hosseini et al., Citation2016). Such models consider either the entire life-cycle of an infrastructure system, accounting for several disasters that can occur during the lifetime of the system (Yang & Frangopol, Citation2019), or the relatively shorter recovery period, spanning from several months to several years after a disaster. This study focuses on the latter. For example, Reed et al. (Citation2016) define the inoperability of a CIS as the ratio of the number of customer outages over the total number of customers following a weather-related disaster. He and Cha (Citation2020) use network performance measures, such as connectivity measures and efficiency metrics, to quantify the connectedness and flow efficiency of a CIS network and describe the operability of a CIS after a disaster.
Moslehi and Reddy (Citation2018) assess monetary losses to measure system’s performance and calculate the resilience index by comparing the actual monetary loss to the maximal possible monetary loss due to the inoperability of a system during the recovery period. Fang and Zio (Citation2019) define the performance of a CIS as the ratio between the satisfied demand and the required demand of all considered nodes (i.e., users). Sharma et al. (Citation2018) introduce the cumulative resilience function to describe the recovery process. Using concepts from probability theory, they draw an analogy between the cumulative distribution function and the cumulative resilience function and use the mean and the standard deviation of the cumulative resilience function to define the center of resilience and the resilience bandwidth. These two quantities measure system’s resilience and recovery dispersion, respectively.
In addition to measuring the performance of individual CISs during recovery after a disaster, defining and simulating interdependencies among CISs is another crucial part in assessing community disaster resilience. Dependency between two CISs is defined as “a linkage or connection between two infrastructures, through which the state of one infrastructure influences or is correlated to the state of the other” (Rinaldi et al., Citation2001). When such dependency is bidirectional, the two CISs are interdependent. However, in literature, the term interdependency is often used both for unidirectional and bidirectional dependencies between CISs (Rinaldi et al., Citation2001).
Kongar and Rossetto (Citation2015) classified interdependency modelling techniques into two categories: integrated and coupled. The main differences between the two are the level and the resolution at which interdependency is modelled. The integrated approach requires more input data, since the modelling is done at a low, CIS facility or component, level. Coupled techniques model the interdependencies at the CIS level, thus, requiring less data but also producing less accurate performance estimations. However, these categories are not necessarily exclusive: combining different levels of interdependency modelling is also possible (He & Cha, 2021). In fact, one of the biggest challenges in modelling the behavior of interdependent CISs is the trade-off between model complexity and computational efficiency. The model needs to be sufficiently detailed to capture the relevant phenomena, but the increase of model complexity can lead to implementation issues and high computational costs. Furthermore, the CIS data is often gathered from multiple sources, and needs to be available, up to date and accurate (Roohi et al., Citation2021). A comprehensive review of interdependency modelling techniques is presented in (Ouyang, Citation2014).
Even though there is progress in modelling interdependent CISs, important issues still need to be addressed to fully understand the recovery of such systems after a disaster. Some researchers propose coupling values, importance levels or conditional probabilities to describe the level of interdependency between two components (Guidotti et al., Citation2016; He & Cha, Citation2020; Johansen & Tien, Citation2018; Poljanšek et al., Citation2012; Wang et al., Citation2018). However, it is not always evident how to obtain specific coupling values or conditional probabilities. Disasters do not occur frequently, and when they do, data collection is usually not the first priority of the CIS operators or of the community. Therefore, post-disaster data is often scarce and unreliable. CISs are also unique systems: their topologies, operation, and components may vary significantly from one community to the other. Finally, CISs evolve over time: their components degrade and are renewed, while expansions are simultaneously implemented to meet new demands. Thus, generalizing from particular examples is not straightforward.
Using links connecting two components or nodes of different CIS models are another way to model interdependencies among CISs (e.g., Buldyrev et al., Citation2010; Kong & Simonović, Citation2019). These links are usually assumed to be static throughout the recovery period. However, interdependencies among components can change as the community is recovering. Yu and Baroud considered the dynamic and uncertain interdependencies among components of different CISs using stochastic block models (Yu & Baroud, Citation2020), where a CIS is modeled as a graph whose nodes are divided into blocks. The probability of an interdependency link between two components is defined on the block level, and hence, depends on the components’ block membership. Probability of forming an interdependency link between components from two blocks is defined using a linear combination of several parameters such as geographic proximity, physical connection and social vulnerability.
Viewing interdependencies between CISs as links between components, might not be sufficient to describe important phenomena occurring between interdependent CISs. For example, a user can be linked to a certain electric power generator, the supplier. The loss of functionality of this supplier does not, however, necessarily affect the user if there is a different power generator that can supply the user, or if a mobile power generator that can meet the demand of the user for electric power is readily available (Sun et al., Citation2021). In fact, a user requests a service or a resource, not a particular supplier. Additionally, if a user is inoperable (e.g., due to its own damage, damage to its supply chain, etc.) and cannot consume the resources or services provided by a certain supplier, the unused resources or services could be redirected to other users ready and able to consume them. Moreover, such assumptions often neglect that one supplier may meet the demand of several users, or that the demand of one user may be met by several suppliers.
3. Re-CoDeS community disaster resilience quantification framework
The CIS interdependency model presented in this paper is based on the Re-CoDeS community disaster resilience quantification framework (Didier et al., Citation2015, Citation2018a). The Re-CoDeS framework quantifies the lack of resilience (LoR) of a system as the amount of the unmet demand for the resource or service (R/S) the considered system is producing over time. Examples of a R/S are electric power, potable or cooling water and cellular communication. The number of R/Ss considered in a community disaster resilience assessment is n.
A system in the Re-CoDeS framework is defined as a set of components that exchange R/Ss according to the system’s R/S distribution model. Thus, a system can be a CIS, a subsystem of a CIS, a part of the community, or the entire community. A component is the lowest level of system discretization considered in the Re-CoDeS framework. With respect to R/Ss, a component can be a supplier (e.g., a solar power plant produces electric power, but does not demand any R/S from the system); be a user (e.g., inhabitants of a building stock unit demand electric power and potable water, but do not supply the system with any R/S); be both a supplier of one R/S and a user of other R/Ss (e.g., a water pump supplies potable water, but demands electric power and communication services to operate).
3.1. R/S Demand model
The amount of a R/S that a component needs to operate at time t is labelled
where I is the total number of components in the considered system. The system’s demand for a R/S at time t,
is the aggregate sum of all component demands in the considered system
(1)
(1)
Component demand for R/Ss changes over time: it might increase, decrease or stay the same. For example, a decrease in demand for electric power may occur after an earthquake because some building stock units are unoccupied due to damage. Similarly, certain CIS components may be damaged and not functioning, annulling their R/S demands until they are repaired. Examples of an increase in post-disaster demand are an increase in emergency calls taxing the Cellular Communication System (Didier et al., Citation2018); and an increase in water demand for firefighting (Scawthorn, Citation2020). Additionally, population relocation (e.g., to emergency shelters), resource conservation measures (e.g., potable water saving measures), and different daily and seasonal demand patterns (e.g., less water consumed during nighttime or in winter) can affect the demand for R/Ss.
3.2. R/S Supply capacity model
The system’s supply capacity, is the amount of a R/S produced at time t by the considered system. Similar to the system’s demand (EquationEquation (1)
(1)
(1) ), the system’s supply capacity for a R/S at time t is the sum of the supply capacities of all the components in the considered system
(2)
(2)
where
is the supply capacity of a component i
{1, …, I} supplying R/S at time t.
3.3. R/S Distribution model
To be consumed, R/Ss produced by the suppliers must be distributed to the users. However, system’s ability to distribute R/Ss may be diminished after a disaster. Damage to distribution networks, prioritization, conservation rules or safety measures can disturb or prevent R/S distribution. Leaks or breaks in pipes can cause transfer losses, while disconnected electric power transmission lines prevent electric power from reaching the users, even though electric power plants may still be operational. Lastly, R/S supply available to a certain component may also depend on its distribution priority: if a user has a high priority (e.g., a hospital), the available R/S supply may be dispatched to that component first, neglecting other components.
The R/S distribution model φR/S describes the transfer of R/S between components within a system. The amount of R/S available to a component i at time t is:
(3)
(3)
where I’ is the total number of components supplied before the considered component i. In fact,
depends on: the supply capacities of all components that can supply component i with the considered R/S at time t (
); the consumption of all components that have a higher priority than the considered component i, (
), that is, the amount of considered R/S consumed before it is allocated to component i; and the losses that occurred while transferring the R/S to other components before reaching the considered component i (
).
3.4. R/S Consumption model
The amount of R/S consumed by component i at time t is labeled It is the smaller of the component R/S demand
and the component R/S available supply
(4)
(4)
The system-level consumption of a R/S at time t is the sum of the R/S consumption of all of its components:
(5)
(5)
3.5. Component damage and recovery models
The damage state of a component evolves during the system resilience assessment interval where t0 is the beginning and tf is the end of resilience assessment interval. All components are assumed to be undamaged and fully functional at time t0 when a disaster happens. Damage states of each component immediately after the disaster are determined using component vulnerability functions, conditional probabilities that a component suffered a certain damage level conditioned on the intensity of the disaster at the location of the component. Such functions link the intensity of a disaster at the location of the component to its damage state. Components are repaired after a disaster at a certain repair rate, specific to each component. The recovery process is represented by a decrease of component damage state and a corresponding increase in component functionality, reflected in the evolution of demand, supply capacity and consumption of components during the system resilience assessment period. More details are available in (Didier, Citation2018).
3.6. R/S Lack of resilience quantification
Disaster resilience of a system is quantified by tracing the post-disaster evolution of the demand, supply capacity and consumption for a R/S within the system (). Lack of Resilience (LoR) is observed when the demand of a system for a R/S cannot be met by the available supply. Disaster resilience is quantified using an integral system-level measure of LoR defined as:
(6)
(6)
Figure 1. Lack of Resilience of a system as defined in the Re-CoDeS compositional demand supply capacity
and consumption
framework (Didier, Citation2018).
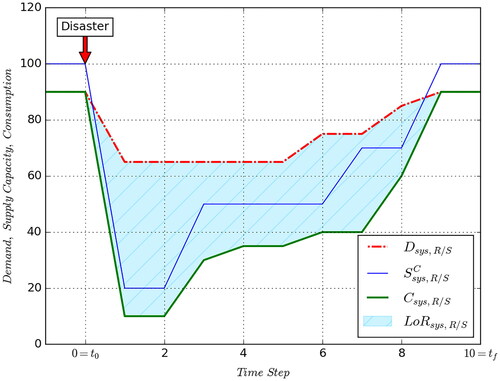
Note that neglecting the evolution in R/S demand reduces the Re-CoDeS LoR metric to a loss of supply capacity metric similar to the functionality metric proposed by MCEER (Bruneau et al., Citation2003). Ignoring the evolution of R/S demand simplifies disaster resilience quantification: the evolution of damage and repair of the R/S suppliers only is tracked. However, abstracting R/S demand from CIS resilience assessment may be misleading since the main purpose of such systems, to meet the current user demand for the R/S they produce, is not considered. For example, focusing solely on supply can lead to investing limited resources and services in recovering the system that, once recovered, serves little or no purpose as the users are not ready to consume the recovered supply capacity.
4. iRe-CoDeS extension of the Re-CoDeS framework
An extension of the Re-CoDeS framework, iRe-CoDeS, to enable disaster resilience quantification for a system-of-interdependent-systems (e.g., a community with interdependent CISs), is presented in this section. Re-CoDeS defines the demand of a component as a set of R/Ss that enable that component to operate. Component interdependencies are then simulated in iRe-CoDeS by extending the system R/S distribution model φR/S of the Re-CoDeS framework: whenever the demand of a component is not met during the distribution of an R/S simulated in the R/S distribution model, the component ceases to operate and perform its role in the considered system, reflected in the decrease of its supply capacity. Thus, the primary novelty of the iRe-CoDeS framework, compared to the Re-CoDeS framework, is in extending the system R/S distribution model to capture interdependency effects. Therefore, iRe-CoDeS is a disaster resilience quantification framework that views a system-of-interdependent-systems as an assembly of components whose ability to operate is constrained by their interdependencies, simulated as a flow of resources and services among components using a demand/supply-based approach.
Compared to the state-of-the-art in simulating interdependency among CISs and their components presented earlier, the proposed demand/supply approach for simulating interdependency effects has several advantages. Instead of using a one-to-one relation, interdependencies between components in iRe-CoDeS are modelled using their resource and service demands, as well as the CIS component and network damage levels and distribution capabilities. Component’s demand for an R/S can be met by any single supplier, or even by multiple suppliers, as long as the CIS can facilitate such service distribution. Therefore, interdependencies are dynamic, not static, making it possible to consider changes in interdependency relations between components over time. Furthermore, the values used to capture components’ interdependencies represent their supply and demand for various R/Ss, which can be obtained by observing the functionality of a community and its CISs during normal (i.e., disaster-free) operations.
This increases the reliability of the information used to define the iRe-CoDeS model and capture component’s interdependency, as the reliance on information gathered during and after disasters, which is often scarce and unreliable, is reduced. Loss of component’s operation caused by interdependency effects can result in further cascading effects throughout interdependent systems (i.e., interdependency loops). The proposed demand/supply-based method to capture components’ interdependencies is particularly suitable to simulate such events. In the iRe-CoDeS framework this is done by repeating the distribution of R/Ss within a time step of the resilience assessment interval until the system reaches a stable state, ensuring that all potential interdependency loops are captured. Lastly, the effects of components’ interdependency on community disaster resilience can be clearly quantified as the loss in system’s R/Ss supply capacities caused by interdependency effects (Didier et al., Citation2018b), illustrated in the case study presented later in this paper. The main elements of iRe-CoDeS are presented next, together with the extended notions of R/Ss, components, localities, and the demand/supply-based dynamic interdependency model.
4.1. Resources and services (R/Ss)
iRe-CoDeS refines the Re-CoDeS notion of a R/S by further classifying it into a utility or a transfer service. Utilities represent R/Ss supplied by CISs, while transfer services enable the transfer of these utilities from a supplier to a user.
4.2. Components, localities and links
As in Re-CoDeS, a component is the lowest level of system discretization considered in the iRe-CoDeS framework. Each component is characterized by its state, comprising its instantaneous demand, supply capacity and consumption values for each R/S, as well as its instantaneous damage and functionality levels. A component can supply and demand none, one or several R/Ss. Some components need utility R/Ss to operate. If the transfer of a utility from a supplier to a user requires a distribution network, the demand for the corresponding transfer service is assigned to the user component. Therefore, instantaneous component demand values include the amounts of utility R/Ss a component needs to operate and the amounts of transfer services needed to deliver utility R/Ss from a supplier to the component.
Component instantaneous R/S supply capacity, demand and consumption are affected by its current damage and functionality levels. Component damage level quantifies the damage state of a component throughout the resilience assessment interval and takes values ranging from 0 (no damage) to 1 (complete damage). As in Re-CoDeS, a component damage level is set immediately after a disaster using that component’s vulnerability function, and is decreased during recovery at that component’s repair rate. Component functionality level describes how much of the component’s function has been lost due to damage and recovered due to repairs after a disaster. Functionality level of a component varies between 0 (no functionality) to 1 (full functionality).
The relation between component’s damage and its functionality level are defined using functions. For example, a component with a binary damage-functionality function has a functionality level of 1 if the damage level is 0, and a functionality level of 0 otherwise. Functionality level of a component with a linear damage-functionality function increases linearly as its damage level decreases due to repairs. Other component behavior types can be constructed in iRe-CoDeS by defining the above-stated functions as needed. The iRe-CoDeS framework presented herein calculates the instantaneous supply capacity of a component as the product of its current functionality level and its supply capacity at full functionality, accounting for the drop in the supply capacity due to component damage. Meanwhile, component demand is kept at its pre-disaster level as long as the functionality level is non-zero, otherwise, the demand is set to zero.
The relation between the availability of R/Ss a component needs to operate and its ability to supply R/Ss also needs to be defined: this is where the main aspect of component interdependency is captured. A simple relation is assumed in the presented iRe-CoDeS framework: a component ceases to operate if any of the R/Ss it needs to operate are not available, reducing its R/S supply capacity to zero. Therefore, for a component to operate at its current (non-zero) functionality level, all its R/S demands must be met in full. More complex interdependency relations can be implemented as needed.
A locality is a geographically localized unit that may contain none, one or more components. A link is a component that provides a transfer service for a utility between two localities. Two localities can be linked by none, one or several links. A component in a locality can be an element of a facility (e.g., a power generator), a facility (e.g., an electric power plant or a building occupied by its inhabitants), or an assembly of facilities and buildings (e.g., a city). The transfer of utilities inside a locality is unconstrained, i.e., the links inside a locality are abstracted. A neighborhood is an example when such abstraction may be justified if the considered system is an entire city. The scope of a locality depends on the desired level of spatial discretization of the system. At the highest level of discretization, each component is in a separate locality, connected using links. On the other hand, at the lowest level of discretization all components are in a single locality.
Links are components and behave in the same way: increase of link damage leads to a decrease of link functionality level that leads to a decrease in transfer service supply capacity of that link. Some links may need utility R/Ss to function. For example, a tunnel needs electric power for lights and ventilation to function in a transportation system. In the presented iRe-CoDeS framework, functionality of a link may be pre-conditioned by functionality of a link carrier, e.g., a bridge carrying water pipes and electricity cables. This functional dependency between the carrier and the carried link is modelled using the demand/supply approach, too. Specifically, a bridge provides carrier service to the links on the bridge. When damaged, the functionality level of a bridge is decreased, reducing its supply capacity for carrier services.
4.3. Implementing the iRe-CoDeS system R/S distribution model
Different types of R/Ss are distributed using different methods. In the presented version of iRe-CoDeS, transfer services are distributed by employing optimal path algorithms that identify transfer paths between localities to maximize the ability of the systems to transfer R/Ss with respect to the available transfer service supply capacities of links. Utilities are distributed among components following the R/S distribution algorithm presented next, the main element of which is the System Matrix.
4.4. System matrix
The System Matrix contains the state information for all system components, one row per component. It is used to track the changes of the component states and the dynamics of the system R/S distributions in each time step of the resilience assessment interval. The structure of the System Matrix is used to increase the computational efficiency of interdependency modelling and LoR evaluation by vectorizing. An illustrative example presented in the Appendix I shows a System Matrix of a simple five-component community (Figure A1 and Table A1).
4.5. Utility R/S distribution algorithm
Once damage and functionality levels of components are set at the beginning of each time step of the resilience assessment interval, the task of distributing the available transfer services and utility R/Ss among the system components begins, one R/S at a time. When utility R/Ss are distributed, the components (i.e., the rows of the System Matrix) are ordered in decreasing priority for the utility R/S being distributed first, following the system R/S distribution model (Equation (3)). Starting at the top of the R/S distribution priority list, an attempt is made to satisfy the demand of each component for the distributed R/S using the supply of that R/S from any one or more of the identified suppliers that have a higher priority than the considered component (i.e., are in rows above the component in the System Matrix). If the supply available to the component is higher or equal than its demand, the component consumes the R/S it needs in full, and contributes to the system-level consumption of the distributed R/S calculated using EquationEquation (5)
(5)
(5) . However, if this is not the case, the component does not consume the R/S and ceases to operate, thus, the supply capacity of the component is set to zero, simulating interdependency effects. This process is repeated until the end of the R/S distribution list (i.e., the R/S distribution vector (RSDV) from Appendix I).
The amount of supply available to the component depends on the state of the R/S distribution networks after a disaster. Therefore, the transfer service demand of a component related to the transfer of the considered utility R/Ss is compared to the transfer service supply capacity of the optimal path, consisting of one or several links, connecting the component and the supplier. If the transfer service demand of such a utility R/S transfer is lower than the transfer service supply capacity, the utility R/S is transferred and the component consumes the utility R/S and continues to operate. Otherwise, the supply available to the component is set to zero and the component ceases to operate, simulating interdependency effects. The link damage and functionality states are accounted for, for example, to prevent distribution of EP due to a fault in the Electric Power Transmission System (EPTS), or to reduce the amount of PW transmitted due to leaks and breaks in the pipes of the Water Supply System (WSS). The topology of the link network as well as the R/S flow laws are taken into account to find paths between R/S suppliers and users. Different measures of path optimality can be used to assess the paths, such as the path length or the amount of transfer losses accumulated along the path in the presented iRe-CoDeS framework. An example sequence of distributions of utility R/Ss in a five-component community (Figure A1) immediately after disaster-induced damage (Table A1) is shown in Figure A2.
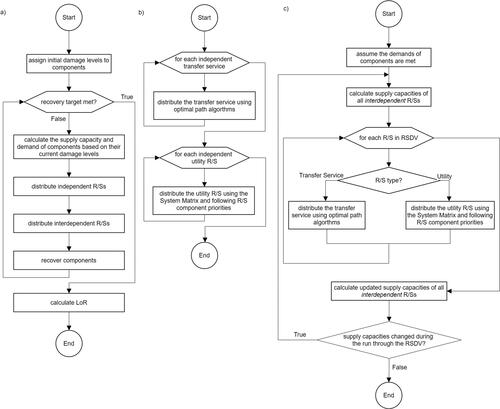
Figure 2. iRe-CoDeS algorithm to quantify community disaster resilience (a); the “distribute independent R/Ss” step of the iRe-CoDeS algorithm (b); and the demand/supply-based interdependency modelling algorithm (c) imbedded in the “distribute interdependent R/Ss” step of the iRe-CoDeS community resilience assessment algorithm (a).
4.6. Demand/supply-based interdependency modelling
Interdependency among components is modeled using component R/S demands (R/Ss needed for its operation) that are supplied by components belonging to various community systems (i.e., CISs). In the presented iRe-CoDeS framework, it is assumed that a component ceases to operate if its demands for R/Ss required for its operation are not met in full, regardless of its own damage. Consequently, the supply capacities of such components are set to zero.
Loss of operation due to interdependency, not due to direct damage, may lead to inoperability of other components, causing an interdependency loop among components. Such loops are accounted for in the presented iRe-CoDeS framework by repeatedly distributing R/Ss among components inside a time step of the LoR assessment until the system reaches a stable state, as explained later in this section. To efficiently allocate computational time for such repeated R/S distributions it is necessary to identify interdependent R/Ss – those R/Ss whose total supply capacity can change during interdependency modelling. In this way, computational time is saved by not repeating R/S distributions that cannot affect the total supply capacities of other R/Ss. For example, electric power (EP) is an interdependent R/S, if the suppliers of EP, the electric power plants (EPPs), demand other R/Ss to operate. Hence, when these demands are not met, the EP supply capacity will change, increasing the LoR and potentially causing further interdependency loops. An example of an independent (i.e., a non-interdependent) R/S is the potable water transfer service, since the pipes supplying this service do not demand other R/Ss to operate. Therefore, the potable water pipe supply capacity cannot change due to interdependency effects. Thus, independent R/Ss are distributed only once in a time step of LoR assessment.
Two assumptions are made in the presented iRe-CoDeS framework to efficiently account for interdependency feedback loops in a LoR assessment time step (Hefti, Citation2019; Henken, Citation2019). First, the effect of interdependency loops is considered only in terms of R/S supply capacity, not R/S demand. This ensures that, in a LoR assessment time step, the supply capacity can only decrease while the demand cannot change due to interdependency effects. Therefore, even though the supply capacities of a component are set to zero when its demand for a certain R/S is not met, the R/S demands of the component remain in the System Matrix and in the LoR assessment for that LoR assessment time step. As components can have demands for multiple R/Ss, this assumption allows the components inoperable due to the unmet demand for one R/S to consume other R/Ss, potentially reducing the supply available to lower-priority components. In effect, the sensing capabilities of the system are assumed to be slower than the length of the LoR assessment time step. This assumption resolves the causality present in an interdependency loop. Specifically, for a component that needs several different R/Ss to operate, determining which unmet R/S demand triggered the interdependency loop requires an algorithm that does not depend on the order of R/S demand checking. Such an interdependency modelling algorithm is explained later in this section. Second, the interdependency loop is confined to a time step of the community LoR assessment interval. Thus, inoperability of components due to an interdependency loop occurring in a time step does not cause inoperability of components in the next time step. Instead, the interdependency loop is examined anew in each LoR assessment time step.
These two assumptions make it possible to model the interdependencies among components of different CISs, as presented by the interdependency modelling algorithm in . At the beginning of each time step of community LoR assessment it is assumed that the reduction of supply capacity and demand of a component is due only to its damage state (i.e., the drop in the functionality level) as it stands in the recovery process, not due to the unmet demand for one or more R/Ss it needs to operate. Therefore, it is assumed that all demands of a component are met and that further R/S distributions can only decrease the supply capacity of the system. Then, the total supply capacities of the system for each interdependent R/S are calculated. They serve to identify when the demand/supply-based interdependency modeling algorithm terminates (i.e., when the system reaches a stable state), by comparing the total supply capacities before and after distributing interdependent R/Ss as described in the next paragraph.
The R/S distribution sequence (RSDS) defines the order in which the interdependent R/Ss are distributed. The length of this sequence is equal to the number of considered interdependent R/Ss. The R/S distribution process starts with the first interdependent R/S, following the order defined in the RSDS. If the demand of a component for that R/S is not met during this distribution process (e.g., all the available R/S quantities are distributed to higher-priority components), that component ceases operation and its supply capacity is set to zero, while its R/S demands remain unchanged. The R/S distribution process continues with the next R/S in the RSDS, accounting for the changes in the supply capacities of the components examined previously, until the last R/S in the RSDS is distributed. If the R/S is a utility, R/S distribution is performed using the System Matrix and the R/S distribution algorithm. If the R/S is a transfer service, the R/S distribution is performed using optimal path algorithms ().
However, the order in which R/Ss are distributed, defined in the RSDS, is arbitrary. One pass through the RSDS does not capture all possible permutations of the R/S distribution order. This, in turn, means that some of the interdependency loop triggers may be missed. To account for this, the RSDS is performed times in a row, defining a R/S distribution vector (RSDV), where
is the length of the RSDV using the same RSDS and starting always from the state of the community systems attained at the end of the previous R/S distribution (Hefti, Citation2019). It can be shown by induction that such a concatenation of RSDSs into an
-long sequence accounts for all possible permutations of the R/S distribution order in each time step of the resilience assessment interval. Once R/Ss are distributed according to the RSDV, the total supply capacities are calculated once again, and they are compared to the total supply capacities before the R/S distributions defined in the RSDV. When two consecutive RSDV runs result in the same total supply capacities of all interdependent R/Ss, the demand/supply-based interdependency modelling algorithm stops: the system reached a stable state (i.e., a run through an RSDV, where all the possible ways in which R/Ss can affect each other are considered, does not change the total supply capacities).
Compared to the original Re-CoDeS framework, iRe-CoDeS requires at least more R/S distributions at each time step of the LoR assessment interval to simulate the interdependency effects, increasing the computational effort. Figure A2 in Appendix I illustrates the application of the proposed demand/supply-based interdependency modelling algorithm in a resilience assessment of a simple five-component community.
4.7. iRe-CoDeS resilience assessment algorithm
The algorithm for quantifying the post-disaster LoR of a system-of-interdependent-systems is shown in . The inputs are system properties (component properties and system topology) and the initial damage levels of the components induced by a disaster. The recovery process is then simulated in a time-stepping loop by decreasing component damage according to its repair rate. Each time step of the LoR assessment involves calculating the current supply capacity and demand of all components based on their current damage levels, distributing independent R/Ss to calculate their consumption, distributing interdependent R/Ss and simulating interdependency effects (as explained in the previous section), and, finally, recovering the components by decreasing their damage level by their repair rate. The distribution of transfer services (i.e., identifying optimal paths between localities) is done before distributing utilities whose distribution requires transfer services in both “distribute independent R/S” and “distribute interdependent R/S” blocks (). This procedure is repeated at each time step until the system reaches a pre-defined recovery target (e.g.: damage levels of all components are zero; functionality of certain CISs restored to post-disaster target levels). The LoR for each R/S of the community is computed using EquationEquation (6)(6)
(6) .
5. Case study of a virtual community supplied by interdependent CISs
In the following section, disaster resilience of a virtual community supplied by three interdependent CISs is quantified using iRe-CoDeS. The community consists of 20 localities, 32 components in localities, 2 bridges, 27 potable water pipes (PWPs), cooling water pipes (CWPs) and electric power transmission lines (EPTLs), and 3600 inhabitants in 9 Building Stock Units (BSUs). The topology of the virtual community is shown in .
Figure 3. Case study virtual community. Considered components in localities are Electric Power Plants (EPPs), Building Stock Units (BSUs), Base Station Controllers (BSCs), Potable Water Facilities (PWFs), Base Transceiver Stations (BTSs) and Cooling Water Facilities (CWFs).
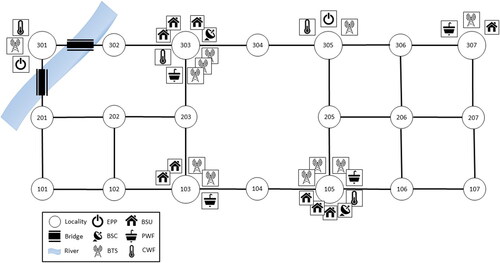
The main purpose of the case study is to model the interdependencies between the different CISs: thus, the CISs functionality is deliberately simplified (). Physical and technical laws regarding the R/S distribution (e.g., hydraulic flow laws and electric power transmission rules) are not considered in this case study. The case study utility R/Ss are: the Electric Power (EP) supplied by the Electric Power Supply System (EPSS); the high-level communication (HLC) supplied by Base Station Controllers (BSCs) followed by the low-level communication (LLC) supplied by Base Transceiver Stations (BTS), both part of the Cellular Communication System (CCS); and the Potable Water (PW) and Cooling Water (CW) supplied by the components of the Water Supply System (WSS), the Potable Water Facilities (PWFs) and the Cooling Water Facilities (CWFs).
Figure 4. Simplified functionality of the CISs.
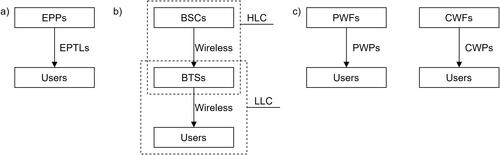
Table A2 in Appendix II summarizes pre-disaster component supply capacities, repair rates, and the numbers of the considered components in the virtual community, while summarizes their R/S demands before the disaster. The case study transfer services are: the CW transfer services (CWTSs) and the PW transfer services (PWTSs), supplied by CWPs and PWPs, respectively; and the electric power transfer service (EPTS) supplied by EPTLs. For simplicity, the PWPs, CWPs and EPTLs are assumed to have the same topology (i.e., geo-location and connectivity properties), as presented in . The transfer service supply capacity of these links is assumed to be infinite, hence, when functional (i.e., their functionality level is above 0), these links can transfer any amount of utility R/Ss. Transfer of HLC and LLC is wireless, hence, no physical links are needed.
Table 1. Pre-disaster demand for utility R/Ss per each component of the virtual community.
Inhabitants of the community populate the building stock units. Each BSU in the virtual community is considered to house 400 people. The portion of the demand imposed on the EPSS and WSS by the inhabitants of the BSUs () is, for simplicity, assumed to decrease in proportion to BSU occupancy, i.e., functionality level, after a disaster (Didier et al., Citation2017). However, demand for LLC services does not depend on BSU damage and functionality directly, but only on the number of inhabitants remaining in the community after a disaster (Didier et al., Citation2017). A time-dependent function describing the change of demand for LLC is given in Equation (7), representing the immediate post-disaster increase in demand due to emergency calls, and the subsequent return of the demand to the pre-disaster level. Changes in the number and spatial distribution of community inhabitants after a disaster due to relocation into temporary shelters or out-migration is not considered in this case study
(7)
(7)
In this case study, initial damage levels of components are assigned arbitrarily to simulate the effects of a virtual disaster, and are shown in Tables A3 and A4. A more realistic simulation of initial damage for the same virtual community exposed to an earthquake is presented in (Blagojević et al., Citation2020a, Citation2020b). Damage/functionality functions of the EPPs, BSUs, BSCs and CWFs are linear, while the BTSs, PWFs, CWPs, PWPs and EPTLs are modelled as binary components. For simplicity, the repair of all components is assumed to start immediately after the disaster (at time t0) and proceed simultaneously at a repair rate specified for each component (Table A2), resulting in a decrease of component damage levels in each time step of community resilience assessment until component damage is eliminated. The disaster recovery of the community is assumed to end when the damage levels of all of its components reach zero, i.e., all components are damage-free.
However, repair of components rarely starts immediately after a disaster. The recovery time of a component usually consists of the delay time (i.e., the time between the occurrence of a disaster and the start of component repair) and the repair time (Comerio, Citation2006). Future work will address the delay time of components within the iRe-CoDeS framework by accounting for component’s impeding factors and the effect of CIS inoperability on components’ recovery (Blagojević et al., Citation2022a). Additionally, component recovery can be delayed due to resource and service constraints. An insufficient supply of recovery R/Ss, such as engineers needed for component damage inspection or workers needed to repair damaged components, can also hinder community recovery. The demand/supply method employed in the iRe-CodeS framework can be used to account for such R/S constraints by considering component’s recovery demand (Blagojević et al., Citation2021b). However, the focus of this case study is to illustrate component interdependencies, therefore, certain elements of component recovery, such as the delay time or the R/S constraints related to recovery, are not considered, thus underestimating the community recovery time and the amount of R/Ss needed for community recovery.
It is noted that iRe-CoDeS model used in this case study can be extended to estimate the cost of community recovery. Recovery costs can be categorized as direct or indirect costs. The estimates of direct costs are mainly related to repair costs of components and can be estimated using methods such as those presented in HAZUS or FEMA P-58 (FEMA, Citation2018; FEMA, Citation2020). Estimates of indirect costs are related to components’ downtime and are more challenging to quantify. One possible approach is to convert the LoR of different R/Ss (i.e., the integrated unmet demand of the community) into economic costs by estimating the equilibrium price of different R/Ss (Didier et al., Citation2018b). The challenge there is that CIS interdependency can affect the costs of unmet demand, as certain users are inoperable due to the unmet demand of several different R/Ss.
Another possible approach is to focus on component’s downtime: since iRe-CoDeS model is defined on a component-level, the downtime of each component can be obtained and converted into economic costs, provided that a reliable estimate of economic costs of a unit of component’s downtime is available. Additionally, the cost of R/Ss used in component recovery can be estimated (Stojadinović et al., Citation2022; Yang, et al., Citation2009), as the iRe-CoDeS model that considers R/S constraints related to recovery (Blagojević et al., Citation2021b) can quantify the amount of R/Ss consumed during community recovery. Clearly, the estimates of recovery cost using iRe-CoDeS framework require further analysis.
5.1. Demand/supply-based interdependency modelling
presents the assumed amount of utility R/Ss each component needs to operate and, therefore, highlights their interdependencies. For example, a BTS needs 0.1 MWh of EP and 50 E (Erlang, Citation1925) of HLC to operate. If the transfer of a utility R/S to a component requires a distribution network, then a corresponding transfer service demand for the same amount of R/S is assigned to that component. Thus, the BTS has a transfer service demand for EPTS of 0.1 MWh, corresponding to the amount of EP it needs.
5.2. System R/S distribution model
Utility R/Ss are distributed according to component priorities: these differ for each utility R/S, but remain constant during the LoR assessment interval. In this case study, distribution of a utility R/S always starts from the components producing that utility R/S. Then, the suppliers of other utility R/Ss have a priority over the BSUs, as shown in Figure A3. Component priorities among the suppliers of R/Ss other than the one being distributed are arbitrarily assumed, but are the same at each time step.
Since the transfer of a utility R/S among components in the same locality is unconstrained, optimal paths are defined for each locality pair (e.g., one pair is: locality 103 and locality 105). Transfer of utility R/Ss is assumed to be possible in both directions (e.g., the same optimal path is used to transfer a utility R/S from locality 103 to locality 105 and from locality 105 to locality 103). Then, if a utility R/S needs to be transferred between a supplier and a user in different localities, the optimal path connecting that locality pair (the locality of the supplier and the user) is used. Optimal paths are calculated for each transfer service separately. A simple optimal path algorithm is employed in this case study. For each locality pair and each transfer service, the optimal path is obtained from a set of pre-defined potential paths, consisting of different links.
Due to the simplifying assumption that all links are binary components and have an infinite transfer service supply capacity, an optimal path is any path from the set of pre-defined paths in which all links are functional (i.e., have a 0 damage level, and hence, a functionality level of 1). If no such path exists between two localities for a considered transfer service, the utility R/S requiring that transfer service is not transferred. Consequently, transfer losses are not considered, meaning that the entire amount of utility R/S is either transferred or it is not. The optimal path algorithm is ran at each time step of the resilience assessment interval, calculating optimal paths between all locality pairs for each transfer service separately. Since all transfer services in this case study are independent R/Ss and all utility R/Ss are interdependent, the distribution of transfer services, (i.e., the optimal path search) is performed before distributing utility R/Ss (). Once calculated, optimal paths remain constant in a time step of the resilience assessment interval.
6. Virtual community resilience assessment results
Disaster resilience of the virtual community is assessed with respect to each considered utility R/S using the presented iRe-CoDeS framework. LoR plots for the considered utility R/Ss are shown in , and present the system’s supply capacity, consumption and demand for the considered utility R/S over the resilience assessment interval. The LoR is quantified as the area between the consumption and demand curve (EquationEquation (6)(6)
(6) ), using a time step equal to one day.
Figure 5. Disaster resilience of the virtual community regarding EP.
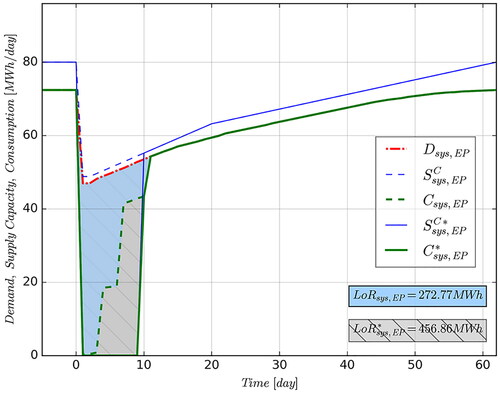
Figure 6. Disaster resilience of the virtual community regarding the HLC.
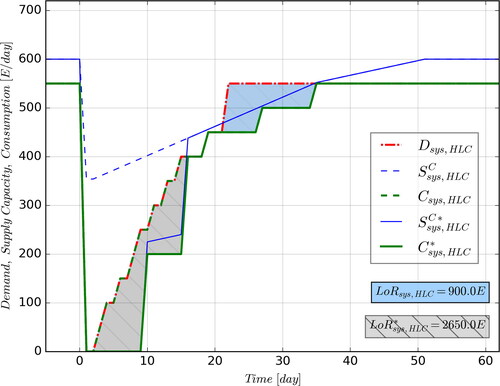
Figure 7. Disaster resilience of the virtual community regarding LLC.
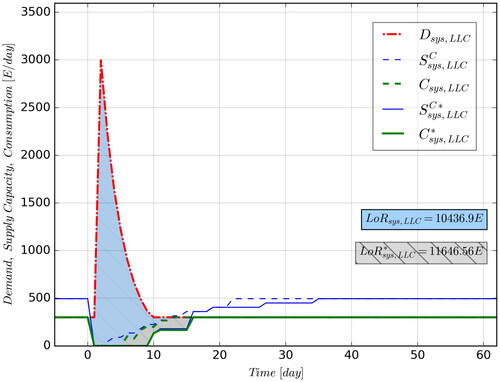
Figure 8. Disaster resilience of the virtual community regarding the PW.
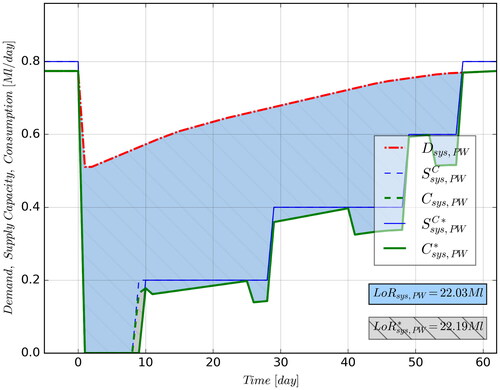
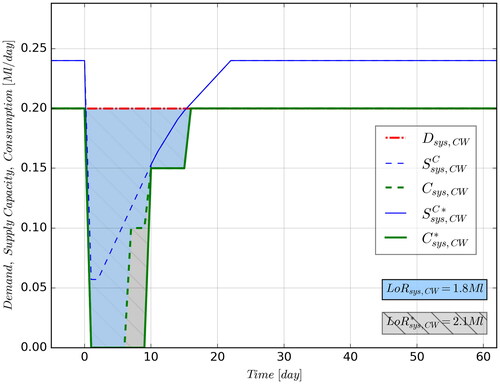
Figure 9. Disaster resilience of the virtual community regarding the CW R/S.
To illustrate the effects of interdependencies between the CISs on community disaster resilience, the results of the analyses with and without interdependency consideration are presented together. Algorithm presented in is used in both cases. However, in the independent case, the R/S demands of a component do not have to be met for that component to operate and have a supply capacity and the operation of components is affected only by their damage level. In the interdependent case, the unmet demand of a component results in setting its supply capacity to zero, regardless of its damage state.
The virtual community recovered to its pre-disaster state in 60 time steps (i.e., 60 days). The number of considered interdependent R/Ss is (i.e., all of the utility R/Ss and no transfer service R/Ss), hence, the RSDS has five elements and the RSDV has 25 elements (i.e.,
). Therefore, within each time step of the LoR assessment interval, at least one run through the entire RSDV that involves 25 R/S distributions is performed. For this case study, 2275 utility R/S distributions among 32 components were performed for the entire resilience assessment interval with interdependencies considered. An object-oriented implementation of this resilience assessment, implemented in Python, took approximately 1.3 seconds on a laptop with 16GB RAM and Intel Core i7-8750H 2.2Ghz CPU.
The dashed blue and green lines in represent the supply capacity and consumption of the community
respectively, for the independent case, while the continuous blue and green line represent the supply capacity
and consumption of the community
respectively, for the simulations with interdependencies considered. The community’s demand,
for a R/S is the same for both cases, since it is assumed that the component inoperability caused by interdependency effects affect only the supply capacity and not the demand. The values between the time steps are linearly interpolated. The R/S LoRs of the system are labelled as
and
for the independent and interdependent cases, respectively.
6.1. Disaster resilience of the virtual community regarding electric power
The considered disaster causes damage to the EPPs, lowering the supply capacity of EP available to the virtual community (). However, the evolution of supply capacity available to the community in the independent and interdependent resilience assessments is not the same. In the independent case, the total supply capacity drops from 80 MWh to 50 MWh due to the damage to the EPPs. When interdependencies are considered, the supply capacity drops to zero, since the demand of the EPPs for CW and LLC cannot be met. Thus, the interdependencies have an adverse effect on the supply capacity of the EPSS. The demand for EP
also decreases due to the damage to the EP users, such as BSUs and BTSs.
Even though the supply capacity for EP is higher than the demand, the consumption of EP is almost zero immediately after the disaster in the independent and interdependent resilience assessments. This is due to the damage suffered by the EPTLs that cannot supply enough EPTS to transfer the EP from the EPPs to the users. Therefore, only the users located at the localities that contain EPPs, localities 301 and 305 (), can consume EP immediately after the disaster, since it is assumed that the transfer of R/Ss within a locality is unconstrained. The jumps in the consumption on days 4, 7 and 10 after the disaster, occur when EPTLs connecting the EPPs with the users in other localities are repaired. In contrast,
remains zero until day 9, since this is the time needed to repair the suppliers of CW and LLC and their distribution networks to meet the demand of EPPs. The system
in the independent case, while
in the interdependent case, showing a significant effect of CIS interdependencies on the EP resilience of the virtual community.
6.2. Disaster resilience of the virtual community regarding the high-level communication
presents the HLC LoR plots. The disaster causes damage to both BSCs, the suppliers of the HLC. However, immediately after the disaster, HLC supply drops from 600E to 350E, while
drops to zero because the BSCs cannot be supplied with EP and CW. The LoR plot for EP in the interdependent case () shows that the EPSS is not producing any EP until day 10 after the disaster. On day 10, all demands of the EPPs can be met and they start producing EP and supplying the BSC at locality 105, resulting in an increase in
The other BSC at locality 303 is supplied with enough CW only on day 16, resulting in another increase of
(), as well as an increase in the consumption of CW ().
The step-wise increase in the HLC demand, is due to the binary character of the users of HLC, the BTSs. Since BTSs are binary components, a jump in HLC demand occurs when a BTS is fully repaired (i.e., its damage level is zero). In addition, BTSs begin to function and produce LLC only when their demand for HLC if fully met. This causes an important drop in HLC consumption from day 22 to day 35, even though the HLC supply is available and HLC demand exists. Jumps in HLC consumption occur on day 27 and day 35 in both independent and interdependent resilience assessments when the HLC demand for the BTSs at localities 305 and 307, respectively, is fully met. The system LoRs are 900E and 2650E in the independent and the interdependent cases, respectively, showing a remarkable effect of the unmet BSCs demand for EP and CW in the first 15 days after the disaster. An installation of emergency EP diesel generators and CW coolers at BSCs is an effective way to reduce this HLC LoR in the virtual community.
6.3. Disaster resilience of the virtual community regarding the low-level communication
LLC is provided by 11 BTSs in the virtual community. The LLC LoR plot is shown in . Due to the increase in emergency calls after a disaster, LLC demand peaks on the first day after the disaster and decreases to the pre-disaster level by day 10. The binary character of the BTSs results in a stepwise increase of the system’s LLC supply capacity in both independent and interdependent cases. LLC LoR in the interdependent case is about 10% higher, due mainly to the unmet demands of some BTSs for EP and HLC in the first 15 days following the disaster.
6.4. Disaster resilience of the virtual community regarding potable water
shows the PW resilience of the virtual community. After the disaster, the demand for PW drops due to the damage suffered by the building stock. The PW demand increases as the BSUs are repaired. The PW supply capacity available to the community drops to zero in both interdependent and interdependent cases because the PWFs are treated as binary components, and all community PWFs suffered a certain amount of damage due to the disaster (Table A3 in Appendix II). Hence, none of them was operational immediately after the disaster. The stepwise increase of the PW supply capacity occurs when a PWF is fully repaired. In this case study, the interdependency between PWFs and the EPSS did not have a large effect on the functionality of the PWFs. The EPSS delayed the increase of the total PW supply capacity by one time step: in the independent case the first PWF was operational on day 9, and in the interdependent case it was operational on day 10.
One of the consequences of dynamic interdependency modelling in iRe-CoDeS can be seen on days 25, 40 and 53, when an unexpected decrease in PW consumption occurs. This is because the PW demand (of the inhabitants returning to the repaired BSUs) increases faster than the PW supply capacity. On days 25, 40 and 53 the demand of certain BSUs increases to a point where the current PW supply cannot meet their demand in full. This results in redirecting the available PW supply to other BSUs with lower PW demand that can be fully met at that time step. As their demand is lower, their consumption is also lower and, thus, there is a drop in the consumption of PW. On days 29, 48 and 56 the PW supply capacity increases, due to the repaired PWFs, leading to an increase in PW consumption. This change in how the PW users (i.e., the BSUs) are supplied by the same PW suppliers illustrates how iRe-CoDeS can simulate the change of interdependency relations among components as the community is recovering.
6.5. Disaster resilience of the virtual community regarding cooling water
The CW LoR plot is shown in . The total CW supply drops from the pre-disaster 0.2Ml/day to 0.055Ml/day in the independent case and to zero in the interdependent case. In the independent case, the total CW supply capacity starts to increase immediately after the disaster, since the CWFs are recovering. However, in the interdependent case, the total CW supply capacity remains zero until day 10, similarly to other CISs of the virtual community. On day 10, the EPSS recovers, the CWFs are supplied with EP and start to supply the virtual community with CW again. Thereafter, the total CW supply capacities in both cases are the same. The stepwise increases in CW consumption are, again, due to the assumption that a user demand has to be fully met for consumption to start. Therefore, jumps in CW consumption occur once the CW supply capacity is large enough to fully meet the demand of BSCs and EPPs, and once the distribution network (i.e., the water pipes) can transfer the CW from CWFs to BSCs and EPPs. The difference in CW LoRs in independent and interdependent cases is primarily due to the unmet demand of CWFs for EP and LLC in the first 10 days after the disaster.
6.6. Employing the iRe-CoDeS framework to improve community disaster resilience through pre-disaster adaptation measures
Disaster resilience quantification results obtained from the iRe-CoDeS model can be used to design and evaluate proposed community resilience-improvement measures with respect to the desired community disaster resilience goals (Blagojević et al., Citation2022b, Citation2022c). Increasing components’ robustness or recoverability is a direct way to increase community disaster resilience. Sensitivity analysis methods can be used within the iRe-CoDeS framework to identify components whose retrofit or faster recovery will have the highest impact on community disaster resilience (Blagojević et al., Citation2021a).
Reducing component and system interdependencies is an indirect way to increase community disaster resilience. The iRe-CoDeS framework enables comparing independent and interdependent model outcomes. Therefore, if a substantial amount of supply capacity is lost due to interdependency effects (i.e., the difference between and
is large), reducing components’ interdependency (e.g., providing backup power generators that remove the dependence of components on the EPSS) may be justified.
7. Conclusions
This paper presents a disaster resilience quantification framework for systems-of-interdependent-systems, the iRe-CoDeS framework. The framework extends the Re-CoDeS disaster resilience quantification framework that measures the resilience of a Civil Infrastructure System (CISs) using the Lack of Resilience (LoR) metric. LoR is a measure of CIS performance, relevant for making rational decisions on how to increase community disaster resilience. It represents the post-disaster unmet demand of the community for a resource or a service provided by the considered CIS over the resilience assessment interval. The iRe-CoDeS framework discretizes a system (e.g., a community) into components that can belong to various subsystems of the considered system and are located in or between localities. Components can supply the system with one or multiple resources or services and/or demand one or multiple resources or services from the system. Components recover, and thus increase their functionality, due to repairs that decrease their damage level at a predefined repair rate in each time step of the resilience assessment interval.
Interdependencies among components are modeled through the resources and services they need to operate. Interdependency relations among components of a system are not pre-defined: instead, they depend on the post-disaster component supplies and demands for various resources and services, on the state of the distribution networks, and on the component prioritization during resource and service distribution, all of which can vary during the resilience assessment interval. Additionally, components can be supplied by different suppliers at different times during system recovery. Therefore, the interdependencies modeled in the iRe-CoDeS framework are dynamic, not static, making it possible to consider changes in interdependency relations between components over time. Furthermore, interdependency loops, situations when failure of one component to function triggers failures of other components, are expected to occur. The presented iRe-CoDeS framework features a demand/supply-based interdependency model and a resource and services distribution algorithm to resolve such interdependency loops and, thus, enables quantification of community disaster resilience considering interdependencies among community components.
A case study on a virtual community is used to demonstrate the presented iRe-CoDeS framework. The virtual community consists of the building stock, the electric power supply system, the cellular communication system and the water supply system. After a virtual disaster, damage levels are assigned to each component of the community, followed by a recovery process that lasts until all components are damage-free. The virtual community supply, demand and consumption of the resources and services, such as the electric power or potable water, over the resilience assessment interval are presented in LoR plots.
Two iRe-CoDeS resilience assessments are conducted, one with and the other without considering component interdependencies. A comparison of the LoR plots reveals a significant reduction of virtual community disaster resilience due to interdependencies. Furthermore, an analysis of the supply, demand and consumption changes at both the system and the component levels, enabled by the presented iRe-CoDeS framework, reveals the causes of disaster resilience reduction. Such findings point to rational and effective resilience improvement interventions, as components and CISs that are significantly impaired by the interdependency effects are identified. Reducing the dependency of such components on other CISs can effectively increase community disaster resilience. Notably, the iRe-CoDeS resilience assessment without considering interdependencies reveals the upper limit of such resilience improvement measures. If such upper limit does not meet the community resilience objectives, alternative measures, such as increases of component robustness and/or system redundancy, should be considered.
Supplemental Material
Download MS Word (999.7 KB)Acknowledgements
The authors would like to thank ETH Zürich for funding the work presented in this publication.
Disclosure statement
The authors declare that there is no conflict of interest.
References
- Blagojević, N., Didier, M., & Stojadinović, B. (2021a). Quantifying component importance for disaster resilience of communities with interdependent civil infrastructure systems. EngrXiv Org. doi:10.31224/osf.io/hzmy8.
- Blagojević, N., Didier, M., & Stojadinović, B. (2021b). Simulating the role of transportation infrastructure for community disaster recovery. Proceedings of the Institution of Civil Engineers–Bridge Engineering, 1–10. doi:10.1680/jbren.21.00018
- Blagojević, N., Didier, M., & Stojadinović, B. (2022a). A demand-supply framework for evaluating the effect of resource and service constraints on community disaster resilience. Resilient Cities and Structures. Accepted.
- Blagojević, N., Didier, M., & Stojadinović, B. (2022b). Evaluating NIST community disaster resilience goals using the iRe-CoDeS resilience quantification framework. Proceedings of 12 National Conference on Earthquake Engineering. Salt Lake City, Utah. Earthquake Engineering Research Institute (EERI).
- Blagojević, N., Didier, M., & Stojadinović, B. (2022c). Risk-informed resilience assessment of communities using lack of resilience surfaces. Proceedings of 13th International Conference on Structural Safety and Reliability (ICOSSAR 2021). Shanghai, China: International Association for Structural Safety and Reliability (IASSAR).
- Blagojević, N., Kipfer, J., Didier, M., & Stojadinović, B. (2020a). Probability-based resilience assessment of communities with interdependent civil infrastructure systems. Proceedings of 17th World Conference on Earthquake Engineering. Sendai, Japan: International Association for Earthquake Engineering (IAEE).
- Blagojević, N., Kipfer, J., Didier, M., & Stojadinović, B. (2020b). Scenario-based resilience assessment of communities with interdependent civil infrastructure systems. Proceedings of 17th World Conference on Earthquake Engineering. Sendai, Japan: International Association for Earthquake Engineering (IAEE).
- Bruneau, M., Chang, S. E., Eguchi, R. T., Lee, G. C., O'Rourke, T. D., Reinhorn, A. M., … von Winterfeldt, D. (2003). A framework to quantitatively assess and enhance the seismic resilience of communities. Earthquake Spectra, 19(4), 733–752. doi:10.1193/1.1623497
- Brunner, E., & Giroux, J. (2009). Examinig Resilience: A concept to improve societal security and technical safety. Center for Security Studies (CSS), ETH Zurich.
- Buldyrev, S. V., Parshani, R., Paul, G., Stanley, H. E., & Havlin, S. (2010). Catastrophic cascade of failures in interdependent networks. Nature, 464(7291), 1025–1028. doi:10.1038/nature08932
- Comerio, M. C. (2006). Estimating downtime in loss modeling. Earthquake Spectra, 22(2), 349–365. doi:10.1193/1.2191017
- Costa, R., Haukaas, T., & Chang, S. E. (2021). Agent-based model for post-earthquake housing recovery. Earthquake Spectra, 37(1), 27–46. doi:10.1177/8755293020944175
- Didier, M., Baumberger, S., Tobler, R., Esposito, S., Ghosh, S., & Stojadinović, B. (2018). Seismic resilience of water distribution and cellular communication systems after the 2015 Gorkha Earthquake. Journal of Structural Engineering, 144(6), 04018043–04018011. doi:10.1061/(ASCE)ST.1943-541X.0002007
- Didier, M., Broccardo, M., Esposito, S., & Stojadinović, B. (2018a). A compositional demand/supply framework to quantify the resilience of civil infrastructure systems (Re-CoDeS). Sustainable and Resilient Infrastructure, 3(2), 86–102. doi:10.1080/23789689.2017.1364560
- Didier, M., Broccardo, M., Esposito, S., & Stojadinović, B. (2018b). Seismic resilience of interdependent civil infrastructure systems. Proceedings of 11 US National Conference on Earthquake Engineering. Los Angeles, CA: Earthquake Engineering Research Institute (EERI).
- Didier, M., Grauvogl, B., Steentoft, A., Broccardo, M., Ghosh, S., & Stojadinovic, B. (2017). Assessment of post-disaster community infrastructure services demand using Bayesian networks. 16th World Conference on Earthquake Engineering. Santiago, Chile.
- Didier, M. (2018). Seismic resilience of communities and of their civil infrastructure systems (PhD Thesis). Zurich: ETH Zurich.
- Didier, M., Sun, L., Ghosh, S., & Stojadinović, B. (2015). Post-earthquake recovery of a community and its electrical power supply system. Proceedings of the 5th International Conference on Computational Methods in Structural Dynamics and Earthquake Engineering (COMPDYN 2015), pp. 1451–1461. doi:10.7712/120115.3478.869
- Erlang, A. K. (1925). The Theory of Probabilities and Telephone Conversations. Revue générale de l’Electricité, 18.
- Fang, Y.-P., & Zio, E. (2019). An adaptive robust framework for the optimization of the resilience of interdependent infrastructures under natural hazards. European Journal of Operational Research, 276(3), 1119–1136. doi:10.1016/j.ejor.2019.01.052
- FEMA. (2018). Seismic performance assessment of buildings. Washington, D.C.: FEMA P-58 Federal Emergency Management Agency (FEMA).
- FEMA. (2020). HAZUS Earthquake Model 4.2 Technical Manual. Washington, D.C.: Federal Emergency Management Agency (FEMA).
- Guidotti, R., Chmielewski, H., Unnikrishnan, V., Gardoni, P., McAllister, T., & van de Lindt, J. (2016). Modeling the resilience of critical infrastructure: the role of network dependencies. Sustainable and Resilient Infrastructure, 1(3-4), 153–168. doi:10.1080/23789689.2016.1254999
- He, X., & Cha, E. J. (2020). Modeling the damage and recovery of interdependent civil infrastructure network using dynamic integrated network model. Sustainable and Resilient Infrastructure, 5(3), 152–167. doi:10.1080/23789689.2018.1448662
- He, X., & Cha, E. J. (2021). DIN II: incorporation of multi-level interdependencies and uncertainties for infrastructure system recovery modeling. Structure and Infrastructure Engineering, 17(11), 1516–1566. doi:10.1080/15732479.2020.1817104
- Hefti, F. (2019). Disaster resilience of interdependent civil infrastructure systems (MSc Thesis). Zurich: ETH Zurich.
- Henken, J. (2019). Resilience of interdependent civil infrastructure systems (MSc Thesis). Zurich: ETH Zurich.
- Hosseini, S., Barker, K., & Ramirez-Marquez, J. E. (2016). A review of definitions and measures of system resilience. Reliability Engineering & System Safety, 145, 47–61. doi:10.1016/j.ress.2015.08.006
- Johansen, C., & Tien, I. (2018). Probabilistic multi-scale modeling of interdependencies between critical infrastructure systems for resilience. Sustainable and Resilient Infrastructure, 3(1), 1–15. doi:10.1080/23789689.2017.1345253
- Kong, J., & Simonović, S. P. (2019). Probabilistic multiple hazard resilience model of an interdependent infrastructure system. Risk Analysis: An Official Publication of the Society for Risk Analysis, 39(8), 1843–1863. doi:10.1111/risa.13305
- Kongar, I., & Rossetto, T. (2015). A methodological hierarchy for modelling lifelines interdependencies in risk management. Proceedings of the SECED 2015 Conference: Earthquake Risk and Engineering towards a Resilience World. Society for Earthquake and Civil Engineering Dynamics (SECED).
- Kröger, W. (2008). Critical infrastructures at risk: A need for a new conceptual approach and extended analytical tools. Reliability Engineering & System Safety, 93(12), 1781–1787. doi:10.1016/j.ress.2008.03.005
- McAllister, T., Clavin, C., Ellingwood, B., van de Lindt, J., Mizzen, D., & Lavelle, F. (2019). Data, information, and tools needed for community resilience planning and decision-making (Vol. 1240). Gaithersburg, MD: NIST Special Publication. doi:10.6028/NIST.SP.1240
- Moslehi, S., & Reddy, T. A. (2018). Sustainability of integrated energy systems: A performance-based resilience assessment methodology. Applied Energy, 228(May), 487–498. doi:10.1016/j.apenergy.2018.06.075
- OECD. (2019). Good governance for critical infrastructure resilience. OECD Reviews of Risk Management Policies. OECD Publishing, Paris. doi:10.1787/02f0e5a0-en
- Ouyang, M. (2014). Review on modeling and simulation of interdependent critical infrastructure systems. Reliability Engineering & System Safety, 121, 43–60. doi:10.1016/j.ress.2013.06.040
- Poljanšek, K., Bono, F., & Gutiérrez, E. (2012). Seismic risk assessment of interdependent critical infrastructure system: The case of European gas and electricity networks. Earthquake Engineering & Structural Dynamics, 41(1), 61–79. doi:10.1002/eqe.1118
- PPD-8. (2011). Presidential Policy Directive. PPD-8–National Preparedness. Washington, USA: The White House.
- Reed, D., Wang, S., Kapur, K., & Zheng, C. (2016). Systems-based approach to interdependent electric power delivery and telecommunications infrastructure resilience subject to weather-related hazards. Journal of Structural Engineering, 142(8), C4015011(1–12). doi:10.1061/(ASCE)ST.1943-541X.0001395
- Rinaldi, S. M., Peerenboom, J. P., & Kelly, T. K. (2001). Identifying, understanding, and analyzing critical infrastructure interdependencies. IEEE Control Systems Magazine, 21(6), 11–25. doi:10.1109/37.969131
- Roohi, M., van de Lindt, J. W., Rosenheim, N., Hu, Y., & Cutler, H. (2021). Implication of building inventory accuracy on physical and socio-economic resilience metrics for informed decision-making in natural hazards. Structure and Infrastructure Engineering, 17(4), 534–554. doi:10.1080/15732479.2020.1845753
- Scawthorn, C. (2020). Fire following earthquake in the Vancouver region. Toronto, Canada: Institute for Catastrophic Loss Reduction.
- Sharma, N., Tabandeh, A., & Gardoni, P. (2018). Resilience analysis: a mathematical formulation to model resilience of engineering systems. Sustainable and Resilient Infrastructure, 3(2), 49–67. doi:10.1080/23789689.2017.1345257
- Soga, K., Wu, R., Zhao, B., & Wang, C. (2021). City-scale multi-infrastructure network resilience simulation tool. PEER Report No. 2021/05. Pacific Earthquake Engineering Reseach Center (PEER.)
- Stojadinović, Z., M. Kovačević, D. Marković and B. Stojadinović, (2021). Rapid Earthquake Loss Assessment Based on Machine Learning and Representative Sampling. Earthquake Spectra, 38(1). doi:10.1177/87552930211042393
- Stojadinović, Z., Kovačević, M., Marinković, D., & Stojadinović, B. (2022). Rapid earthquake loss assessment based on machine learning and representative sampling. Earthquake Spectra, 38(1), 152–177. doi:10.1177/87552930211042393
- Sun, W., Bocchini, P., & Davison, B. D. (2021). Policy-based disaster recovery planning model for interdependent infrastructure systems under uncertainty. Structure and Infrastructure Engineering, 17(4), 555–578. doi:10.1080/15732479.2020.1843504
- Terzić, V., Villanueva, P. K., Saldana, D., & Yoo, D. Y. (2021). F-Rec Framework: Novel framework for probabilistic evaluation of functional recovery of building systems. PEER Report No. 2021/06. Pacific Earthquake Engineering Research Center (PEER).
- Wang, S., Stanley, H. E., & Gao, Y. (2018). A methodological framework for vulnerability analysis of interdependent infrastructure systems under deliberate attacks. Chaos, Solitons and Fractals, 117, 21–29. doi:10.1016/j.chaos.2018.10.011
- Yang, D. Y., & Frangopol, D. M. (2019). Life-cycle management of deteriorating civil infrastructure considering resilience to lifetime hazards: A general approach based on renewal-reward processes. Reliability Engineering & System Safety, 183, 197–212. doi:10.1016/j.ress.2018.11.016
- Yang, T. Y., Moehle, J. P., Stojadinović, B., & Der Kiureghian, A. (2009). Seismic performance evaluation of facilities: Methodology and implementation. Journal of Structural Engineering, 135(10), 1146–1154. doi:10.1061/(ASCE)0733-9445(2009)135:10(1146)
- Yu, J.-Z., & Baroud, H. (2020). Modeling uncertain and dynamic interdependencies of infrastructure systems using stochastic block models. ASCE-ASME Journal of Risk and Uncertainty in Engineering Systems, 6(2), 020906(1–10). doi:10.1115/1.4046472