
Abstract
The need for measurable data from physical assets to actively feed a living Digital Twin (DT) is paramount. The requirements and needs that the gathered data should fulfill in order to be practically implemented in the stream data pipeline are heterogeneous, some of them general and other case-specific. This article summarizes a set of identified challenges and requirements for a seamless infusion of well-established Structural Health Monitoring (SHM) systems within DT platforms, without the objective of solve all of them. This identification is performed based on a review of traditional SHM systems with a vast array of information sources as well as on the review of techniques for the systematic digitalization of existing assets. On the other hand, ten real demo cases belonging to Ashvin, an H2020 Research and Innovation project, are providing real world testing beds for an active development of SHM infused in DT systems. Multiple information sources are studied in those sites, which also enriches with more realism, the identification of requirements and challenges presented herein. These assets provide a perspective to researchers about practical implications of these needs.
1. Introduction
Productivity in the construction sector has a huge margin of improvement. Global labor-productivity growth in construction underperforms when compared to other major industries. On the other hand, the current number of accidents on construction sites is not acceptable (Selleck et al. Citation2023). Within Europe, construction is by far the most dangerous occupation with a higher rate of fatalities than all other industries. Safety planning in the construction industry has always been complex due to the dynamic nature of the construction environment as well as to the interactions between occasionally disaggregated stakeholders. In both construction and maintenance phases, the efficiency of the used resources can be enhanced considerably.
One way to improve this unacceptable situation in the construction industry is by introducing digitalization and virtualization. Technological advances are inherently (and sometimes optimistically) called as improvement enablers in all sectors. When it comes to Architecture, Engineering and Construction (AEC) at design, construction and maintenance phases, digitalization based on emerging and established technologies 4.0 is also called to be a major enhancer (Dallasega et al. Citation2018). Building Information Modelling (BIM) is established in the sector at advanced levels of technology readiness. There is, however, still a huge margin for improvement when it comes to robust, fully digitalized infrastructure systems in which relevant physical magnitudes are strongly intertwined with their virtual counterparts.
The Digital Twin (DT), an information system with capabilities beyond BIM, is intended to establish active, timely connection between physical and virtual realms for decision making at design, construction and maintenance stages (Davila-Delgado & Oyedele, Citation2021). This information system relies on an adequate development of pipelines of information, which are well defined paths that combine and transform measured data to gain specific insight. Even though advances in sensing, data-gathering techniques, IoT, cloud technologies and simulation enable the constitution of a DT, establishing pipelines that traverse these technologies still present technical challenges from the systems architecture and software integration perspectives. The automation of the decision-making process is dependent on the level of readiness of the information pipeline system defined within the DT.
Structural Health Monitoring (SHM) systems represent one crucial provider of data related to the behavior and condition of infrastructure systems. Compared to the DT paradigm, SHM only provides methods for data gathering and analysis, however, it does not elaborate about the integration of both within the same system. Adequate embeddedness of cutting-edge SHM systems within DTs will provide better, more accurate and more varied data to owners, managers, practitioners, designers, and many other stakeholders in the AEC sector.
As a contribution to this transitional digitization, this article aims at identifying and summarizing challenges and requirements for a seamless infusion of traditional as well as cutting-edge Structural Health Monitoring systems within DT platforms. This identification is performed based on:
A review on traditional SHM systems with a vast array of information sources. In addition, the review covers cutting-edge techniques for the systematic digitization of existing assets which have never had any virtual counterpart since their construction.
An active development of SHM systems within a pool of infrastructure assets presently under study within Ashvin, a European H2020 research and innovation project (Ashvin, Citation2020). The project encompasses all phases (Design, Construction and Maintenance) but this article is specifically focused on operation/maintenance (O&M) phases. The O&M demo sites included in the ASHVIN project provide a broader and realistic perspective to researchers about the needs and the usefulness of these systems.
To explain the possible solutions to the identified challenges and requirements is not in the scope of the present article as the response would be impracticable in a single article. The organization of the article is as follows: Section 2 presents definitions and coincidences between SHM and DT. Section 3 presents a condensed version of the literature review in which key takeaways are identified. Section 4 presents the demonstrators as well as their singularities for implementation and development of SHM-DT systems. Both sections are intertwined in section 5, in which a discussion about requirements and challenges is addressed.
2. Digital twins and structural health monitoring systems
2.1. Digital twins
The Gemini Principles (Bolton et al. Citation2018) define a DT as ‘a realistic digital representation of assets, processes or systems in the built or natural environment’. In reports from the National Infrastructure Commission in the UK, NIC (Citation2017): ‘The DT is effectively a data representation of the infrastructure that takes real-time and other data into the management processes of that real-infrastructural component’.
It is well understood that in both definitions, DT are understood not only as digital replicas of a real/physical asset (e.g., a picture, a geometric 3D model or a semantically enriched BIM geometry), but ‘what distinguishes a DT from any other digital model or replica is its adequate real-time connection to its physical counterpart’. By connection, it is understood that there is an active relationship and association between the physical and virtual realms, that is, information in one realm enriches another. By real-time, it is understood that information flows at the time it is needed, that is, the right-time. Therein lies the complexity and the vast scope of this concept.
In an attempt for harmonizing definitions for better understanding of DT for the built environment, Davila-Delgado and Oyedele (Citation2021) have collected and identified a set of definitions. A comprehensive overview and system architectures proposed in the literature for a DT is available in Davila-Delgado and Oyedele (Citation2021) and Lu et al. (Citation2020). The next step to be taken in the road to digitalization, in which existing frameworks such as BIM represent an ideal baseline, is to connect both realms as profusely (and meaningfully) as possible with many sources of information.
Presently, it is feasible to link physical and virtual assets through the deployment of a series of data-collection techniques in the physical realm that feed the virtual realm. The nature of the information is, or can be, multiform. A vast array of techniques provides nowadays meaningful information. Data collection coming from sensors (time-series), cameras (images, videos, thermal imagery, images that become point clouds), laser scanners or radars (point clouds or images) and many other technological advances are ready to feed infrastructure assets with valuable information. Very occasionally, all sources of information are disaggregated and independent. Challenges for their use in Bridge Maintenance are also identified (Futai et al. Citation2022; Jiang et al. Citation2022; Pregnolato et al. Citation2022; Shim et al. Citation2019). As a matter of fact, new human–infrastructure interfaces for bridge management are found in academic literature (Omer et al. Citation2019).
Therefore, for the ideal development and full beneficial application of the DT concept, the asset requires a continuous synchronization between the physical and the virtual realms using contextualized information. This has to be performed through the integration with a wide range of existing services. Knowledge graphs represent a way of aggregating data coming from different sources at different rates as well. The list of parts presented above can also be defined as a list of stakeholders within an Infrastructure Management System.
2.2. Structural health monitoring systems
In the context of civil engineering structures, SHM encompasses both ‘the observation’ and ‘the analysis’ of a built asset. A SHM system uses periodically sampled response measurements. Changes of the material and geometric properties of infrastructures are monitored and analyzed periodically. SHM represents a mature field of knowledge. SHM aims at managing risks and at taking informed decisions. In this sense, the observation represents a part of a vaster concept. SHM comprises post-processing and analysis of the data. Evaluation of the performance of the asset as well as prognosis are also parts of it. SHM represents a fundamental layer for decision-making processes in infrastructure management. In this sense, three aspects are worth pointing out:
Measurements and analysis allow to validate the design. It is crucial to check whether the built asset behaves as planned.
Measurements and analysis allow to assess the structural performance. This is carried out along the service-life and operation of the asset. SHM techniques are oriented to the identification of sensitive characteristics.
Measurements and analysis allow to improving asset management. SHM can help with taking informed based decisions to managers.
2.3. DT and SHM
In both DT and SHM systems, measurement, analysis and decisions on the asset are expected. In recent decades, SHM systems have helped to the decision-making process in maintenance works. The proportion of existing assets being presently monitored in a regular basis is, however, small. With the advent of highly detailed models, BIM, Bridge Management Systems and ultimately, DTs of the assets, information can be aggregated in unforeseen manners, which is called to boost the proportion of monitored assets. Thus, the massive virtualization of assets represents an evolution of SHM systems in terms of data aggregation and comprehensiveness.
One can infer that, attending to the definitions presented in sections 2.1 and 2.2, the new generation of SHM systems would be embedded into more complex information systems with much more layers. The procedures provided by SHM are precisely those required by the layers of information related to the geometrical and material behavior of infrastructure assets. Many of the decision-making performance indicators are directly related to the condition of the asset. The conundrum arises: can this new generation of tools for asset management be applied on a massive scale by managers?
These tools can be impactful and enhancers of the decision-making process if a certain level of efficiency is achieved. A vast array of information sources implies a vast set of stakeholders. Automating pipelines of information for many stakeholders is a challenge for its own sake. Interaction between agents may generate that the traditional SHM systems information flows require adaption to the DT information system.
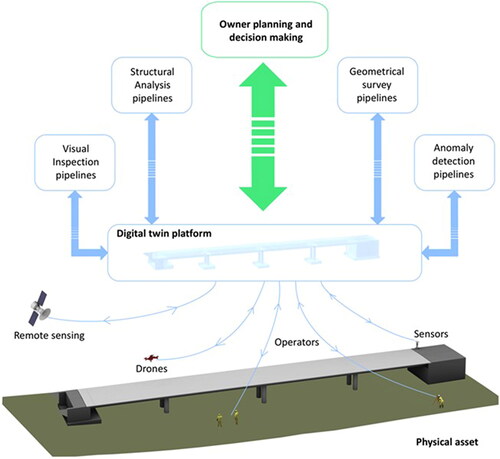
illustrates the coincidence of fields, the multiple pipelines of information as well as the potential interactions between stakeholders. For instance, field data may be sensor-based, image-based or remotely acquired. All these types of information require special treatment for proper embeddedness in other systems. On the other hand, numerical and geometrical models should be based on consistent data-exchangeable formats. DT cloud platforms provide a set of interconnected databases and methods to integrate information from models (e.g., BIM and structural models) and data sources. They also make the information available to data infusion/extraction by third-parties which may also contribute with specific services such as specific anomaly detection or structural analysis. The DT of the asset is expected to encompass all stakeholders seamlessly. The complexity of the information system will increase with the amount of sources of information that are gathered in the same twin.
Figure 1. Integration of needs for SHM systems embedded within a DT platform.
In the research project Ashvin (Citation2020), one crucial aspect is the identification of requirements and challenges for the infusion of SHM measurements within DTs. For the sake of identification, different methodological perspectives are established: (i) a literature review on existing SHM deployments, (ii) the development of SHM-FEM-DT systems in the form of interoperable applications of measurements, numerical models and decision-making tools and (iii) the implementation of exemplary SHM-FEM-DT systems within a set of ten demonstrators available within the research project. This article presents the first part, corresponding to the literature review together with the study of ten demo cases. Specific requirements and challenges identified from the development and implementation of systems in these sites enrich the review as well.
3. Literature review on data-collection techniques and tools
3.1. Characteristics of the review
This review is narrow-scoped. Its particular aim is to identify requirements for digitalization of SHM information and their implementation in DT platforms, and to foresee challenges for establishing these requirements. Thus, the identification of the requirements and challenges for such infusion is the single research question on this review. Prior to beginning with the review, two aspects are worth mentioning:
Firstly, it is recognized that SHM systems are usually tailor-made. SHM systems are deployed on assets that may never be digitalized during their lifetime. That is to say, the asset may not have any replica of any kind in the virtual realm.
Secondly, the ability to measure the natural and built environment has exploded in recent years. A vast array of possibilities, ranging from simple tailor-made, open-source IoT-connected sensors to high precision IoT-enabled robust systems are mature nowadays. Increasingly, measurements are precisely, efficiently and robustly performed in infrastructure systems. It is expected that recorded data will not stop growing in the next years. Nevertheless, a vast array of information sources such as sensors (contact-based or remote) and/or imagery, can be used in these deployments. The format and nature of the results that require processing are source-dependent, which adds complexity in this development.
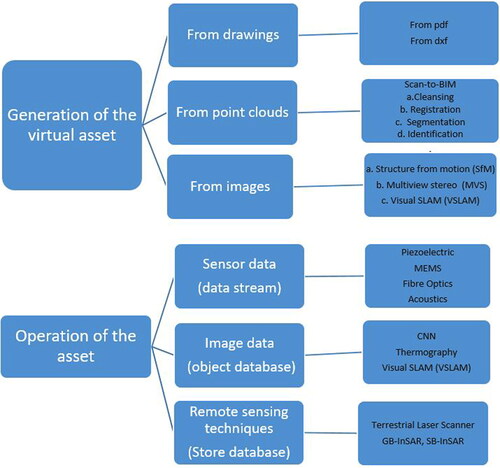
As a result, it is important to identify tools and requirements from two perspectives: (i) tools for the generation of the virtual asset itself, which are gathered in section 3.2 and (ii) data-gathering tools that enable an interaction between the physical and the virtual realms during operation considering many sources of information (addressed in section 3.3). summarizes the organization of the review, where three data-collection sources are listed. For each source, different methods and thus, specific keywords are also identified. This organization of the sources allows designing the survey with a narrow scope but interestingly, with a comprehensive visualization of multiple pipelines of information.
Figure 2. Organization of the review. Identification of sources of keywords.
3.2. Techniques and tools for the generation of the virtual asset
The generation of the virtual asset is key. It requires thoughtful development for the sake of inclusiveness of many stakeholders. The current standards of practice in BIM establish among other things, the Level of Development (LoD). The LoD defines the amount and degree of building information that needs to be placed in a BIM Model. This not only includes the level of detail of the graphical objects but also, the data associated with the physical characteristics of the objects, their sources, their traceability, their as-built characteristics or singularities and so forth. To specify a target LoD, catalogs and standards are available. The LoD specification for Building Information Models is a well-known reference tool where characteristics of LoD are defined for multiple elements of buildings and infrastructure. A DT should also follow a similar categorization based on existing Standards in Industry.
Clearly, on top of those layers, DT are expected to have added features. Embedded sensors, network capabilities, timely inspection and evolution in time, to mention some of them. They require proper infusion in existing (and evolving) frameworks. Even in current design projects being developed, the generation of virtual assets in the form of DTs is yet to become a common practice. In addition, many existing infrastructures and infrastructure systems have never been virtualized accordingly or even no information is available at all. Scarce (or not-to-date) information found in drawings may be the only source of information for those in charge of this virtualization. For the sake of generating the virtual asset of existing infrastructure, a considerable effort is thus required to spark its Digital Birth and its corresponding connection between the physical and the virtual realms.
Current practice and market available techniques suggest the process of digitalizing the physical and geometrical characteristics of an asset by many means. Firstly, traditional creation of virtual geometrical models from drawings. This implies generating an asset that can be used and expanded by third parties accordingly. Secondly, by means of digitizing the asset using laser scanning techniques, in which the reflected radiations of the physical asset are gathered in the form of point clouds. Thirdly, by digitizing the asset using cameras, in which the emitted radiations of the physical asset are gathered in the form of imagery that is subsequently transformed into point clouds. This principle has been understood from many measuring perspectives.
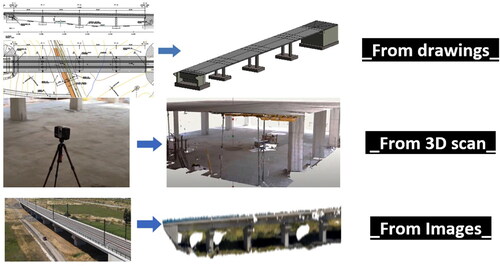
illustrates this specific part of the survey. Three domains are selected, namely, the digitalization of the asset from 2D documents (Drawings), the digitation of the asset using 3D scanning (Lidar, TLS) and the digitalization of the asset using images (monocular cameras, databases). Specific academic production that depict methods, algorithms, experimental techniques or developments in each area is reviewed.
Figure 3. Techniques for the generation of the virtual asset.
First, developing methods and procedures of automatic extraction of data directly from scanned drawings is a tremendous task in civil engineering works. Generating digital models for existing assets with only drawings or pictures represents an interesting alternative for the digitalization of assets for maintenance purposes. Manual digitalization is time-consuming and depends on the technical expertise of the modeler. Drawings are, however, numerous for a specific project and are produced with tailor-made detail and type of information presented. Recognizably, automatic reading, identification and geometry generation from 2D drawings are relatively easy tasks when it comes to digitalizing single elements that require extrusion. However, complexity scales very fast when multiple perspectives and scales are to be digitized from drawings with heterogeneous data.
Consequently, when automatic development becomes impracticable, the digitalization of drawings becomes faster using human-power and 3D development from scratch. In this sense, it should be also taken into consideration the fact that the physical asset could not perfectly correspond to the digital replica obtained from design drawings, as errors and tolerances can appear during the construction process. It is then preferred to use ‘as built’ documentation. When existing assets require digitation for a particular maintenance purpose, it is optimal to use this specific episode of the asset as its digital spark. Human-power can thus be used more efficiently in all subsequent episodes of maintenance.
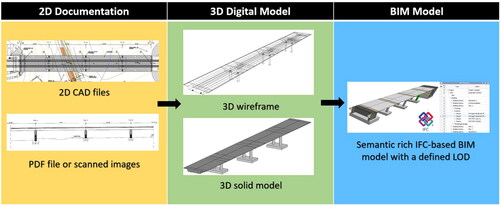
illustrates the procedure. Examples found in the literature are not numerous. Furferi et al. (Citation2010) developed 3D Pseudo wireframes from 2D orthographic views based on Boundary Representations (B-Rep) topology. Yang et al. (Citation2020) presented a semiautomatic Structural semantically-rich BIM-Model Generation Methodology Using CAD Construction Drawings. Gimenez et al. (Citation2016) developed an automatic reconstruction of 3D building models from scanned 2D floor plans. More recently, Akanbi and Zhang (Citation2022) presented a generation of BIM models according to the openBIM standard Industry Foundation Classes (IFC) from pdf 2D bridge drawings, implementing successive cleaning and conversions to raster graphics files, vector graphic files, and tagged data graphic files.
Figure 4. From available 2D documentation to an IFC-based BIM model.
Secondly, 3D scanning techniques are increasingly being adopted due to their cost- and time-effectiveness when surveying assets geometries from the AEC sector. 3D scanning techniques provide advantageous features during the digital birth of the asset. Full Scan-to-BIM processes are becoming increasingly sophisticated in the digitalization of assets, where multiple data pipelines are being established from raw point clouds to semantically rich 3D models. Attempts from Scan-to-BIM processes are available in the literature (see ). These attempts have varied levels of automation and sophistication. In general, the academic production focuses on specific types of geometries and construction materials. Nonetheless, the measurement, digital observation and semantic identification of objects without coming into direct contact with them is readily available for AEC. As a matter of fact, it represents for a whole generation of civil engineers a set of tools their ancestors would never had dreamed of.
Table 1. References for point cloud processing.
To complete a digital birth using a scan-to-BIM process, several steps are needed and are well identified in the literature. The first part is, obviously, the development of a comprehensive geometrical survey that include all relevant asset elements. To this end, market-driven technological players offer increasingly sophisticated Terrestrial Laser Scanners (TLS). TLS are capable of measuring distances between the sensor and an object at a given space. TLS use two different principles to calculate the distance: Time‐of‐flight (ToF) and Phase Shift (PS). Accuracy, point-density, range and raw data types are important features that require scrutiny by the user. The quality of the data source will affect the realism of the digital asset.
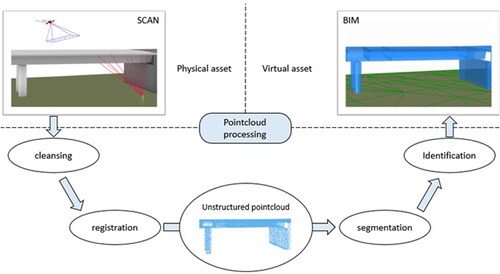
On the other hand, point clouds are expected to be provided by the device in operable form (for instance, lists of coordinates). The point cloud represents a considerably large file with lists of millions of elements. Post-processing of these lists requires programming and computational geometry tools for proper inspection and subsequent use in BIM-friendly platforms. Research has been mostly focused on post-processing algorithms, tools and techniques. Registration, segmentation and identification are steps of this specific process (Wang et al. Citation2020).
When a site/asset is scanned, it is generally performed from different viewpoints. These point clouds require proper alignment into a single reference system by means of a registration process. Common methods for registration are based on the Iterative Closest Points (ICP) algorithm (Besl & McKay, Citation1992). Some of these methods are sensitive to outliers that distort the optimization results. Thus, cleansing tasks such as outlier removal, gap filling and point cloud density balancing are needed to obtain good registration results. On the other hand, ICP-based methods only perform well when adjacent two-point clouds are sufficiently close one another. Optimization functions could erroneously find local minima that do not correspond to correct alignments. Therefore, a common practice is to divide the registration procedure into two steps: (i) a less accurate registration method is performed to roughly align the geometries (coarse registration) and (ii) ICP-based methods are used to improve the initial alignment (fine registration).
After the registration process, a geometric representation of the asset is obtained. The raw point cloud data requires organization. In this form, data is accessible but only about individual, disordered points. Clusters and regions of points are thus required. This step is called segmentation. Points that share geometric features are labelled and then grouped. As a result, regions can now be treated more efficiently. Many algorithms for segmentation are proposed in literature. One may classify these methods into 5 categories: Attribute-based, edge-based, region-based, graph-based and model-based. Wang et al. (Citation2019) presents a thorough review of such methods.
Subsequently, it is necessary to generate semantically rich 3D models. For that purpose, the grouped regions are labelled into object classes, instances, and relations among them (Tang et al. Citation2010). This is called identification. In AEC, these labels are generally associated to Standard BIM elements. Walls, roofs, floors, pipes, beams, columns, etc. Many of these objects are readily available as CAD/BIM objects in commercial Software. Elements are usually identified using human-codified algorithms. Semantic features such as size, position, orientation, topology, and density of the objects within the point cloud are used for this identification. These methods are effective and easy to implement but they are usually site-dependent. Recently, research regarding automated identification techniques is pointing towards the use of supervised and unsupervised deep learning methods. Fully automated, universal scan-to-BIM processes are not yet achieved. However, semi-automated solutions combining well-established manual processing and robust automated routines provide clear advantages when digitizing structural assets. shows the data pipeline with corresponding steps. displays an organization of references from each field of research.
Figure 5. From available point clouds to an IFC-based BIM model.
Thirdly, with the explosion of high-quality cameras, unmanned aerial and ground vehicles and smartphones, massive record of imagery of build assets is expected. Image-to-BIM is understood as the process of generating semantically-rich IFC-based BIM models using a set of images. It is worth pointing out that two steps are identified. The first step corresponds to the generation of a point cloud from image interpretation whereas the second step is the treatment of the point cloud itself (depicted previously). Focusing on the former, interpretation and understanding of visual data using computers is necessary. In a recent survey, Koulalis et al (Citation2022) describe applications, steps and methods of computer vision in the construction domain. Such applications use semantic segmentation, pose and motion estimation, object detection and 3D reconstruction. Thus, semantic information from visual data can then have multiple applications in the AEC sector.
3D reconstruction of assets in outdoor spaces is mostly developed using photogrammetry. Complex structures (from isolated buildings to entire neighborhoods) can be created using a monocular camera sensor based on the concept of Structure from Motion (SfM). The SfM method uses a series of 2D images of an object from a specific area taken by a moving monocular camera sensor as input to extract features and produce high quality 3D structures (Agüera-Vega et al., Citation2018). Market-driven developments with automated SfM process built-in for 3D modelling are available, but in many cases, algorithms and procedures are not disclosed. If many camera sensors are available, multi-view stereo (MVS) algorithms can construct considerably detailed 3D models from images. Input is a huge set of calibrated overlapping images captured from different perspectives, with the ultimate goal to provide implementations of photometric consistency measures, and efficient optimization algorithms. The success of MVS technologies is gaining ground within the AEC sector.
Although more popular in other domains such as robotics, high accuracy Visual Simultaneous Localization and Mapping (VSLAM) are also used. VSLAM relies on real-time mapping of the operating environment by estimating the camera motion and pose. Following the initialization phase, feature matching and tracking algorithms are combined to calculate the camera pose corresponding to the reconstructed map that is updated in real-time. Other methods in contrast to the previously depicted existing methods are featureless. The pixel-to-pixel matching process is avoided. The direct image-based and featureless approach to building modelling from aerial images uses geometric and photometric properties resulting from the perspective projection of planar structures. It delivers a three-dimensional modelling whose results are similar to the ground physical data. summarizes some of the available literature on this subject.
Table 2. References for computer vision methods.
3.3. Techniques and tools for the operation and maintenance of the physical asset
To deploy efficient operations and maintenance plans of infrastructure systems is the ultimate goal of managers. For this purpose, an ideal scenario is to track a sufficiently rich stream of measured information during operation to check for adequate performance. Collecting either too little or too much data can be detrimental. The former may be insufficient for proper analysis whereas the latter may generate more expenses than the managers should afford. In either case, the virtual realm represents an ideal efficient scenario for storing, analyzing, visualizing and using this data. This side of the DT represents the living, easy-to-update instance of the physical asset.
According to the maturity of the DT, the number of layers of information that feed the models provide multiple levels of complexity. In this review, the monitoring techniques available for proper embeddedness within DTs are divided into sensors or contact devices, and non-contact tools based on digital images or remote sensing.
3.3.1. Sensor-based methods
CIRIA (Citation2020) and COST (Citation2019) provide comprehensive descriptions of sensors in AEC. More advanced sensors for application in civil engineering and buildings are reviewed in Das and Saha (Citation2018) and Wu et al. (Citation2022). The health of concrete infrastructures and recent achievements in the field of sensors developed for monitoring are reviewed in Taheri (Citation2019). The focus is on sensors developed for monitoring parameters including concrete temperature, humidity, pH, corrosion rate, and stress/strain. In fact, with these five parameters, most of the damages present in concrete elements can be monitored.
Several authors identify that data collected by sensors for construction management are divided into three main groups:
Structural data: vibrations, strains, displacements or rotations.
Environmental data: temperature, humidity, wind data.
Traffic data: the focus is on collecting traffic loads.
Sensors generally provide data streams with different sample rates. The physical magnitudes are captured as a function of time. Data streams require access. IoT platforms are technologically ready to provide access to data streams robustly. Subsequently, user-intended platforms for visualization (DTs, BMS) can request JSON objects to these IoT platforms with specific arrays of collected data. Web services with data (e.g., environmental) are also technologically ready to provide information about weather or traffic information in right time. describes the most widely used type of sensors with relevant applications and references
Table 3. References for sensor-based SHM deployments.
3.3.2. Image-based methods
One straightforward technique in regular asset inspection is based on the recording of images. Quality control is a crucial aspect in the construction industry. As it is common practice to take several hundreds of pictures for an inspection episode of an asset, one could claim that an enormous database on different damages exists. Images requires systematic organization if one needs to maximize their usefulness. When images are organized, labelled and grouped, high-level understanding from digital images or videos may provide identification of behavior. For this purpose, computational methods can be classified in two approaches: (i) heuristics feature extraction and (ii) deep learning.
Heuristics methods are based on applying thresholds or machine learning classifiers to the output of hand-crafted filters specified for specific damage types. These methods are based on features extracted by pixel intensity around cracks compared to other nearby pixels. On the other hand, Deep learning has evolved considerably when it comes to defect detection for a wide variety of visual defects, from cracks and delamination to corrosion. DL can help detecting cracks by means of classification, localization, or segmentation. shows an overview of use of computer vision based SHM at local (specific location) and global (overall behavior) levels. Classified object databases are required for the development of integrated services for image retrieval. Ideally, these databases should be useful for the owners of the assets as well as for the developers of computer-vision recognition methods.
Table 4. References for CV-based SHM deployments.
3.3.3. Remote sensing
Occasionally, it is neither feasible nor acceptable by owners to deploy contact-based techniques. Remote sensing techniques may fill gaps when it comes to data acquisition. For instance, Terrestrial Laser Scanners, already described in section 3.2, can be used for monitoring. They provide accurate point clouds that can be systematically registered, segmented and identified.
Another technique is RADAR. The acronym reads Radio Detection and Ranging systems. By means of a transmitter, the radio produces an electromagnetic signal that is then propagated into the space by means of antenna. When this signal strikes an object, it gets reflected back. The reflected signal is known to be the echo signal. The receiver then processes the echoed signal. For finding the range of the object, the system uses the time taken by the signal to get reflected. For the target location, an angle is calculated from the direction of the echo signal to the direction where the antenna is pointing. For moving objects, the Doppler Effect is used to calculate the speed and range of such object.
From the perspective of the use of radars with maintenance purposes of assets within the built environment, radar-based specific technologies are often used as a long-range data-gathering technique. With radar techniques, the output from the receiver (for instance, a displacement of a point) requires flowing to user-defined threshold decision systems. The academic review is focused on the following radar techniques only:
Space borne synthetic Aperture Radar (from satellites or airplanes) or SB-SAR.
Ground-based synthetic Aperture Radar (from the ground) or GB-SAR.
For the former, there is a great interest of retrieving data collected by publicly available satellite imagery. The potential information that can be collected by open access hubs such as Copernicus (Citation2022) is substantial. Subsidence, landslides, surface temperature, water levels and many other phenomena associated with both the natural and the built environment can be inferred from space-borne imagery. Programming skills for data extraction from the huge database is necessary.
Ideally, DT platforms should be able to generate specific requests to such data hubs. Results on specific magnitudes can be then embedded in the DT accordingly. For instance, one may request the water level of a river at the specific location of a bridge in recent years. This information may be of interest when developing high-level understanding of the asset. For the latter, with appropriate understanding of the output data (phase angle and time), very accurate positions of reflectometers can be obtained. GB-Radars provide information of position as a function of time. This procedure is suitable for large assets (such as long-spanned bridges) in which specific points are tracked. These points are provided with reflectometers for maximizing accuracy of the measurements. Presently, its use is limited and data-acquisition systems require post-processing with tailor-made Software. collects references for remote-sensing techniques worth embedding in DT platforms.
Table 5. References for remote sensing techniques.
4. Ashvin: Digital Twins as assistants for design, construction and maintenance of infrastructure systems. Demo cases
This research is framed on the H2020 project Ashvin (Citation2020). The projects includes the development of multiple pipelines of information in quite varied types of infrastructure systems. Measurements from the physical realm feed tailor-made DTs of these sites by means of those pipelines in the form of a platform for the end user. The variety of demo cases is crucial for the conception of a comprehensive way of including different types of data. For each of the demonstration project, varied challenges have arisen. The strength of the project is the ability to show various types of structures in different surroundings and conditions.
If the goal for this digitalization is to use such kind of platform to increase productivity, resource efficiency, and safety, a vast array of stakeholders need to provide/receive data seamlessly. Interaction between stakeholders in a more harmonized data-exchange format is key for leveraging the benefits of digitization. Digital data stored in digitally sealed silos may not contribute to improving these interactions anyhow. After examination and understanding of the problems and challenges of those sites face, the development of pipelines is enriched with diverse technologies. One deliverable of the project (Łukaszewska, Citation2021) describes the implementation plan on these demonstration projects. Summarized information is shown in . These demo sites are being under digital twinning (partially or fully) during the development of the project.
Table 6. Summary of Ashvin demo sites, digital files and sensing techniques.
One challenge with this variety is the continuous synchronization, whose rate is use-case dependent. For the case of construction process, data is required in such a way it allows decision-making on a daily or weekly basis. Those decisions within the construction site may improve substantially delays and productivity. On the other hand, for the case of operation phases, the right time for synchronization may be very different, ranging from weeks to years. Planning maintenance and reparation spans a larger time frame. Due to these challenges and the variety of information, Knowledge Graphs (Barrasa, Hodler, & Webber, Citation2021) and accordingly defined ontologies (Khan et al. Citation2022) are being embedded within the DT systems.
5. Requirements and challenges
5.1. Requirements for data gathering tools
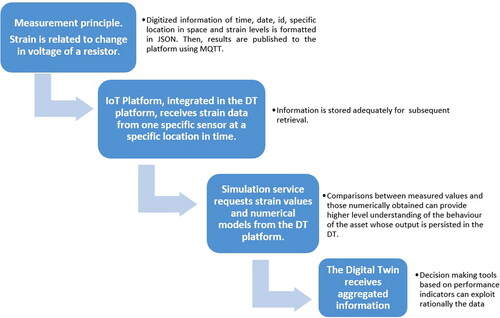
Due to the variety of data sources (sensors, images, remote sensing techniques), there is no such thing as one single pipeline of information from SHM systems to DTs. To illustrate this statement, two examples are described. For instance, data generated with a strain gauge, an analog strain sensor that provides very precise voltage signals, can be directly embedded as a stream of numbers via serial port into a semantically rich 3D model in real-time in a specific computer. However, this requires wires and a computer permanently connected. If one provides vaster generality and practicality for a real asset, the information should flow wirelessly from the sensor to the cloud using available IoT protocols such as Message Queuing Telemetry Transport (MQTT) or Hypertext Transfer Protocol (HTTP). As a result, the information can flow directly from the measured point to the virtual point of the semantically rich model. This particular pipeline of information relates the bits shown in .
Figure 6. A minimal pipeline from strain gauges to an IFC-based DT.
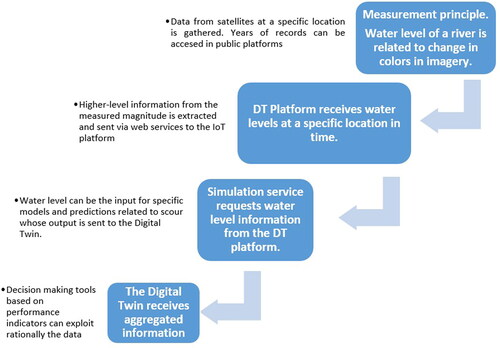
Another example of pipeline can be the retrieval, processing, analysis and use of images taken by satellites. Let us imagine a specific output worth gathering: the water level of a river at the location where piers of bridges are settled. This information may be useful when tracking potential scour-related issues in that asset. The needed output is straightforward: location, time/date and water level, which can be stored in a text format. The sample rate may range from days to weeks, which is enough in this specific example. The pipeline requires in this case considerable levels of automation in the retrieval and corresponding analysis of the satellite images coming from open access hubs. This represents a service in its own with a set of codes, interpretation and use of information as presented in .
Figure 7. A minimal pipeline from satellite imagery to an IFC-based DT.
In all cases, it is required that data-collection techniques (and the corresponding SHM systems as a whole) are embedded in vaster information systems, which presumes a certain degree of accessibility of the data. Encrypted or locked-in data found in some devices does not facilitate its embeddedness. In this article, requirements are identified at two levels, generation of the virtual asset and operation phase. When it comes to the generation of the virtual asset, one may list as requirements:
The reproduction of the asset should ideally follow standard LoDs and formats (e.g., IFC). Thus, further use of the virtual asset and further coupling with measuring techniques is facilitated.
When digitalizing the asset using reality capture techniques, such as photogrammetry or laser-scanning, accessible pointcloud-encoding formats are required for establishing a proper suite of processes such as registration, segmentation and identification of geometries.
When it comes to the operation and maintenance of the asset in which information flows across the physical and virtual realms, one may list as requirements:
5.1.1. Sensors
Individual sensors require precise location and positioning in the asset. In order to feed properly virtual models with measured data, spatial location requires matching in both realms. Virtual elements such as beams, columns or slabs can be enriched in a way (e.g., using IFC tags) that sensors are coupled to those elements. It is thus important to keep track of the real location of the sensors in the virtual realm as well.
Sensors can be classified according to their sample rate. The corresponding treatment is different for high (>10Hz), as accelerometers, or low sample rates (<10Hz) used for environmental measurements. It defines considerations of storage needs and capacities. In addition, edge computing at various levels is often required (the level of a measurement single node or the level of measurement of one asset). Information is processed and only key values are transformed into stored output.
Sensors such as distributed fiber optics provide output for distributed areas of the asset. Ultra-high sample rates (in the range of MHz) are needed when used to measure ultrasonic signals for acoustic emission capabilities. It is also required to precisely locate these devices at the geometrical model. Desirably, interrogators with open API capabilities and seamless access to the data are required for proper integration into DT platforms. Presently, existing commercial Hardware-Software systems of fiber optics lack seamless openness to the data access and as a result, data cannot be retrieved automatically.
5.1.2. Images
Images require replicability when used for maintenance. As a result, cameras require defined locations with sufficient replicability and overlap. Replicability of image-gathering also presumes orderly documentation and storage. Desirably, the spatial location of the camera position together with available photographic metadata enriches the versatility within the DT.
Images provide sensitive data. When it comes to facial recognition and identification of individuals, image gathering presumes proper data anonymization (face blurring, car number blurring). Sensitive data handling and encryption is also needed.
Image gathering is enriched with possibilities provided by UAS. Condition and SHM on a historical basis presumes replicability in time. Then deterioration and maintenance interventions could be evaluated. For instance, UAVs used for inspection deliver imagery that can be used for evaluating the condition of the structures (e.g. cracks, delamination, water leakage, etc.). For replicability, it is necessary to track and to allow reproducibility and traceability of the visual records as well as the corresponding results over time. Flights using UAVs is feasible under replicable conditions nowadays. It is necessary to systematically use software for flight planning. Adjusting critical imaging parameters, such as camera sensor, flying height, ground speed, forward overlap, side overlap, ground pixel size & imaging frame rate can be useful for future purposes. Flight coordinates (for instance, in the form of .srt files) must also be delivered systematically for future data-gathering episodes.
When it comes to data management, accessible object databases are ideal for DT platforms to retrieve requested info by the user.
5.1.3. Remote sensing techniques
Terrestrial Laser Scanners require considerably high data-gathering capabilities. The formats presently used in the industry such as E57 or open csv text files such as .xyz or .ply are considerably populated with information. As a result, the files require specific transmission treatment if handled within IoT platforms.
Successive scans performed in time may provide great value for the behavior of the asset. Replicability is of great importance. Proper registration methods for spatial location and referencing to the point clouds are required.
Results from Ground-based SA-Radars require to be delivered in open formats (csv, for instance). Since a considerable post-processing of the signals is often done using specific Software, it is necessary to embed information in DT platforms in the form of accessible files.
For satellite geospatial data, the use of open access data hubs helps public accessibility. Programming capacities are needed to retrieve specific information of use in asset management.
In a broader sense, several requirements for feeding with data more accurately those virtual replicas are identified:
Redundant information provides robustness to the system.
The SHM system should be able to gather data for a proper damage detection. Identification of incorrect performances or damages as well as their active progression is key but it is heavily dependent of the asset. For forecasting future incorrect performance and for allowing for a proactive and predictive maintenance, data-gathering must be in accordance with these damage detection methods and more importantly, to the future damage detection algorithms that will populate the market after the measurements are taken.
Comprehensiveness is significant. One asset includes many independent pipelines. Many of them may feed specific decision-making processes. The analysis of the gathered data by the SHM system should benefit from many sources of information.
5.2. Challenges
For the sake of developing comprehensive SHM-enabled DT, many challenges are identified:
The main observed challenge is to habilitate different sources of information. All sources of data should be linked to specific yet different indicators of the behavior or condition of the asset. Establishing pipelines of information are challenging. Generating multiple pipelines for the same asset adds complexity.
In the scenario of multiple sources of information, an ecosystem of stakeholders arises. This represents a challenge when it comes to the seamless interaction of agents. For instance, in the public sector, asset managers usually use public tendering for procurement. The acquisition of relevant technologies or the development of tasks involving asset management thus require a comprehensive vision. Interoperable systems need to be properly tendered during procurement.
Systems will increase in robustness and universality when DT platform become ubiquitous. This represents a challenge nowadays. For instance, trained algorithms for better prediction of damage using images imply the existence of first generations of algorithms that are yet under development.
Assets should be digitalized as soon as required. This is a tremendous challenge since nowadays, the vast majority of assets do not have their own virtual twin. However, many assets under inspection are being loosely or partly digitalized, which represents already quite an investment. In order to maximize efficiency in asset management, it would be interesting to use the episodes in which measurements, analysis and decisions are taken, as the episodes in which assets are twinned. Subsequent condition rating episodes may be much more efficiently used.
Advanced sensors must be oriented to simultaneously reduce the power consumption and weight of the SHM system, to resolve deployment problems, and to improve operation facilities and the subsequent data analysis and post-processing.
Different sensors can have different sampling rates, meaning that they produce data at different frequencies. For example, a camera may produce data at 30 frames per second, while another sensor may produce data at 10 frames per second. In such cases, the data from the sensors must be synchronized to ensure that the information is combined correctly.
One approach to dealing with data that comes at different rates is to use interpolation. This involves estimating the missing data points between the measurements provided by each sensor. However, this can introduce errors and may not always be reliable, particularly if there are gaps or delays in the data. Another approach is to use a Kalman filter, which is a mathematical technique for combining noisy measurements to produce a more accurate estimate. The Kalman filter can handle data that comes at different rates by predicting the state of the system at the next time step based on the current state and the measurements from all sensors. Another challenge when dealing with data that comes at different rates is the issue of time synchronization. Different sensors may have different time stamps or time offsets, which must be accounted for to ensure that the data is combined correctly. This can be particularly challenging when dealing with sensors that are located in different locations or are communicating over a network.
The connection between the physical and the virtual systems with such varied natures in the information (including simulation) is crucial. Advanced engineering informatics are called to provide solutions for connecting different types of data that is presently stored in silos. For instance, knowledge graphs represent a feasible alternative for the connection between sources that come from different stakeholders.
6. Conclusions
The DT of an asset requires a robust and distributed source of varied data along the physical twin. Very often, the nature of the incoming data/information is varied and multiple. On the other hand, as in other nervous systems, distributed information requires centralization and processing. The nature of the asset is also very different and multiple data-gathering techniques are often needed. Occasionally, DT requires a massive monitoring capacity. Cost-efficient sensors will be increasingly required. In this article, identification of challenges and requirements of three sources of data have been studied: (i) Sensors, (ii) Images and (iii) Remote-sensing techniques. The research question is how these measuring SHM techniques can be embedded in vaster DT systems.
SHM-enabled DT must provide monitoring data in a way that can be integrated within data models that can guarantee interoperability (ability to effectively, accurately, and consistently communicate and exchange information, within different information technology systems) among digital systems. For an adequate and comprehensive performance of the DT, raw data coming from sensors, images or via remote techniques should be converted into information that can be used for efficient decision-making. Establishing Pipelines of information are thus useful. Raw data is post-processed, analyzed and converted into valuable performance indicators and as ideally established in decision making tools. The pipeline is in full accordance with SHM principles.
A set of technical requirements involving data gathering, data formats and data use are dissected for different sources of information. These requirements are of the utmost importance for asset managers who usually perform procurement. Guaranteeing proper interoperability implies establishing Standard requirements for the technology providers. The requirements identified in this article can be used and then refined in more specific assets.
On the other hand, big challenges are identified. Automating pipelines from multiple sources of information on the same asset is still at developmental stages. The next generation of virtual replica will be in better shape for robustness and universality. In the coming years, the integration of agents of the vast ecosystem with aggregated information will allow a seamless interaction between multiple stakeholders. Hitherto, this interaction remains a challenge since technology is ready for isolated measurements but not for integrated systems.
One specific asset may provide dozens of pipelines. Some of these pipelines can provide crucial information for a specific performance indicator. Many others, though, require to be adequately aggregated using fusion methods to properly feed a specific indicator. Ideally, the more information is gathered, the better. It is worth pointing out though, that over measuring the physical model may be counterproductive. The focus should remain on outputs that are relevant to check possible malfunctions of the system or that are necessary for the simulation/prediction of future performance. In this sense, the measuring system should provide to the virtual replica the necessary input data to accurately derive the indicators of interest. End users will be key players on the development of tailor-made, meaningful performance indicators for their specific DT assets in the years to come. Accordingly, DTs will evolve considerably in the following years in the construction sector.
Disclosure Statement
No potential conflict of interest was reported by the author(s).
Additional information
Funding
References
- Abbas, Y., Have, B., Hoekstra, G., Douma, A., de Bruijn, D., Olthuis, W., & Van den Berg, A. (2015). Connecting to concrete: Wireless monitoring of chloride ions in concrete structures. Procedia Engineering, 120, 965–968. doi:10.1016/j.proeng.2015.08.827
- Abdeljaber, O., Avci, O., Kiranyaz, M. S., Boashash, B., Sodano, H., & Inman, D. J. (2018). 1-D CNNs for structural damage detection: Verification on a structural health monitoring benchmark data. Neurocomputing, 275, 1308–1317. doi:10.1016/j.neucom.2017.09.069
- Agüera-Vega, F., Carvajal-Ramírez, F., Martínez-Carricondo, P., Sánchez-Hermosilla López, J., Mesas-Carrascosa, F. J., García-Ferrer, A., & Pérez-Porras, F. J. (2018). Reconstruction of extreme topography from UAV structure from motion photogrammetry. Measurement, 121, 127–138. doi:10.1016/j.measurement.2018.02.062
- Akanbi, T., & Zhang, J. (2022). Framework for developing IFC-based 3D documentation for 2D bridge drawings. Journal of Computing in Civil Engineering, 36(1), 040021031. doi:10.1061/(ASCE)CP.1943-5487.0000986
- Ali, R., Chuah, J. H., Abu Talip, M., Mokhtar, N., & Shoaib, M. (2022). Structural crack detection using deep convolutional neural networks. Automation in Construction, 133, 103989. doi:10.1016/j.autcon.2021.103989
- Alonso, M. C., & Puentes, J. (2020). Self-compacted concrete with self-protection and self-sensing functionality for energy infrastructures. Materials, 13, 1106. doi:10.3390/ma13051106
- Alwis, L. S. M., Bremer, K., & Roth, B. (2021). Fiber optic sensors embedded in textile-reinforced concrete for smart structural health monitoring: A review. Sensors, 21(15), 4948. doi:10.3390/s21154948
- Artese, S., & Zinno, R. (2020). TLS for dynamic measurement of the elastic line of bridges. Applied Sciences, 10(3), 1182. doi:10.3390/app10031182
- Ashvin. (2020). Assistants for healthy, safe, and productive virtual construction design, operation & maintenance using a Digital Twin. H2020 Research and Innovation Action. www.ashvin.eu.
- Azimi, M., & Pekcan, G. (2020). Structural health monitoring using extremely compressed data through deep learning. Computer-Aided Civil and Infrastructure Engineering, 35(6), 597–614. doi:10.1111/mice.12517
- Bado, M., & Casas, J. R. (2021). A review of recent distributed optical fiber sensors applications for civil engineering structural health monitoring. Sensors, 21(5), 1818. doi:10.3390/s21051818
- Barrasa, J., Hodler, A. E., & Webber, J. (2021). Knowledge graphs. Data in context for responsive businesses. California: O'Reilly Media, Inc.
- Barrias, A., Casas, J. R., & Villalba, S. (2016). A review of distributed optical fiber sensors for civil engineering applications. Sensors, 16(5), 748. doi:10.3390/s16050748
- Besl, P., & McKay, H. (1992). A method for registration of 3-D shapes. IEEE Transactions on Pattern Analysis and Machine Intelligence, 14(2), 239–256. doi:10.1109/34.121791
- Bolton, A., Butler, L., Dabson, I., Enzer, M., Evans, M., Fenemore, T., & Harradence, F. (2018). Gemini Principles. (CDBB_REP_006). doi:10.17863/CAM.32260
- Bueno, M., Bosché, F., González-Jorge, H., Martínez-Sánchez, J., & Arias, P. (2018). 4-Plane congruent sets for automatic registration of as-is 3D point clouds with 3D BIM models. Automation in Construction, 89, 120–134. doi:10.1016/j.autcon.2018.01.014
- Cabaleiro, M., Riveiro, B., Arias, P., & Caamaño, J. C. (2016). Algorithm for the analysis of deformations and stresses due to torsion in a metal beam from LIDAR data. Structural Control and Health Monitoring, 23(7), 1032–1046. doi:10.1002/stc.1824
- Cha, G., Park, S., & Oh, T. (2019). A terrestrial lidar-based detection of shape deformation for maintenance of bridge structures. Journal of Construction Engineering and Management, 145(12), 04019075. doi:10.1061/(ASCE)CO.1943-7862.0001701
- Chacón, R., Posada, H., Toledo, A., & Gouveia, M. (2018). Development of IoT applications in civil engineering classrooms using mobile devices. Computer Applications in Engineering Education, 26(5), 1769–1781. doi:10.1002/cae.21985
- Chacón, R., Puig-Polo, C., & Real, E. (2021). TLS measurements of initial imperfections of steel frames for structural analysis within BIM-enabled platforms. Automation in Construction, 125, 103618. doi:10.1016/j.autcon.2021.103618
- Chu, C., Ghrib, F., & Cheng, S. (2021). Cable tension monitoring through feature-based video image processing. Journal of Civil Structural Health Monitoring, 11(1), 69–84. doi:10.1007/s13349-020-00438-9
- CIRIA. (2020). Structural Health Monitoring in Civil Engineering. CIRIA Report C788. London
- Copernicus. (2022). Open access hub. https://scihub.copernicus.eu/.
- COST. (2019). Report of the innovation subgroup of COST action TU 1406. Brussels. https://www.cost.eu/actions/TU1406/.
- D’Amico, F., Gagliardi, V., Bianchini Ciampoli, L., & Tosti, F. (2020). Integration of InSAR and GPR techniques for monitoring transition areas in railway bridges. NDTE and E International, 115, 102291. doi:10.1016/j.ndteint.2020.102291
- Dallasega, P., Rauch, E., & Linder, C. (2018). Industry 4.0 as an enabler of proximity for construction supply chains: A systematic literature review. Computers in Industry, 99, 205–225. doi:10.1016/j.compind.2018.03.039
- Das, S., & Saha, P. (2018). A review of some advanced sensors used for health diagnosis of civil engineering structures. Measurement, 129, 68–90. doi:10.1016/j.measurement.2018.07.008
- Davila-Delgado, J. M., & Oyedele, L. (2021). Digital Twins for the built environment: Learning from conceptual and process models in manufacturing. Advanced Engineering Informatics, 49, 101332. doi:10.1016/j.aei.2021.101332
- Dong, C. Z., & Catbas, F. (2021). A review of computer vision–based structural health monitoring at local and global levels. Structural Health Monitoring, 20(2), 692–743. doi:10.1177/14759217209355
- Feng, D., Feng, M. Q., Ozer, E., & Fukuda, Y. (2015). A vision-based sensor for noncontact structural displacement measurement. Sensors (Basel, Switzerland), 15(7), 16557–16575. doi:10.3390/s150716557
- Fuentes-Pacheco, J., Ascencio, J., & Rendon-Mancha, J. (2015). Visual simultaneous localization and mapping: A survey. Artificial Intelligence Review, 43(1), 55–81. doi:10.1007/s10462-012-9365-8
- Furferi, R., Governi, L., Palai, M., & Volpe, Y. (2010). From 2D orthographic views to 3D Pseudo-Wireframe: An automatic procedure. International Journal of Computer Applications, 5(6), 18–24. doi:10.5120/918-1296
- Furukawa, Y., & Hernández, C. (2013). Multi-View Stereo: A Tutorial. Foundations and Trends in Computer Graphics and Vision, 9(1–2):1–148. doi:10.1561/0600000052
- Futai, M., Bittencourt, T., Carvalho, H., & Ribeiro, D. (2022). Challenges in the application of digital transformation to inspection and maintenance of bridges. Structure and Infrastructure Engineering, 18(10-11), 1581–1600. doi:10.1080/15732479.2022.2063908
- Gimenez, L., Robert, S., Suard, F., & Zreik, K. (2016). Automatic reconstruction of 3D Building models from scanned 2D floor plans. Automation in Construction, 63, 48–56. doi:10.1016/j.autcon.2015.12.008
- Hammoudi, K., & Dornaika, F. (2011). A featureless approach to 3D polyhedral building modeling from aerial images. Sensors (Basel, Switzerland), 11(1), 228–259. doi:10.3390/s110100228
- Hiasa, S., Birgul, R., Matsumoto, M., & Catbas, N. (2018). Experimental and numerical studies for suitable infrared thermography implementation on concrete bridge decks. Measurement, 121, 144–159. doi:10.1016/j.measurement.2018.02.019
- Hiasa, S., Catbas, N., Matsumoto, M., & Mitani, K. (2017). Considerations and issues in the utilization of infrared thermography for concrete bridge inspection at normal driving speeds. Journal of Bridge Engineering, 22(11), 1–12. doi:10.1061/(ASCE)BE.1943-5592.0001124
- Huang, Q., Wang, Y., Luzi, G., Crosetto, M., Monserrat, O., Jiang, J., … Ding, Y. (2020). Ground-based radar interferometry for monitoring the dynamic performance of a multitrack steel truss high-speed railway bridge. Remote Sensing, 12(16), 2594. doi:10.3390/rs12162594
- Isailović, D., Stojanovic, V., Trapp, M., Richter, R., Hajdin, R., & Döllner, J. (2020). Bridge damage: Detection, IFC-based semantic enrichment and visualization. Automation in Construction, 112, 103088. doi:10.1016/j.autcon.2020.103088
- Jiang, F., Ding, Y., Song, Y., Geng, F., & Wang, Z. (2022). Digital twin-driven framework for fatigue lifecycle management of steel bridges. Structure and Infrastructure Engineering, 1–21. doi:10.1080/15732479.2022.2058563
- Khan, R., Tomar, R., Hartmann, T., Ungureanu, L., Chacón, R., & Ibrahim, A. (2022). Platology: A digital twin ontology suite for the complete lifecycle of infrastructure. International Workshop on Intelligent Computing in Engineering. doi:10.7146/aul.455.c219
- Kim, H., & Kim, C. (2020). Deep-learning-based classification of point clouds for bridge inspection. Remote Sensing, 12(22), 3757. doi:10.3390/rs12223757
- Kim, H., & Kim, C. (2021). 3D as-built modeling from incomplete point clouds using connectivity relations. Automation in Construction, 130, 103855. doi:10.1016/j.autcon.2021.103855
- Koulalis, I., Dourvas, N., Triantafyllidis, T., Ioannidis, K., Vrochidis, S., & Kompatsiaris, I. (2022). A survey for image based methods in construction: From images to digital twins. In 19th International Conference on Content-based Multimedia Indexing. doi:10.1145/3549555.3549594
- Lu, Q., Chen, L., Li, S., & Pitt, M. (2020). Semi-automatic geometric digital twinning for existing buildings based on images and CAD drawings. Automation in Construction, 115, 103183. doi:10.1016/j.autcon.2020.103183
- Łukaszewska, A. (2021). D7.1 Ashvin Technology Demonstration plan. Zenodo. doi:10.5281/zenodo.5542985
- Malekjafarian, A., McGetrick, P. J., & OBrien, E. J. (2015). A review of indirect bridge monitoring using passing vehicles. Shock and Vibration, 2015, 1–16. doi:10.1155/2015/286139
- Mei, Q., Gül, M., & Boay, M. (2019). Indirect health monitoring of bridges using Mel-frequency cepstral coefficients and principal component analysis. Mechanical Systems and Signal Processing, 119, 523–546. doi:10.1016/j.ymssp.2018.10.006
- Mistretta, F., Sanna, G., Stochino, F., & Vacca, G. (2019). Structure from motion point clouds for structural monitoring. Remote Sensing, 11(16), 1940. doi:10.3390/rs11161940
- Morgenthal, G., Rau, S., Taraben, J., & Abbas, T. (2018). Determination of stay-cable forces using highly mobile vibration measurement devices. Journal of Bridge Engineering, 23(2), 04017136. doi:10.1061/(ASCE)BE.1943-5592.0001166
- NIC. (2017). Data as infrastructure – paper for the National Infrastructure Commission. National Infrastructure Commission, London, UK.
- Olaszek, P., Casas, J. R., & Świt, G. (2016). On-site assessment of bridges supported by acoustic emission. Proceedings of the Institution of Civil Engineers - Bridge Engineering, 169(2), 81–92. doi:10.1680/jbren.15.00007
- Omar, T., & Nehdi, M. L. (2017). Remote sensing of concrete bridge decks using unmanned aerial vehicle infrared thermography. Automation in Construction, 83, 360–371. doi:10.1016/j.autcon.2017.06.024
- Omer, M., Margetts, L., Hadi Mosleh, M., Hewitt, S., & Parwaiz, M. (2019). Use of gaming technology to bring bridge inspection to the office. Structure and Infrastructure Engineering, 15(10), 1292–1307. doi:10.1080/15732479.2019.1615962
- Perez-Perez, Y., Golparvar-Fard, M., & El-Rayes, K. (2021). Scan2BIM-NET: Deep learning method for segmentation of point clouds for scan-to-BIM. Journal of Construction Engineering and Management, 147(9), 1–14. doi:10.1061/(ASCE)CO.1943-7862.0002132
- Pieraccini, M., Miccinesi, L., Abdorazzagh Nejad, A., Nejad, N., & Fard, A. (2019). Experimental dynamic impact factor assessment of railway bridges through a radar interferometer. Remote Sensing, 11(19), 2207. doi:10.3390/rs11192207
- Pierdicca, R., Paolanti, M., Matrone, F., Martini, M., Morbidoni, C., Malinverni, E. S., … Lingua, A. (2020). Point cloud semantic segmentation using a deep learning framework for cultural heritage. Remote Sensing, 12(6), 1005. doi:10.3390/rs12061005
- Ponzo, F. C., Iacovino, C., Ditommaso, R., Bonano, M., Lanari, R., Soldovieri, F., … Rompato, M. (2021). Transport infrastructure SHM using integrated SAR data and on-site vibrational acquisitions:“Ponte Della Musica–Armando Trovajoli” case study. Applied Sciences, 11(14), 6504. doi:10.3390/app11146504
- Pregnolato, M., Gunner, S., Voyagaki, E., de Risi, R., Carhart, N., Gavriel, G., … Taylor, C. (2022). Towards Civil Engineering 4.0: Concept, workflow and application of Digital Twins for existing infrastructure. Automation in Construction, 141, 104421. doi:10.1016/j.autcon.2022.104421
- Pu, S., & Vosselman, G. (2009). Knowledge based reconstruction of building models from terrestrial laser scanning data. ISPRS Journal of Photogrammetry and Remote Sensing, 64(6), 575–584. doi:10.1016/j.isprsjprs.2009.04.001
- Qin, X., Ding, X., Liao, M., Zhang, L., & Wang, C. (2019). A bridge-tailored multi-temporal DInSAR approach for remote exploration of deformation characteristics and mechanisms of complexly structured bridges. ISPRS Journal of Photogrammetry and Remote Sensing, 156, 27–50. doi:10.1016/j.isprsjprs.2019.08.003
- Rashidi, A., & Brilakis, I. (2016). Point cloud data cleaning and refining for 3d as-built modeling of built infrastructure. Construction Research Congress. May 31–June 2, 2016 | San Juan, Puerto Rico. doi:10.1061/9780784479827.093
- Rusu, R. B., Blodow, N., & Beetz, M. (2009). Fast point feature histograms (FPFH) for 3D registration. In IEEE International Conference on Robotics and Automation, 3212–3217. doi:10.1109/ROBOT.2009.5152473
- Schlögl, M., Widhalm, B., & Avian, M. (2021). Comprehensive time-series analysis of bridge deformation using differential satellite radar interferometry based on Sentinel-1. ISPRS Journal of Photogrammetry and Remote Sensing, 172, 132–146. doi:10.1016/j.isprsjprs.2020.12.001
- Selleck, R., Cattani, M., & Hassall, M. (2023). Proposal for and validation of novel risk-based process to reduce the risk of construction site fatalities (Major Accident Prevention (MAP) program). Safety Science, 158, 105986. doi:10.1016/j.ssci.2022.105986
- Shim, C., Dang, N., Lon, S., & Jeon, C. (2019). Development of a bridge maintenance system for prestressed concrete bridges using 3D digital twin model. Structure and Infrastructure Engineering, 15(10), 1319–1332. doi:10.1080/15732479.2019.1620789
- Shin, H. K., Ahn, Y. H., Lee, S. H., & Kim, H. Y. (2020). Automatic concrete damage recognition using multi-level attention convolutional neural network. Materials, 13(23), 5549. doi:10.3390/ma13235549
- Shirzad-Ghaleroudkhani, N., Mei, Q., & Gül, M. (2020). Frequency identification of bridges using smartphones on vehicles with variable features. Journal of Bridge Engineering, 25(7), 04020041. doi:10.1061/(ASCE)BE.1943-5592.0001565
- Taheri, S. (2019). A review on five key sensors for monitoring of concrete structures. Construction and Building Materials, 204, 492–509. doi:10.1016/j.conbuildmat.2019.01.172
- Tang, P., Huber, D., Akinci, B., Lipman, R., & Lytle, A. (2010). Automatic reconstruction of as-built building information models from laser-scanned point clouds: A review of related techniques. Automation in Construction, 19(7), 829–843. doi:10.1016/j.autcon.2010.06.007
- Theiler, P. W., Wegner, J. D., & Schindler, K. (2014). Keypoint-based 4-points congruent sets–automated marker-less registration of laser scans. ISPRS Journal of Photogrammetry and Remote Sensing, 96, 149–163. doi:10.1016/j.isprsjprs.2014.06.015
- Tonelli, D., Luchetta, M., Rossi, F., Migliorino, P., & Zonta, D. (2020). Structural health monitoring based on acoustic emissions: Validation on a prestressed concrete bridge tested to failure. Sensors, 20(24), 7272. doi:10.3390/s20247272
- Villacorta, J., Del-Val, L., Martínez, R., Balmori, J. A., Magdaleno, A., López, G., … Basterra, L. A. (2021). Design and validation of a scalable, reconfigurable and low-cost structural health monitoring system. Sensors, 21(2), 648. doi:10.3390/s21020648
- Wang, Y., Sun, Y., Liu, Z., Sarma, S. E., Bronstein, M. M., & Solomon, J. M. (2019). Dynamic graph CNN for learning on point clouds. ACM Transactions on Graphics, 38(5), 1–12. doi:10.1145/3326362
- Wang, Q., Tan, Y., & Mei, Z. (2020). Computational methods of acquisition and processing of 3d point cloud data for construction applications. Archives of Computational Methods in Engineering, 27(2), 479–499. doi:10.1007/s11831-019-09320-4
- Watase, A., Birgul, R., Hiasa, S., Matsumoto, M., Mitani, K., & Catbas, F. N. (2015). Practical identification of favorable time windows for infrared thermography for concrete bridge evaluation. Construction and Building Materials, 101, 1016–1030. doi:10.1016/j.conbuildmat.2015.10.156
- Wu, Q., Okabe, Y., & Yu, F. (2018). Ultrasonic structural health monitoring using fiber bragg grating. Sensors, 18(10), 3395. doi:10.3390/s18103395
- Wu, C., Wu, P., Wang, J., Jiang, R., Chen, M., & Wang, X. (2022). Critical review of data-driven decision-making in bridge operation and maintenance. Structure and Infrastructure Engineering, 18(1), 47–70. doi:10.1080/15732479.2020.1833946
- Xing, C., Wang, P., & Dong, W. (2020). Research on the bridge monitoring method of ground-based radar. Arabian Journal of Geosciences, 13(23), 1–10. doi:10.1007/s12517-020-06283-w
- Xiong, S., Wang, C., Qin, X., Zhang, B., & Li, Q. (2021). Time-series analysis on persistent scatter-interferometric synthetic aperture radar (PS-InSAR) derived displacements of the Hong Kong–Zhuhai–Macao Bridge (HZMB) from Sentinel-1A observations. Remote Sensing, 13(4), 546. doi:10.3390/rs13040546
- Yang, B., Liu, B., Zhu, D., Zhang, B., Wang, Z., & Lei, K. (2020). Semiautomatic structural BIM-model generation methodology using CAD construction drawings. Journal of Computing in Civil Engineering, 34(3), 04020006. doi:10.1061/(ASCE)CP.1943-5487.0000885
- Yao, Y., Ellen, S. T., & Glisic, B. (2014). Crack detection and characterization techniques—An overview. Structural Control and Health Monitoring, 21(12), 1387–1413. doi:10.1002/stc.1655
- Zhou, S., Sheng, W., Deng, F., Wu, X., & Fu, Z. (2017). A novel passive wireless sensing method for concrete chloride ion concentration monitoring. Sensors, 17(12), 2871. doi:10.3390/s17122871