
 ?Mathematical formulae have been encoded as MathML and are displayed in this HTML version using MathJax in order to improve their display. Uncheck the box to turn MathJax off. This feature requires Javascript. Click on a formula to zoom.
Abstract
Bridges are deteriorating, and their safety must be continuously assessed. Efficient management of bridges is essentially about making decisions on maintenance activities in line with the decision maker’s preferences. In other words, structural safety should be ensured while optimally allocating resources. In theory, methods are available for solving this complex task; however, they have not yet been implemented by bridge owners. In this study, the implementation into practice is facilitated by presenting a consistent framework for rational decision-making. It is argued that structural assessment is a decision problem that infrastructure owners are obliged to take responsibility for. Bayesian decision theory is presented as the theoretically ideal decision-making framework. The main components of the framework—representations of structural reliability and failure consequences—are discussed in detail, and human safety constraints are integrated. For demonstration purposes, the decision-making framework is applied to two case studies. In addition, it is parameterised by the relative cost of the intervention to failure and the current failure probability to be applicable for any assessment situation. In that way, this study contributes to more efficient maintenance of single bridges and the development of generally applicable structural codes for assessing existing structures.
1. Introduction
Most bridges are robust structures that are conservatively designed. However, with increasing traffic loads and possible deterioration, it is not clear that existing bridges still provide sufficient safety to society. Standards, such as the Eurocodes regulate the design of new structures to ensure structural safety. For existing structures, the bridge owner has to deal with the safety assessment without such thorough support. In the best case, bridge owners rely on internal or national guidelines with rules and requirements based on experience and best practices for inspection and assessment. The implicit approval of safety in the silent act of keeping bridges open for traffic needs support in the form of a decent maintenance strategy.
The general trend in maintenance is to adopt condition-based and predictive maintenance strategies instead of corrective and pre-determined ones. By linking the decisions to the structural performance, inspection intervals can be adjusted to reflect the current and predicted condition, and targeted maintenance interventions can be carried out proactively instead of scheduling inspections with a fixed time interval and carrying out heavy maintenance as a reaction to failure. Bridge owners should follow this path to spend resources more efficiently.
The differences in the assessment situation compared to the design situation emphasise the need for special treatment of assessment in structural standards. The decision space is entirely different for the two situations. While the design engineer seeks support on the decisions on structural configuration, cross-section geometry, and material properties, the assessment engineer needs support on the actions to take, e.g. repair, replacement, or traffic restriction. In fact, the binary evaluation of whether the bridge is safe is only possible when related to the effort to increase safety. Typically, the option to increase safety is much more demanding and costly for an existing structure, meaning that the safety requirements may be relaxed. Similarly, the current bridge is associated with significant past investments and has potential present value for society. This makes it favourable to continue utilising the existing structure, which is not an option when building a bridge at a location where there was no bridge before. In addition, the uncertainties and available information are different, some in a favourable, some in an unfavourable way, which also limits the validity of design standards for existing structures.
To conclude, the risk that ageing infrastructures inevitably expose us to must be addressed. A new bridge will always be the safest option but cannot be the default option. It does not align with the urgent need to drastically decrease the environmental impact of the construction industry, as communicated in various European and international policy documents, e.g. by the European Environment Agency (Citation2019), the European Commission (Citation2019, Citation2020), and the United Nations (Citation2015). It will also not be economically feasible as the number of structures requiring assessment increases. This viewpoint contrasts ‘vision zero’-approaches. It does not aim to eliminate the risk but to minimise the total risk and the expected number of fatalities over the bridge stock with limited resources. It follows that there is a need for proper methods to efficiently sort out the structures that can continue to be used from those that are not worthwhile preserving.
Two typical decision situations are utilised to illustrate the argumentation in this paper. The first considers Herøysund Bridge, a post-tensioned, reinforced concrete multi-span bridge with ongoing corrosion. The second example is the Osvold Bridge, a short concrete slab bridge. Asphalt, with a thickness of 70 cm, has been reported to cover the bridge. What should the bridge manager do with these bridges? How should the new information be interpreted, and what mitigation actions are appropriate? An accurate comparison of different decision alternatives requires a rational framework.
In 2002, Faber (Citation2002) argued that risk-based inspection had reached the level of maturity to be ready for efficient implementation into practice. Yet, in bridge management, this implementation has not been successful. Decision-makers responsible for the maintenance of bridges hardly think about optimal decisions emerging from an analysis of failure probabilities and utilities. Instead, they use experience and more superficial decision support as capacity assessment utilisation ratios and reports and ratings from inspections. This paper discusses how the gap between current practice and the theoretically ideal Bayesian decision-making framework can be closed. This contribution is a crucial step towards simplified methods based on a rigorous scientific basis for sustainable bridge maintenance.
2. Background
The fundamental task in bridge maintenance is to assess the structural performance of bridges and to make decisions on maintenance interventions based on that. illustrates principally how the structural performance changes throughout the service life of a structure. Ideally, it is predicted already at the design stage, and the prediction is updated as new information becomes available. Inspection data may indicate a higher deterioration rate than anticipated, or a new vehicle class may be introduced, resulting in an instant change. When the structural performance passes a criterion, a suitable intervention is performed. If the structural performance is uncertain, better precision and accuracy can be acquired by doing experiments. This conceptual description is well agreed upon; see, e.g. JCSS (Citation2001b); Melchers (Citation2001).
Figure 1. Schematic figure of structural performance prediction during service life.
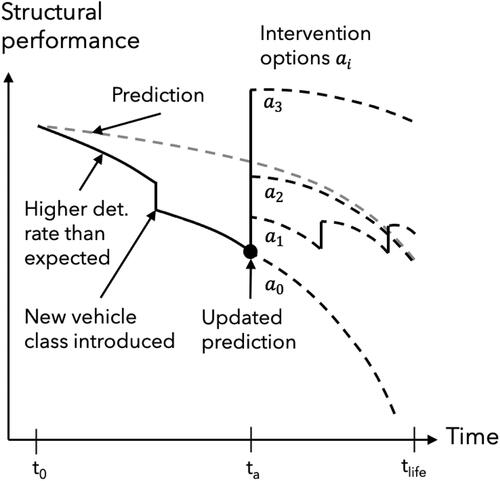
Two essential questions remain: What quantity should the structural performance be represented by, and what should the assessment criterion, the limit for taking action, be? In current bridge maintenance practice, the measures are inspection ratings and utilisation ratios. The criterion is set by engineering judgment and ranges from the conservative approach that every change compared to the design situation must be avoided to the optimistic approach that nothing can threaten the integrity of bridges. The proper answer is somewhere between, and the limit can be specified as demonstrated in this study. To be able to specify consistent criteria, the appropriate measures of the condition are structural reliability and risk.
To place the proposed method into a context, possible assessments are arranged in , categorised according to the level of detail of limit state and verification format. This table is a general version of a scheme presented by Liljefors and Köhler (Citation2023). The first row and first column contain the deterministic inspection rating. This superficial assessment is typically a classification on a scale of one to five resulting from a visual inspection of the bridge elements. Representing structural safety with an ultimate limit state allows for semi-probabilistic assessment with partial safety factors or the more sophisticated probabilistic and risk-based verification formats. As indicated in the last row, when the ultimate limit state is complex, using the semi-probabilistic verification format may not be sufficient. Here, complex means that the situation is not covered by regular design standards, either by the use of advanced mechanical models, by inclusion of deterioration, or other situations that go beyond the scope of design standards.
Table 1. Assessment failure criteria for increased level of detail of verification format and limit state.
illustrates the hierarchical relationship between the assessment formats in line with ISO 2394 (Citation2015). The risk-based format (or Bayesian decision-making), which is the focus of this article, is the highest level and explicitly includes uncertainties and consequences. The simpler verification formats can be derived from the risk-based format. Conservative and generalised assumptions about the consequences enable the transition from risk to reliability. Similarly, shifting from reliability to semi-probabilistic requires generalisations of the uncertainties with conservative assumptions. Each simplification step implicates a reduction in dimensions in which accuracy and precision are lost. For the design situation, code makers argue that the loss is slight compared to the benefit gained from the easy-to-use methods. For the assessment situation, this may not be the case.
The European COST action TU1406 (Strauss, Mandic, Matos, & Casas, Citation2016) aimed to harmonise and advance structural performance assessment of road bridges through quality control plans with a set of key performance indicators (KPIs) and performance goals. The identified KPIs were reliability, availability, safety, economy, and environment. The indicator reliability ranged from deterministic visual inspection ratings to (probabilistic) structural reliability. Following the conclusion of COST TU1406, an expert group within the International Association for Bridge and Structural Engineering (IABSE) investigated to which extent the results were up-taken in practice (Strauss et al., Citation2023). Through surveys and interviews, the basis for decision-making among 23 bridge managers was reviewed. Despite the risk of subjectivity and inaccuracy in self-reported surveys, it indicates the current practice in bridge management.
The KPIs defined by the COST TU1406 project are not yet well-recognised by bridge managers, as they reported overlapping KPIs. Condition ratings at element and bridge levels are still the most used method for assessment, with five condition states being the most common number. Limit state checks are seen as a compliment when condition ratings indicate unsatisfactory performance. Only one respondent specified probabilistic assessment as an option, and risk-based methods are rarely used. Deterioration and intervention modelling is adopted by half of the bridge managers, but the level of sophistication of the models is not revealed. The importance of this holistic work to harmonise assessment methods with standardised quality control plans is acknowledged, but the superior measure for structural performance must be structural reliability.
In the realm of bridge maintenance optimisation, other contributions have emerged, primarily revolving around frameworks employing condition ratings in tandem with rudimentary deterioration and intervention models. These contributions focus on the optimisation aspect of the problem and employ various tools, such as machine learning and multi-attribute decision analysis (as seen in Jaafaru and Agbelie Citation2022), Bayesian networks (as discussed in Zhang and Marsh Citation2021), and Markov decision processes (as presented in the work of Morato, Papakonstantinou, Andriotis, Nielsen, and Rigo Citation2022). Notably, these approaches often lack a direct linkage to the concept of structural reliability. Structural reliability is the ultimate function of structures and is the superior way to quantify structural performance. Structural reliability methods have been utilised extensively in research on existing bridges (Casas, Citation2011; Enevoldsen, Citation2011; Faber, Citation2000; Frangopol, Kong, & Gharaibeh, Citation2001; Jacinto, Neves, & Santos, Citation2016; Matos et al., Citation2019; Parmiani & Orta, Citation2022). A recurring problem in these studies is the selection of a reliability threshold. It is often done in a somewhat arbitrary manner, such as referring to tentative values in JCSS (Citation2001a), while this study is devoted to the establishment of coherent reliability criteria for taking action.
Bayesian decision-making provides a general framework for making optimal decisions based on probabilities, information, and utilities according to specified preferences. Risk-based optimisation of structures can be seen as a decision problem that can be applied both in design and assessment. For design, the decision problem considers the choice of design parameters; For assessment, it is about deciding on strategies for inspection and maintenance. A comprehensive showcase of Bayesian decision analysis for the optimisation of inspection and repair of concrete structures was presented by Vereecken, Botte, Lombaert, and Caspeele (Citation2020). The pre-posterior decision analysis was extended to include time-dependent and spatially distributed structural reliability, facilitating the choice of inspection method. However, they assume repairs occur at a fixed reliability threshold. Our study complements this by optimising the threshold for taking action.
3. The framework
This section presents a framework based on Bayesian decision-making adapted to support bridge maintenance. The representation of structural performance and the modelling of the effect of interventions on this representation will be discussed. Guidance on quantification of failure consequences and how to deal with human safety is provided, and approaches for the time horizon are presented.
3.1. Bayesian decision theory
Bayesian decision theory is a mathematical framework for making decisions under uncertainties consistent with the decision maker’s preferences. Possible decision alternatives are identified, and the possible outcomes are evaluated as expected utilities based on probabilities and consequences. The decision with the highest expected utility is the best one. The foundation for Bayesian decision-making is the utility theory formulated in the game theory domain by Von Neumann and Morgenstern (Citation1947) in the 1940s. The topic is well explained, e.g. by Raiffa and Schlaifer (Citation1961) in economics and by Benjamin and Cornell (Citation1970) in the civil engineering context.
There are three types of decision analyses—the prior, posterior, and pre-posterior decision analyses, all illustrated in . The most simple decision analysis, the prior, consists of two sets of branches with the decision node actions a and the chance node states It can be extended to a posterior decision analysis when additional information becomes available from experiments as one realisation of the chance node outcomes z. Posterior probabilities for the state, conditional on this new information, are calculated using Bayes’ theorem, weighing prior probabilities with likelihoods for observing the data. By including a decision node for potential experiments e, a pre-posterior decision analysis is formed, where the optimal experiment can be found by weighing the potential value it may provide against the cost of performing the experiment.
Figure 2. Bayesian decision-making framework.
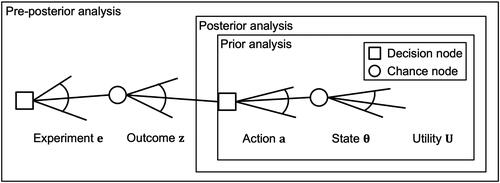
This framework relies on sufficiently accurate representations of the uncertain state of the structure and the effect of possible actions on this state. Structural reliability is a strong candidate for representing the uncertain state in terms of failure or no failure. In addition, the decision maker’s preferences must be clearly understood and stated in the analysis. The preferences are represented by utilities for failure and no failure. As the road administration serves the public, the bridge managers should act on behalf of society, letting their preferences coincide with society’s preferences.
3.2. Structural reliability
The uncertain state of the structure, is represented by structural reliability. A structural reliability analysis consists of one or a combination of several limit state functions, which form a boundary between the safe domain and the failure domain based on probabilistic representations of load and resistance. The limit state functions are mechanical and empirical relationships between variables whose uncertainties are accounted for explicitly. With conventional methods, such as FORM/SORM or Monte Carlo simulations, the analysis results in a reliability index β, or a probability of failure
where
is the standardised normal distribution function. The probability of failure is the probability of the structure being in the failure domain during a specified reference period. For a thorough presentation of this matter, see e.g. Melchers and Beck (Citation2018), and for practical guidance, see JCSS (Citation2001a).
Although structural reliability analysis relies on the underlying models and assumptions and is not straightforward to apply for practising engineers, certainly not for deteriorating structures, it is the only way to account for the impact of information about the deterioration on structural safety. This is done by incorporating probabilistic deterioration modelling into the structural reliability analysis by modelling the effect of the deterioration mechanism on the basic random variables. In addition, the validity of the limit states in the deteriorating state should be assessed, and the limit states should be adjusted accordingly. For example, proper bonding between reinforcement steel and concrete may have to be modelled differently when the reinforcement steel is corroding (Blomfors, Zandi, Lundgren, & Coronelli, Citation2018).
3.3. Interventions form the decision space for assessment
The decision space, i.e. the decision parameters to consider in the analysis, defines the boundary of the risk assessment. For the assessment situation, the decision space consists of interventions i, which are combinations of actions a and experiments e. Actions can be divided into physical interventions (repair, strengthening, replacement) and organisational measures (traffic restrictions, closing the bridge). Experiments should be interpreted in a broad sense as measurements, inspections, and analyses. The fundamental option to do nothing should always be included explicitly. The decision outcome space is theoretically infinite but restricted to a few feasible options for practical cases. Identifying the decision space to consider is crucial, and this process may be formalised as a risk screening procedure where potential options are identified. By letting a group of people with various competencies and experiences do the risk screening, it is more likely that a more extensive decision space is explored and that no effective measure is left out.
For each identified maintenance action a, one has to estimate the effect on the state of the bridge, i.e. how the probability of failure Pf changes with the action. This is ideally estimated from a detailed structural reliability model that includes any deviations from the design stage and properly reflects the effect of the intervention on the variables in the model. The information from the possible experiments e are quantified by (sample) likelihood functions. A likelihood function is a conditional probability function that describes the relationship between the true state
and the observed outcome z for a given experiment e. It can be expressed as
the probability of observing the outcome given the state, which forms a two-way conditional probability table (CPT) for the discrete case. For the continuous case, the corresponding likelihood is given by a joint probability density function
The likelihood can also be expressed as probability of detection (PoD) curves for the continuous outcome and discrete state or receiver operating characteristic (ROC) curves for the discrete outcome and continuous state. In fact, they are hierarchically connected as described by Bismut and Straub (Citation2022). Finally, the costs for actions and experiments are needed, which are usually available with higher certainty than failure costs.
3.4. Assessment criteria from economic optimisation and human safety
A common approach in structural risk assessments supported by ISO 2394 (Citation2015) is to consider two criteria for the decision—the economic optimisation criterion and the human safety criterion. The latter can be divided into marginal and absolute life safety criteria. The economic optimisation criterion only applies if the human safety criterion is met, as shown in . presents an overview of the criteria.
Figure 3. Economic optimisation constrained by marginal and absolute life safety. Note that the governing criterion is arbitrarily chosen and may vary.
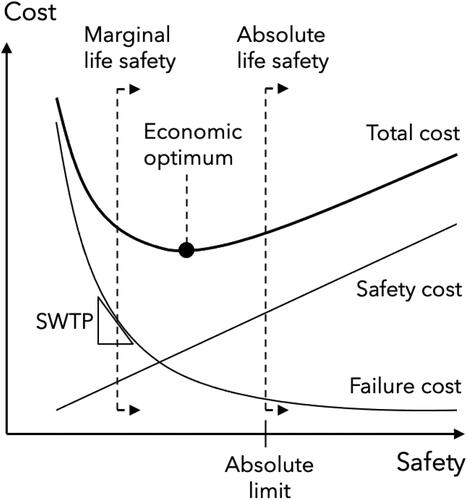
Table 2. Comparison of different aspects of structural risk assessment criteria.
For all three criteria, loss of human life is an essential parameter although it is evaluated differently. Factors relevant in this regard are risk exposure, the probability of dying given failure and exposure, and quantification of the value of one life. Regarding exposure, bridges are quite different from buildings. During one day, one typically spends many hours at home, at work, and in public buildings; the time spent driving over bridges is measured in seconds. The average number of people exposed at one bridge also denoted occupancy, is typically in the range of 0.1–10 (excluding long bridges with high traffic volume). The probability of dying given failure and being exposed is influenced, e.g. by the cause and type of failure and height above ground.
To evaluate life safety in the context of risk mitigation, the life quality index (LQI) method, which is based on a country’s gross domestic product and other wealth characteristics, can be utilised. From such information, two parameters can be derived. The societal willingness to pay for an additional saved life (SWTP) and the societal value of a statistical life (SVSL) are quantified to around 30–40 million NOK for Norway for the year 2008; see ISO 2394 (Citation2015) for other countries. In the following, more details on how human safety is dealt with in the different approaches are provided.
3.4.1. Economic optimisation
For economic optimisation, the assessment is done purely from the decision-maker’s perspective. The organisation of the different industry actors plays a role in how the costs are allocated. For instance, direct costs for losing an asset arise differently for the asset owner than for the operator. In a private company, social and environmental compensation costs are the costs that may occur for the business in the form of sanctions and penalties due to the inability to fulfill its mission, which are legal and actuarial issues. Essentially, the decision-maker can select a compensation cost for human life that best represents the business loss. Despite indirect costs not being visible in the accounting of public authorities, society ultimately bears these costs. Considering that public authorities should represent societal interests, they should explicitly account for these indirect costs. Using a standardised value for intangible costs, such as the SVSL, enables informed prioritisation of public services among different public entities.
In addition to the risk to human life, the effect on road users due to closure (either induced by failure or by authorities doubting the safety) is an indirect cost of great significance. Gajanayake, Khan, and Zhang (Citation2021) calculate the socio-economic and environmental costs for two Australian bridge failures to 25–30% of the reconstruction costs. The bridges have decent options for rerouting with <5-min delays. Wong, Onof, and Hobbs (Citation2005), on the other hand, claim that the proportion of the cost between reconstruction, causality, and traffic delays is 1:6:43 for typical highway bridges in the southern UK. Apparently, the models, assumptions, or both are vastly different in the two studies as they result in contradictory values. The existing body of literature on quantifying the consequences of bridge failures is limited. However, analogous consequences observed in other domains could offer valuable insights.
In the context of traffic planning, one essential parameter is the value of travel time savings for passengers, for which Wardman, Chintakayala, and de Jong (Citation2016) give an overview. Additionally, research delving into the economic impact of hazards like landslides and floods on road networks in a broader sense has been examined, e.g. by Winter et al. (Citation2016). Resilience in the traffic network is another concept that plays a role in the quantification of failure consequences (Argyroudis, Citation2022). Environmental compensation costs may be significant, especially as the demand for reducing emissions increases, but are not considered further in detail.
3.4.2. Human safety considerations
A human safety criterion aims to ensure sufficient safety for the public independent of other financial considerations. ISO 2394 (Citation2015) requires that the actor who exposes the public to risk invests in human safety when affordable, according to the SWTP, and when the risk exceeds an absolute value. This approach aligns with the ALARP principle in with a range of tolerable risks when reduced to as low as reasonably practicable by LQI considerations, i.e. the marginal life-safety principle. The lower limit of this range corresponds to negligible risks and the upper limit to the intolerable level at which risks must be kept below regardless of the cost, or the activity must stop.
Figure 4. The ALARP principle: as low as reasonably practicable.
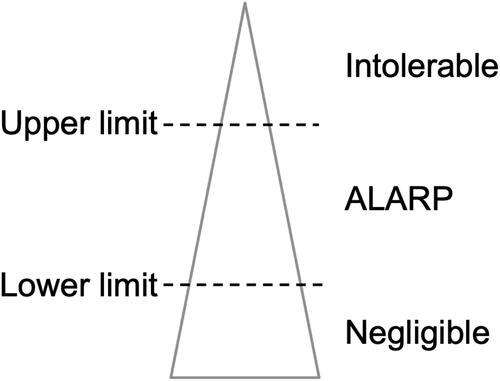
For the absolute limit, Faber, Sorensen, and Vrouwenvelder (Citation2015) suggest a unifying metric that can be used to compare human safety risks among different fields, the expected value of the number of deaths per person-year. In addition to the terms life safety and human safety, which are interpreted as interchangeable, other terms are also used, e.g. societal risk, fatality risk, acceptable risk, and individual risk. Hazardous facilities exposing the public to risk are typically restricted to in the European context (DNV GL, Citation2015) and
are specified in Swiss and Dutch standards for existing structures (Hingorani, Tanner, Prieto, & Lara, Citation2020). These values refer to the absolute level of human safety, in the metric number of deaths per person-year, and not structural failure probability or risk. With the absolute limit, issues arise with temporary and spatial considerations as the outcome of a risk assessment depends on the defined system boundary as discussed by Faber et al. (Citation2015).
For a bridge, the individual risk can be calculated as:
(1)
(1)
where nD is the number of fatalities, Pf is the yearly probability of failure,
is the number of fatalities given failure, AADT is the annual average daily traffic, np is the average number of people in one vehicle (here assumed to be 1.5) and t is the time one passing vehicle is exposed to the risk in days (here assumed to be 10 s). Hingorani et al. (Citation2020) provide a model for
depending on the occupancy for building collapse. Assuming a linear relationship between fatalities and occupancy, the number of fatalities given failure can be calculated as:
(2)
(2)
where
must be interpreted as the probability of an individual dying, given structural failure, given they are close to the bridge. Then, the individual risk simplifies to:
(3)
(3)
which aligns with the classical definition of individual risk in the context of structural engineering, as was stated e.g. in the previous version of ISO 2394 (Citation1998). By setting the limit for individual risk, e.g.
a criterion for the failure probability can be derived. Again, this individual risk is the expected number of fatalities per person-year, not the risk of dying during one individual passing.
An alternative way to model the number of fatalities given failure is given by Proske (Citation2020), as:
(4)
(4)
where
is the probability that the bridge failure results in fatalities and
is the number of fatalities given that the event causes fatalities. Proske (Citation2020) further suggests factoring the fatalities depending on the possible cause of failure and weighing them together according to their likelihood. Values for
for collapse due to flooding (0.001), impact (0.1), and overloading or poor maintenance (0.8) are suggested. Such distinctions may be helpful as bridge collapses that do not cause fatalities are heavily under-reported, but they must be linked to a specific model for fatalities to be meaningful. How to assess absolute safety with such a model is not evident, as it does not account for occupancy.
3.4.3. Implications for the public bridge owner
As the bridge owner is assumed to act on behalf of the society, they should use the SVSL as compensation costs in economic optimisation. As SVSL SWTP, typically the total failure costs
SWTP
Then, economic optimization will also cover the marginal life safety principle, consistent with the reasoning by Fischer, Viljoen, Köhler, and Faber (Citation2019). This implies that for a public infrastructure owner, economic optimisation using SVSL with a limiting individual risk criterion is sufficient when assessing failure consequences. This conclusion only holds when structural reliability drives the performance of the bridge. If this is not the case, the marginal life safety should be assessed separately.
From this elaboration on the basis for failure costs, it is acknowledged that it is not straightforward to apply in practice. The decision-makers need support to assess failure costs by simpler characteristics, e.g. the cost of a new bridge and a qualitative ranking of consequences in terms of importance for traffic network and human safety. The concept of consequence classes is already established in design codes and can be adopted for existing structures. However, the values for minor, normal, and large would change, and clear instructions on which cases belong to which class are needed.
3.5. Infinite renewal assumption for assessment
As described until now, the decision framework considers only one decision point in time; however, time influences the optimal decision. The best approach for maintaining a bridge during the next year will differ from the long-term optimum. To take the time horizon into account, two main approaches are found in the literature. First is the Life Cycle Assessment (LCA) of a specific structure with a finite lifetime, namely the remaining lifetime of the structure, for which costs are discounted to net present value. This approach is extensively used and developed by Frangopol; see Frangopol and Liu (Citation2007) for the main principles and Han and Frangopol (Citation2022) for an extension of the framework to the traffic network level. Finite lifetime has been successfully considered to obtain optimal inspection strategies, for instance, for fatigue mitigation of structural systems (Mendoza, Bismut, Straub, & Köhler, Citation2022), and for lifetime extension of wind turbines (Nielsen & Sørensen, Citation2021).
The second approach, which is used in this study, considers an infinite time horizon with continuous renewals discounted to net present costs (Rackwitz, Citation2000) and is commonly adopted in design code calibration for a set of similar structures (Köhler & Baravalle, Citation2019). It gives a compact solution that is easy to generalise. With this approach, there is no need to specify the remaining lifetime of the structure. Instead, an obsolescence rate is specified, which can be interpreted more freely as the average time between similar decision situations. The formulation of the total expected cost by Rackwitz (Citation2002) considers the design of new structures and is here adjusted to the assessment situation as:
(5)
(5)
where the first term represents the first intervention, the second term represents the total failure costs until infinity, and the last term represents the rest of the interventions until infinity. The decision parameters p considered in the assessment stage include all possible combinations of actions a and experiments e. Costs for intervention and every ‘re-intervention’ are assumed to be the same, i.e. no demolition costs are associated with maintenance interventions. The continuous renewal assumption is applied to the intervention actions, resulting in the total present expected costs:
(6)
(6)
where γ is the discount rate, and ω is the intervention rate, i.e. the rate with which the decision on the intervention becomes obsolete. It can be expressed as
where T is the average time between interventions, the service life of the intervention, the remaining service life of the structure, or the reference period considered in the analysis. The optimal intervention p is given by minimizing
which results in:
(7)
(7)
For discrete interventions, this corresponds to:
(8)
(8)
Similarly, investment into maintenance is affordable as long as the derivative of the expected cost is negative, as given by the following expression:
(9)
(9)
meaning that the difference in absolute terms,
is relevant. As
the difference is governed by
The treatment of deterioration in this infinite renewal model is crude. Both probabilities of failure and
are considered stationary or average values for the reference period T. The re-occurrence of maintenance with rate ω is assumed to keep
constant. In reality, it will increase with time due to deterioration. It is this deterioration that induces the need for future maintenance, not a predetermined obsolescence rate. This modelling assumption should be interpreted as technical rather than practical. The decision maker is not interested in determining the exact procedure of maintenance actions into infinity. The assumptions are adopted only to limit that future decisions interfere with the current decision. When making future decisions, the assumptions should be updated according to the new situation. Another interpretation of the re-occurrence of maintenance is that similar decision situations will re-occur and be dealt with using the same reasoning as in the present decision. The assessment of one specific bridge is not optimised, but the decision for any sufficiently similar assessment situation. In addition, the increase in the probability of failure that is disregarded is negligible compared to the change in the probability of failure induced by the interventions.
4. Demonstration and application
The previous section adapted the existing Bayesian decision theory to bridge maintenance. In this section, it is applied to two case studies to demonstrate the potential. Then, parametrised curves are plotted for a range of cases as a tool for evaluating any intervention for any bridge. A discount rate γ of 0.02 was assumed for all analyses.
4.1. Case study: Herøysund Bridge
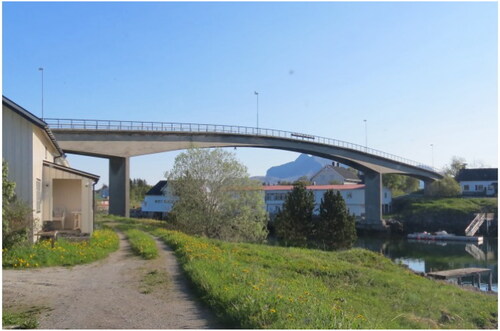
Herøysund Bridge is a bridge on the Norwegian coast built in 1965 pictured in . Its three main spans are post-tensioned concrete, while the shorter side spans are reinforced concrete. Visual inspections and chloride measurements suggest that corrosion of the ordinary reinforcement is ongoing. What should the bridge manager do? Is repair a better option than replacement? Is it worthwhile to protect against further corrosion by installing cathodic protection, and is it acceptable to wait a few years?
Figure 5. Photo of Herøysund Bridge in Nordland, Norway.
A structural reliability analysis of the side spans of the bridge was carried out in earlier work (Liljefors & Köhler, Citation2023). Probabilistic models for corrosion initiation and propagation were adopted as prior models. The data on chloride content was used to update the models using Bayesian networks, and the uncertain cross-section loss was included in the structural reliability analysis of shear failure. The study’s primary outcome is an estimate of the yearly probability of failure from construction until today and a prediction for the rest of the service life. The assessment suggested that the bridge was not acceptably safe. In this study, the goal is to support decisions on potential interventions.
The three main intervention types for chloride-induced corrosion in reinforced concrete bridges are surface treatment, mechanical repair, and electrochemical methods. With surface treatment, a barrier is formed against moisture and chlorides through an impermeable coating or hydrophobic treatment. Mechanical repair includes injection of cracks, voids, and other irregularities, recasting or spraying concrete or mortar, and replacement of reinforcement and entire structural members. Cathodic protection is an electrochemical method that effectively inhibits corrosion by applying a current. The different techniques are suitable for different damage states and site conditions. For a more complete overview of repair methods, see the standard ISO 16311-3 (Citation2014). In this study, two general repair options are considered: minor and major repair. The minor repair is assumed to restore the structural reliability to the as-built condition, and the major repair is assumed to increase the reliability to the Eurocode requirements of today. Assumptions for the input values for the different actions are presented in .
Table 3. Intervention specific parameters for Herøysund Bridge.
The consequences of a potential failure of the Herøysund bridge are evaluated regarding human safety and user costs. The consequences of a shear failure are generally large, as it is typically brittle with few warning signs for a reinforced concrete beam with no or little reinforcement. The side spans are short, which is positive for human safety. Only a few vehicles can fit in the possibly collapsing span, and the failure is believed to not propagate to the main spans, which means that the number of people at risk is limited. The probability of dying is limited because the side spans are only a few meters above the ground. Nevertheless, a car crash is a probable effect following the failure; depending on the speed, this could be devastating. This reasoning is compiled into an assumed probability of dying given failure and being exposed, of 0.1.
The user cost—the indirect cost for the missing transport link—is significant for Herøysund Bridge. A collapse of one side span would raise concerns about the rest of the bridge, and it would probably be closed. It is the only link between the two islands, meaning the only alternative transportation route is by ferry, with potentially cost-intensive measures for temporary quays. The amount of traffic is low, with an average annual daily traffic of 900. There are no options for temporary bridges of this length available. In addition, one fish farm industry in the area would be considerably affected by a closure. This fish farm is an important employer for the local rural community. Estimating the losses from the jobs that may be in danger and potential social repercussions is a complex political-economic task. The failure costs are given as a multiple of the cost of a new bridge, in . For reference, the cost of a new bridge was estimated to be 300 million NOK in 2022.
Table 4. Structure-specific parameters for Herøysund Bridge.
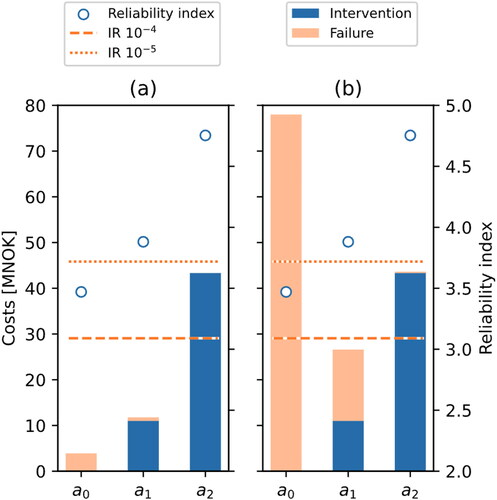
The total expected costs for the three decision alternatives are shown in along with the reliability index. According to , the optimal decision is a1: minor repair, which gives a lower total expected cost than a0: do nothing. The costs for decision a0 are pure failure costs, for a2 almost only intervention costs, and for a1 a combination. The optimal solution may be constrained to sufficiently safe options according to the absolute life safety criteria by comparing the reliability indices (circular dots) with the individual risk criteria (dashed lines). For this case, the do-nothing option is unacceptable with the more strict criteria but acceptable with the less strict criteria. The uncertainty in corrosion progression in the previous study (Liljefors & Köhler, Citation2023) heavily influences the optimal decision as shown in , where the do-nothing option is optimal and acceptable. The decision is also sensitive to the assumed failure costs, as shown in .
Figure 6. Total expected cost and yearly reliability index for action a0: do nothing, a1: minor repair and a2: major repair, for (a) the standard case and (b) the alternative pitting factor.
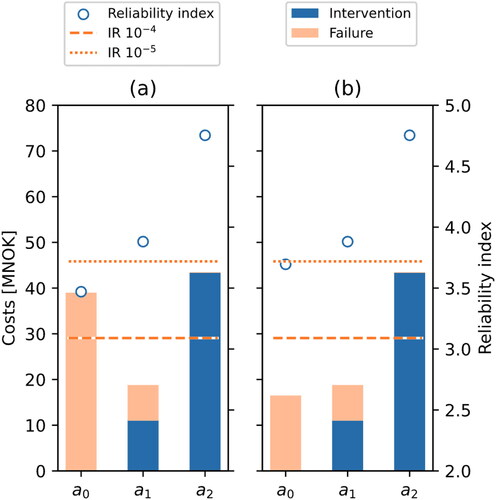
Figure 7. Total expected cost and yearly reliability index for action a0: do nothing, a1: minor repair and a2: major repair, for (a) lower failure costs and (b) higher failure costs.
provides more details about the sensitivity of the decision, with input parameters in . is the reference case and corresponds to . The dashed line determines the limit between economically efficient (below the line) and non-efficient (above the line) interventions. This allows for assessing the maximum net present yearly cost (Tref = 1) the decision maker is willing to pay for upgrading the bridge to a certain probability of failure. In the same graph, life safety can be assessed simultaneously. The dotted line provides the minimum investment from the marginal life safety principle, which is insignificant for this case. The solid lines provide one less strict and one more strict absolute criteria that vary with the probability of dying given failure and being exposed. In , failure cost, probability of failure before intervention, and reference period are varied. When changing the reference period, the comparison is still made for the infinite lifetime, but the investments in interventions are discounted to different reference periods. This means that both the limiting line and the dot represent the intervention change. This consideration demonstrates that the monetary value changes over time, but it has a minor effect on the decision as the comparison is made for the same reference period.
Figure 8. Sensitivity analysis for varying failure costs, failure probability, and reference period.
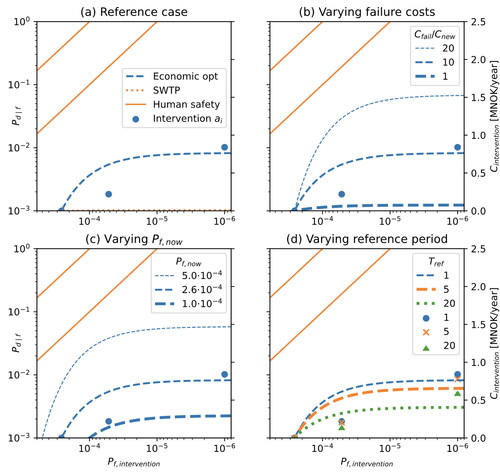
Table 5. Input parameters for sensitivity analysis of Herøysund Bridge.
4.2. Case study: Osvold Bridge
shows the short standard concrete slab bridge called Osvold Bridge in Lofoten built in 1963. The bridge manager was concerned about the thickness of asphalt covering the bridge. It was measured to 735 mm, and a deterministic assessment was carried out to verify the safety of the bridge carrying the additional weight of the asphalt. The assessment showed that the bridge did not meet safety requirements, and asphalt was removed. This study investigates the decision support that a formal risk-based assessment could provide. A structural reliability model of the mid-span bending moment was developed based on the deterministic assessment. Structural reliability was calculated for as-built conditions, increased traffic load, increased asphalt thickness, and the two effects combined, see . From this model, the reduction of failure probability from interventions on traffic load and asphalt thickness was evaluated.
Figure 9. Photo of Osvold Bridge in Nordland, Norway.

Figure 10. Yearly reliability index as a function of traffic load and asphalt thickness for Osvold Bridge.
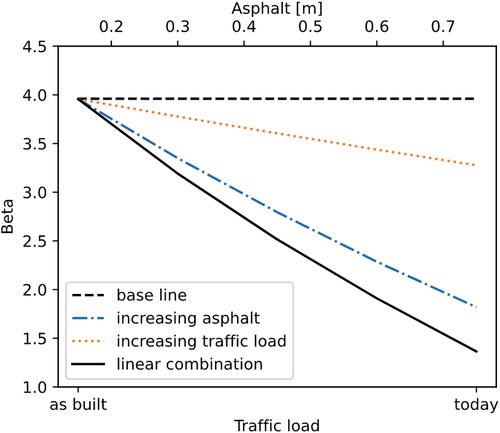
A bending moment failure of a reinforced concrete beam is typically preceded by warning signs, such as cracks and deflection, but the failure may be more sudden with corroding reinforcement. Given failure and exposure, the probability of dying is assumed to be 0.01. The user costs for a missing transport link at Osvold Bridge are limited, as a temporary bridge could be installed. Reroutes are long, up to 2 h, and the annual average daily traffic is 3900 vehicles. The cost of a new bridge is well-known, and the cost of removing asphalt is, in principle, insignificant. There may be secondary costs for the reconstruction of the adjacent roads to align with the new height of the bridge, as well as costs for assessing and repairing damages caused by the overload. Traffic restrictions, e.g. limited truck weight and single lanes, have a general effect on the efficiency of the road network, here assumed to cost 0.1 MNOK per year (net present value). Asphalt removal and traffic restrictions do not have a specified service life. The reference period of 20 years is assigned to represent the time until the bridge may be obsolete for other reasons. The cost of a new bridge is estimated to be 10 MNOK, and the failure costs are This ratio is not directly comparable with the Herøysund Bridge as Cnew is very different for the two cases.
All assumptions for the decision analysis are summarised in and , and the results are given in . The economically optimal action is a2: remove asphalt. To decrease the traffic is not enough as a single action, but in combination with asphalt removal a higher reliability is achieved. The least economically optimal action is to do nothing, but this result is very much dependent on the quantification of failure costs. What is particular about failure costs is that they do not appear in budgets, and most probably, they will never realise. When failure does occur, the consequences are potentially enormous, and it is this risk that is quantified as expected failure costs.
Figure 11. Total expected cost and yearly reliability index for intervention options
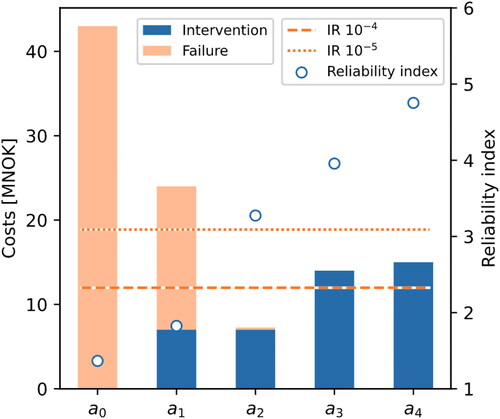
Table 6. Intervention specific parameters for Osvold Bridge.
Table 7. Structure-specific parameters for Osvold Bridge.
4.3. The general assessment case
So far, results for two specific cases have been presented. As generalised results valid for any bridge would be highly valuable for bridge owners, an attempt was made to provide this. It is challenging, as any simplification or generalisation comes with a loss of accuracy.
In , the decision alternatives are parameterised by the ratio of net present yearly intervention cost to net present annual cost for a new bridge and yearly probability of failure conditional on the intervention. Curves are plotted for different severity of consequences and initial probabilities of failure. Each curve gives the maximum cost the decision maker is willing to pay for upgrading the bridge to a certain reliability. Or opposite, it can tell how much the reliability must be improved to make a maintenance action with a certain cost affordable. For example, direct attention to the three curves approaching on the horizontal axis. For a structure with this probability of failure, the decision maker is willing to pay 6–30% of the cost for a new bridge to decrease the failure probability to
Figure 12. Maximum cost for intervention that is affordable for different failure costs for reference period one year. The vertical lines are constraints determined by individual risk criteria and the probability of dying given failure.
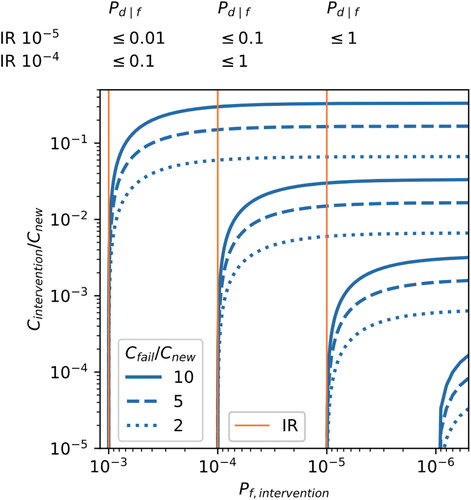
Furthermore, focus on the asymptotic behaviour of the curves considering interventions with lower failure probability. This means that compared to the value of decreasing the failure probability from to
a further increase in safety beyond
is insignificant. The curves emerging from different initial failure probabilities are essentially a magnified view of the asymptotic behaviour just discussed. As expected, the decision maker is willing to pay more for an intervention when the probability of failure is higher.
Note that Cnew in refers to the yearly net present cost on the vertical axis and to the cost for one new bridge with a service life of 100 years in the ratio This implies that a new bridge that costs 100 MNOK corresponds not to 100/100 = 1 but to 2.94 MNOK per year due to discounting. This choice is believed to make the most sense as decision support, but the curves can be adjusted to align with the decision maker’s preferred way of comparing monetary investments. As the costs are normalised to the cost of a new bridge, plotting the marginal life safety cost criteria in makes little sense and is therefore omitted. The absolute life safety criterion is plotted for rough classes of the probability of dying given failure and being exposed. The high extent of generalisation in this figure makes it suitable for preliminary assessment that can indicate if an intervention is obviously appropriate, obviously inappropriate, or requires more detailed investigation.
5. Discussion
More precise methods for assessment are needed to increase efficiency in bridge maintenance. With Bayesian decision-making, decision options can be identified and evaluated systematically by probabilities and consequences. This contribution aimed to identify and overcome challenges in implementing this framework in practical bridge maintenance. The framework and its key components were presented, along with guidance on parameter estimations for probabilistic modelling and consequence modelling. Applying the framework to two case studies revealed long-term optimal decisions leading to the highest expected utilities constrained by life safety criteria.
When using Bayesian decision-making based on structural reliability, expected failure costs and costs for possible interventions are compared. This allows for rational and coherent decisions based on an accurate representation of the uncertain structural state. Such a decision is, by definition, more refined than a decision based on more superficial risk ratings, qualitative inspection information, and utilisation ratios. It is also an excellent complement to deterministic sensor-based damage detection. The method is flexible and can be applied to the assessment of any bridge, deterioration mechanism, intervention, information, etc. Quantification of input to this flexible framework is challenging and therefore directed attention in this work. In the following, it is discussed how this study contributes to filling the gaps hindering practical implementation and what issues remain for future work.
The structural reliability model is a cornerstone of the proposed framework. Although implicitly being the fundamental basis and criterion in structural engineering, reliability analysis is not applied in daily engineering work and is still subject to some scepticism. A common concern is related to the Bayesian interpretation of the failure probability. Accordingly, the probability of failure is not an inherent property of the structure but rather a result of the analysis itself. This has two implications: (a) the probability of failure can change with new information without changing any physical properties of the structure, and (b) the resulting failure probability is sensitive to the (subjective) assumptions that are necessary for any analysis. While (a) is an important insight and requirement for conditioning the analysis to the present state of the structure, (b) is often interpreted as a restricting liability of probabilistic structural analysis. However, in typical structural design and assessment situations, failure probability is computed for the purpose of the relative comparison of different design or mitigation options. In this context, the relative change of failure probability with the different options is important. And that is much less sensitive to subjective assumptions than the absolute value of failure probability. When evaluating life safety, however, the failure probability must be interpreted literally.
Interventions were treated generally in the framework, and the bridge manager can assess any intervention by estimating the reduction in the probability of failure, cost, and expected lifetime for the intervention. If the intervention can be represented in the structural reliability model, as was the case for Osvold Bridge, it is preferred as the relative comparison is less dependent on the assumptions when assessed within the same model. The failure probability of a new bridge can be estimated assuming it will comply with current Eurocodes, but the crucial quantity, reduction in failure probability, is governed by the probability of failure before the intervention.
Rational treatment of the time horizon is needed to ensure long-term efficiency. This work adopted the assumption of continuous re-occurrence of similar decision situations for an infinite future. This assumption is abstract but convenient, as the impact of the assumption on the remaining service life of the specific structure is reduced. An alternative is to do the analysis for a specified time period in a life cycle analysis. Due to the discounting effect, the incentive to invest in maintenance actions is larger when considering shorter periods, although this effect depends on how investments are financed. The discounting effect is believed to be less relevant compared to additional issues with long-term investments for an uncertain future. It is not reasonable to optimise bridges for a future in which the use of cars may no longer be relevant. Similarly, a bridge in perfect condition has little value if the road stretch it is part of is relocated.
The consequences following a failure vary from case to case and are uncertain. Two main issues for future research to address are human safety and user costs. For human safety, the expected number of fatalities given failure and the societal cost of such a fatality are two precarious parameters to estimate. Two different options for quantifying life safety were identified (Hingorani et al., Citation2020; Proske, Citation2020), which calls for further discussions on the purpose of this criterion and the appropriate methods for evaluating it. For user costs, the role of the individual structures in the traffic network and the value produced in the traffic network is important. Sustainability impact is a type of consequence that was not taken into account in this work. However, it will receive more attention in the future as the urgency for a shift towards sustainable practices is increasing. It can be assessed separately or added as an explicit cost for the interventions, in terms of equivalents and their social cost.
A better understanding of failure consequences is needed both for structure-specific risk assessments and for the derivation of simplified methods for assessment. For the latter, it is crucial to grasp what parameters drive the consequences. That would serve as a good starting point for categorising and classifying the whole range of decision situations that can appear in bridge assessments. This diversity is challenging to cover and requires a balance between inclusion for general applicability and restriction for increased accuracy. How the simplified methods would look is an open question. Calibrated target reliabilities and partial safety factors are options familiar to the engineering community, but their suitability for the assessment situation is debatable.
As stated in the introduction, the proposed framework is far from current practice, and bridge owners may question the need for it. There are relatively few bridge failures and many of them are not associated with lack of maintenance but with unforeseen events, such as floods. The probability of failure due to flooding may not decrease with the proposed method per se but is rather attributed to the choice of including the risk of flooding in the assessment. It is difficult to make a fair comparison between current practice and the proposed method, as the proposed framework represents a paradigm shift to higher-level assessments.
Considering the concern about risk- and reliability methods being too uncertain, it should be noticed that the uncertainties associated with current practice are not acknowledged as of now. A method may have large uncertainties despite not being quantified. Inspection ratings on a deterministic scale of 1–5 may sound confident and precise but they are not. This concern tells us that the next steps in research should be directed at demonstrating the value of detailed assessments, acknowledging the uncertainties in inspection ratings. Closer collaboration with practitioners is essential for closing the gap between the theoretically ideal framework and the currently applied practice.
Despite the many challenges, Bayesian decision-making provides the most accurate decision support possible for bridge maintenance. This study revealed that the passive maintenance strategy of doing nothing puts society at risk and that public authorities should invest in interventions that efficiently reduce this risk. The effort required for the analysis may be worthwhile for assessment situations where increased safety is expensive and failure would have devastating consequences.
It remains for future studies to quantify the value of doing such a detailed analysis, which would tell decision-makers how much they are willing to pay for it. The theory is available but quantifying the precision of an inspection rating is a challenge. The flexibility in the framework allows for efficient adaptation, but standardisation restricting the flexibility in assumptions and models is needed to ensure objectivity to some extent. Standardisation is also believed to accelerate practical implementation. The method will not reduce human errors and unforeseen events not considered in the assessment. Quality control and robustness considerations are therefore important complements to ensure safe bridges.
6. Conclusions
Bayesian decision-making can be utilised to maintain existing bridges efficiently. Instead of taking action based on inspections, condition ratings, and deterministic utilisation ratios, a more complete representation of the situation can be established with structural reliability methods and consequence modelling, resulting in more accurate, objective, and coherent decisions. The framework was applied to two case studies: one rural but critical transport link being a corroding reinforced concrete bridge and one short reinforced concrete bridge with excessive asphalt layers at a more well-trafficked road stretch. Optimal intervention actions, restricted to sufficiently safe ones, were found for both cases.
The optimal solutions are highly sensitive to the failure costs and current failure probability, while the reference period and probability of failure after intervention are less important. Any intervention can be assessed if the effect on the failure probability, cost, and expected lifetime can be estimated. Better support for the quantification of these parameters is needed for broad implementation. A structured classification of possible decision situations for assessment, in line with consequence classes for the design of new structures, could facilitate this. Adopting the suggested framework and making just slightly more rational decisions will benefit society enormously, considering the large number of existing bridges.
Acknowledgements
Thanks to Ramon Hingorani for valuable feedback on life safety.
Disclosure statement
No potential conflict of interest was reported by the author(s).
Additional information
Funding
References
- Argyroudis, S. A. (2022). Resilience metrics for transport networks: A review and practical examples for bridges. Proceedings of the Institution of Civil Engineers-Bridge Engineering, 175(3), 179–192. doi:10.1680/jbren.21.00075
- Benjamin, J. R., & Cornell, C. A. (1970). Probability, statistics and decision for civil engineers. New York: McGraw-Hill.
- Bismut, E., & Straub, D. (2022). A unifying review of NDE models towards optimal decision support. Structural Safety, 97, 102213. doi:10.1016/j.strusafe.2022.102213
- Blomfors, M., Zandi, K., Lundgren, K., & Coronelli, D. (2018). Engineering bond model for corroded reinforcement. Engineering Structures, 156, 394–410. doi:10.1016/j.engstruct.2017.11.030
- Casas, J. R. (2011). Reliability-based assessment of masonry arch bridges. Construction and Building Materials, 25(4), 1621–1631. doi:10.1016/j.conbuildmat.2010.10.011
- DNV GL. (2015). Risk acceptance criteria and risk based damage stability. Final report, part 1: Risk acceptance criteria. Oslo, Norway: European Maritime Safety Agency.
- Enevoldsen, I. (2011). Practical implementation of probability based assessment methods for bridges. Structure and Infrastructure Engineering, 7(7–8), 535–549. doi:10.1080/15732479.2010.496992
- European Commission. (2019). The European Green Deal. Brussels: European Commission.
- European Commission. (2020). Circular economy action plan. For a cleaner and more competitive Europe. Brussels:European Commission.
- European Environment Agency. (2019). The European environment – State and outlook 2020. Knowledge for transition to a sustainable Europe. Luxembourg: Publications Office of the European Union.
- Faber, M. H. (2000). Reliability based assessment of existing structures. Progress in Structural Engineering and Materials, 2(2), 247–253. doi:10.1002/1528-2716(200004/06)2:2⟨247::AID-PSE31⟩3.0.CO;2-H
- Faber, M. H. (2002). Risk-based inspection: The framework. Structural Engineering International, 12(3), 186–195. doi:10.2749/101686602777965388
- Faber, M. H., Sorensen, J. D., & Vrouwenvelder, T. (2015, July 12–15). On the regulation of life safety risk. Proceedings of the 12th International Conference on Applications of Statistics and Probability in Civil Engineering (ICASP12), Vancouver, Canada. doi:10.14288/1.0076169
- Fischer, K., Viljoen, C., Köhler, J., & Faber, M. H. (2019). Optimal and acceptable reliabilities for structural design. Structural Safety, 76, 149–161. doi:10.1016/j.strusafe.2018.09.002
- Frangopol, D. M., & Liu, M. (2007). Maintenance and management of civil infrastructure based on condition, safety, optimization, and life-cycle cost. Structure and Infrastructure Engineering, 3(1), 29–41. doi:10.1080/15732470500253164
- Frangopol, D. M., Kong, J. S., & Gharaibeh, E. S. (2001). Reliability-based life-cycle management of highway bridges. Journal of Computing in Civil Engineering, 15(1), 27–34. doi:10.1061/(ASCE)0887-3801(2001)15:1(27)
- Gajanayake, A., Khan, T., & Zhang, G. (2021). A decision-making tool to assess external costs of disaster induced bridge failure. International Journal of Disaster Risk Reduction, 64, 102506. doi:10.1016/j.ijdrr.2021.102506
- Han, X., & Frangopol, D. M. (2022). Risk-informed bridge optimal maintenance strategy considering target service life and user cost at project and network levels. ASCE-ASME Journal of Risk and Uncertainty in Engineering Systems, Part A: Civil Engineering, 8(4), 04022050. doi:10.1061/AJRUA6.0001263
- Hingorani, R., Tanner, P., Prieto, M., & Lara, C. (2020). Consequence classes and associated models for predicting loss of life in collapse of building structures. Structural Safety, 85, 101910. doi:10.1016/j.strusafe.2019.101910
- ISO 16311-3. (2014). Maintenance and repair of concrete structures – Part 3: Design of repairs and prevention. Geneva: International Organization for Standardization.
- ISO 2394. (1998). General principles on reliability for structures. Geneva: International Organization for Standardization.
- ISO 2394. (2015). General principles on reliability for structures. Geneva: International Organization for Standardization.
- Jaafaru, H., & Agbelie, B. (2022). Bridge maintenance planning framework using machine learning, multi-criteria decision analysis and evolutionary optimization models. Automation in Construction, 143, 104585. doi:10.1016/j.autcon.2022.104585
- Jacinto, L., Neves, L. C., & Santos, L. O. (2016). Bayesian assessment of an existing bridge: A case study. Structure and Infrastructure Engineering, 12(1), 61–77. doi:10.1080/15732479.2014.995105
- JCSS. (2001a). JCSS probabilistic model code (M. Faber & T. Vrouwenvelder, Eds.). Joint Committee on Structural Safety.
- JCSS. (2001b). Probabilistic assessment of existing structures. A publication of the Joint Committee on Structural Safety (JCSS) (D. Diamantidis, Ed.). Cachan, France: RILEM Publications Sarl.
- Köhler, J., & Baravalle, M. (2019). Risk-based decision making and the calibration of structural design codes – Prospects and challenges. Civil Engineering and Environmental Systems, 36(1), 55–72. doi:10.1080/10286608.2019.1615477
- Liljefors, F., & Köhler, J. (2023). Decision support and structural assessment of a corroding reinforced concrete bridge considering new information. Structure and Infrastructure Engineering, 1–16. doi:10.1080/15732479.2023.2271962
- Matos, J. C., Moreira, V. N., Valente, I. B., Cruz, P. J.S., Neves, L. C., & Galvão, N. (2019). Probabilistic-based assessment of existing steel-concrete composite bridges – Application to Sousa River Bridge. Engineering Structures, 181, 95–110. doi:10.1016/j.engstruct.2018.12.006
- Melchers, R. E. (2001). Assessment of existing structures—Approaches and research needs. Journal of Structural Engineering, 127(4), 406–411. doi:10.1061/(ASCE)733-9445(2001)127:4(406
- Melchers, R. E., & Beck, A. T. (2018). Structural reliability analysis and prediction. Hoboken, NJ: Wiley.
- Mendoza, J., Bismut, E., Straub, D., & Köhler, J. (2022). Optimal life-cycle mitigation of fatigue failure risk for structural systems. Reliability Engineering & System Safety, 222, 108390. doi:10.1016/j.ress.2022.108390
- Morato, P., Papakonstantinou, K., Andriotis, C., Nielsen, J., & Rigo, P. (2022). Optimal inspection and maintenance planning for deteriorating structural components through dynamic Bayesian networks and Markov decision processes. Structural Safety, 94, 102140. doi:10.1016/j.strusafe.2021.102140
- Nielsen, J. S., & Sørensen, J. D. (2021). Risk-based derivation of target reliability levels for life extension of wind turbine structural components. Wind Energy, 24(9), 939–956. doi:10.1002/we.2610
- Parmiani, M., & Orta, L. (2022). Reliability assessment of a continuous bridge beam with exposed reinforcement. Engineering Structures, 262, 114281. doi:10.1016/j.engstruct.2022.114281
- Proske, D. (2020). Fatalities due to bridge collapses. Proceedings of the Institution of Civil Engineers-Bridge Engineering, 173(4), 1–24. doi:10.1680/jbren.20.00001
- Rackwitz, R. (2000). Optimization – The basis of code-making and reliability verification. Structural Safety, 22(1), 27–60. doi:10.1016/S0167-4730(99)00037-5
- Rackwitz, R. (2002). Optimization and risk acceptability based on the life quality index. Structural Safety, 24(2–4), 297–331. doi:10.1016/S0167-4730(02)00029-2
- Raiffa, H., & Schlaifer, R. (1961). Applied statistical decision theory. Boston, MA: Division of Research, Graduate School of Business Administration, Harvard University.
- Strauss, A., Mandic, A., Matos, J. C., & Casas, J. R. (2016). COST TU 1406: Performance indicators for roadway bridges.
- Strauss, A., Orcesi, A., Lampropoulos, A., Briseghella, B., Frangopol, D. M., Sousa, H. S., … Moser, T. (2023). IABSE survey of implemented decision-making models used by public and private owners/operators of road- and railway infrastructures. Structural Engineering International, 34(1), 87–96. doi:10.1080/10168664.2022.2154731
- United Nations. (2015). Transforming our world: The 2030 agenda for sustainable development.
- Vereecken, E., Botte, W., Lombaert, G., & Caspeele, R. (2020). Bayesian decision analysis for the optimization of inspection and repair of spatially degrading concrete structures. Engineering Structures, 220, 111028. doi:10.1016/j.engstruct.2020.111028
- Von Neumann, J., & Morgenstern, O. (1947). Theory of games and economic behavior (2nd ed.). Princeton, NJ: Princeton University Press.
- Wardman, M., Chintakayala, V. P. K., & de Jong, G. (2016). Values of travel time in Europe: Review and meta-analysis. Transportation Research Part A: Policy and Practice, 94, 93–111. doi:10.1016/j.tra.2016.08.019
- Winter, M. G., Shearer, B., Palmer, D., Peeling, D., Harmer, C., & Sharpe, J. (2016). The economic impact of landslides and floods on the road network. Procedia Engineering, 143, 1425–1434. doi:10.1016/j.proeng.2016.06.168
- Wong, S. M., Onof, C. J., & Hobbs, R. E. (2005). Models for evaluating the costs of bridge failure. Proceedings of the Institution of Civil Engineers-Bridge Engineering, 158(3), 117–128. doi:10.1680/bren.2005.158.3.117
- Zhang, H., & Marsh, D. W. R. (2021). Managing infrastructure asset: Bayesian networks for inspection and maintenance decisions reasoning and planning. Reliability Engineering & System Safety, 207, 107328. doi:10.1016/j.ress.2020.107328