
 ?Mathematical formulae have been encoded as MathML and are displayed in this HTML version using MathJax in order to improve their display. Uncheck the box to turn MathJax off. This feature requires Javascript. Click on a formula to zoom.
Abstract
Due to the high mechanical performance of new structural materials, modern footbridges are usually slender and lightweight structures. It follows that their natural frequencies often fall within the typical range of pedestrian pacing frequencies, feature that renders them rather sensitive to human-induced vibrations. Special care is therefore needed to avoid excessive levels of swaying, both to safeguard pedestrians from being bothered by the sense of discomfort and to prevent the functionality of footbridges to be compromised. However, in contrast with the single person dynamic force, the characterisation of the crowd-induced loading is rather challenging, time-consuming, and thus scarcely compatible with the design stage needs. This paper proposes an analytical model based on the multiplication factor approach, which allows to predict the vertical crowd-induced response from that of a single pedestrian. The work is based on extensive numerical simulations, carried out in due respect of human-human interaction and pedestrian step forcing variability. Besides, the possibility of managing human-structure effects is also foreseen. The method is meant to handle the vibration serviceability check of a wide range of scenarios, including a broad spectrum of footbridge parameters and crowd densities. For validation purposes, model predictions are compared against regulations and experimental results.
1. Introduction
Contemporary architectural aesthetic principles are driving engineers to construct increasingly lively footbridges, whose low natural frequencies often align with human-induced excitation frequency ranges. Consequently, the vibration serviceability limit state is gaining a key role in the context of modern footbridges (Li, Zhang, Wang, Zhang, & Wei, Citation2023; Van Nimmen et al., Citation2017) for both comfort and safety checking (Cunha, Caetano, Magalhães, & Moutinho, Citation2017), notwithstanding the current absence of a standardised design code. The difficulty in establishing a standard protocol for footbridge vibration assessments lies in the characterisation of the load induced by pedestrian groups and crowds, which is rather challenging, time-consuming, and currently under investigation (Tubino, Pagnini, & Piccardo, Citation2020). Besides several methods based on time domain crowd modelling (da Silva, Brito, & Pimentel, Citation2013; Jiménez-Alonso, Sáez, Caetano, & Magalhães, Citation2016; Venuti, Racic, & Corbetta, Citation2016; Živanović, Pavić, & Ingólfsson, Citation2010), a popular approach to simulate the crowd response is to amplify that caused by a single pedestrian by a proper multiplication factor (Bachmann & Ammann, Citation1987; Caprani, Keogh, Archbold, & Fanning, Citation2012; Fujino, Pacheco, Nakamura, & Warnitchai, Citation1993; Grundmann, Kreuzinger, & Schneider, Citation1993; Piccardo & Tubino, Citation2009). Indeed, the multiplication factor prospect is widely recognized for its directness and ease of use, since the force exerted by an individual is well understood and easier to handle. However, its calibration is not that prompt, as to representatively condense the crowd conduct into a mere multiplication factor a fine-detailed background work is needed.
Indeed, footbridge vibrations to crowds do depend on multiple factors. First and foremost, walking forces are affected by the so-called inter- and intra-subject variabilities, and shall be therefore probabilistically modelled (Pancaldi, Bassoli, Milani, & Vincenzi, Citation2021; Piccardo & Tubino, Citation2012; Racic & Brownjohn, Citation2011; Van Nimmen, Zhao, Seyfarth, & Van den Broeck, Citation2018; Živanović, Pavić, & Reynolds, Citation2007). The former variability indicates the heterogeneous nature of pedestrian gaits and loadings, whereas the latter represents the inner diversity between subsequent steps taken by the same person. In addition, two types of interaction phenomena may occur: human-human interaction (HHI), deliberate or subconscious phenomenon by which the behaviour of each crowd member is influenced by the presence of others (Bruno & Corbetta, Citation2017; Helbing & Molnár, Citation1995), and human-structure interaction (HSI), continuous mutual dynamic effects of pedestrians and the occupied footbridge on each other (Bassoli, Van Nimmen, Vincenzi, & Van den Broeck, Citation2018; Shahabpoor, Pavic, & Racic, Citation2017). The combination of these factors entails that the crowd-induced vibration is not simply equal to the sum of each individual response, as the vibration imparted by one pedestrian may be either reduced or amplified as a result of destructive or constructive interferences, respectively (Caprani et al., Citation2012).
Also, vibration responses depend on both crowd density and footbridge parameters: a high crowd density does not always indicate the most adverse situation, as different footbridges may exhibit varying susceptibilities to different crowd densities. Furthermore, both the structural and human-excitation domains are subject to uncertainties, which propagate into the assessment of the footbridge response, thereby influencing its reliability (Tubino et al., Citation2020; Wei, Liu, & Bi, Citation2022). On the structure side, dynamic parameters might be affected by uncertainties related to numerical model accuracy, environmental effects, and HSI phenomenon. Indeed, due to the mechanical interaction between the crowd and the footbridge, the dynamic parameters of the equivalent coupled crowd-structure system can undergo significant modifications when compared to the empty structure prior to pedestrian arrival: as demonstrated by Bassoli, Van Nimmen, et al. (Citation2018) and Živanović, Diaz, & Pavić (Citation2009), the equivalent damping ratio significantly increases with crowd density, and even changes in the equivalent natural frequency are likely to occur. Regarding, on the other hand, randomness in human excitation, stochastic aspects involved in the definition of crowd loading include pedestrian arrival times, distributions of walking speeds and step frequencies, walking trajectories, dynamic load factors, body weights, etc.
Besides the inherent complexity of crowd load modelling, the progress in this area is further complicated by the lack of full-scale validations. Indeed, although many interesting tests are reported in literature, they are rarely suitable for comprehensive validation purposes. Common reasons are essentially two: restricted access to data (including modal parameters and/or acceleration time histories) and limited crowd density levels. In fact, most often experiments do involve a low number of pedestrians (Bocian et al., Citation2018; Dey, Sychterz, Narasimhan, & Walbridge, Citation2016; Fanning, Healy, & Pavic, Citation2010; Tubino, Carassale, & Piccardo, Citation2016; Van Nimmen, Lombaert, Jonkers, De Roeck, & Van den Broeck, Citation2014), and the few that include many people are not aimed at the achievement of high density values but at the statistical characterisation of step parameters (Sanhaci & Kasperski, Citation2005; Živanović, Citation2012). Recently, Van Hauwermeiren, Van Nimmen, Van den Broeck, & Vergauwen (Citation2020) and Van Nimmen, Van Hauwermeiren, & Van den Broeck (Citation2021) performed a full-scale experimental study involving pedestrian densities up to 0.50 ped/m2. Collected data are publicly available with open access (including bridge motion to crowd loading and modal characteristics derived from structural responses to ambient excitation), allowing the validation of prediction models for crowd-induced vibrations.
As regards the multiplication factor approach, earliest studies in the literature date back to the eighties. Among the firsts, Matsumoto, Nishioka, Shiojiri, & Matsuzaki (Citation1978) found that the pedestrian arrival on the bridge tends to follow a Poisson distribution, and concluded that the bridge response to a crowd of N people can be statistically evaluated as the response due to one pedestrian multiplied by Armed with this theory, Bachmann & Ammann (Citation1987) verified the
multiplier by examining a footbridge with a natural frequency of 2.1 Hz, subject to a pedestrian density of 0.55 ped/m2. Some few years later, Grundmann et al. (Citation1993) studied a simply supported footbridge with a natural frequency of 1.94 Hz and a crowd density of 0.44 ped/m2, suggesting a multiplication factor of 0.135 N. Fujino et al. (Citation1993) recommended instead a multiplication factor of 0.2 N, based on studies on a footbridge with natural frequency of 2.0 Hz subject to an extremely high crowd density of 2.11 ped/m2. Therefore, earliest multiplication factors are generally based on specific circumstances and, besides, their validity might be restricted to a particular set of crowd density and natural frequency.
More recently, Piccardo & Tubino (Citation2009) proposed two simplified procedures founded on the definition of two coefficients, the equivalent amplification factor and the equivalent synchronization factor, which allow the evaluation of vibration serviceability without requiring numerical analyses. However, these models can only be applied to limited pedestrian densities (i.e. lower than 0.6 ped/m2). Caprani et al. (Citation2012) considered a wider spectrum of densities (0.44, 0.55, 0.75, 1.5 and 2.11 ped/m2) and evaluated a multiplication factor for each traffic level, based on numerical simulations performed adopting a probabilistic model. Nevertheless, only three footbridge natural frequencies were considered (1.94, 2.0 and 2.1 Hz). Moreover, the need to define in advance the level of synchronization among pedestrians (i.e. the portion of people synchronized with each other) remains a key issue. Concluding, also more recent literature models mainly concern specific crowd densities and/or footbridge natural frequencies, and it is not demonstrated whether they can be extended to different circumstances.
The concept of multiplication factor has been adopted also by the few existing regulations (BSI, Citation2008; Butz et al., Citation2008; HIVOSS, Citation2008; ISO 10137, Citation2007; SETRA, Citation2006). The latter propose multipliers founded on Monte Carlo analyses, which generally neglect the HHI phenomenon but span a wider range of crowd densities and footbridge parameters. However, pedestrians pacing frequencies are extracted from a normal distribution whose mean value coincides with the natural frequency of the footbridge (i.e. a near-resonance is sought). Assessments thus conceived might be overconservative, particularly for footbridges with natural frequencies not that close to typical step frequencies (Tubino & Piccardo, Citation2016). Moreover, such randomness in human excitation is accounted for only as long as the density is lower than 1.0 ped/m2, otherwise a perfect synchronisation among people is assumed (Živanović et al., Citation2010). All this generally leads to conservative estimates of footbridge accelerations, especially for high pedestrian densities (Venuti & Tubino, Citation2021).
In this context, this paper aims at providing a practical but detailed model based on the multiplication factor approach. The presented method can be applied for the vertical vibration serviceability analysis of footbridges with diverse geometries (deck dimensions and number of spans) and dynamic characteristics (any mode shape and modal mass, natural frequencies from 0.5 to 5.5 Hz, and modal damping ratios from 0.1 to 10.0% are included), subject to any crowd density between 0.2 and 1.5 ped/m2. Furthermore, the method also foresees the possibility of accounting for HSI effects, by implementing the equivalent modal properties of the coupled crowd-structure system instead of those of the empty footbridge. In addition to being enforceable to extensive case studies, the model is based on simulations that take heed of both inter-subject and step-by-step variability in pedestrian forcing, as well as the HHI phenomenon. As regards the latter, the behaviour of pedestrians within a crowd is modelled at a highly detailed level by means of the Social Force Model (SFM) (Bassoli & Vincenzi, Citation2021; Helbing & Molnár, Citation1995).
Starting from extensive numerical simulations of the vertical crowd-induced acceleration, performed considering different simply supported footbridges and the contribution of the fundamental mode, improved multiplication factors are evaluated for a wide range of crowd and structure parameters, as the ratio of crowd to virtual single pedestrian responses. In this, the term ‘virtual’ indicates the mismatch between structures crossed by crowds and coupled single pedestrians, specifically devised to reduce the method computational burden. Simulated improved multiplication factors are then subjected to fitting processes aimed at their analytical modelling. The procedure to evaluate both the average and 95th percentile maximum crowd-induced acceleration is herein presented and compared against literature and experimental results.
2. Broad outline of the procedure
The present work is aimed at developing a simple and systematic method based on the multiplication factor approach, which allows to forecast crowd-induced vertical vibrations of footbridges by just dealing with a (properly amplified) representative single pedestrian. The outline of the proceeding is detailed in the following and outlined in the flow chart of .
Figure 1. General framework of the procedure, with crowd densities ρ ranging from 0.2 to 1.5 ped/m2, natural frequencies f from 0.5 to 5.5 Hz, and damping ratios ξ from 0.1 to 10%, which correspond to extra dampings in line with Section 6.1.
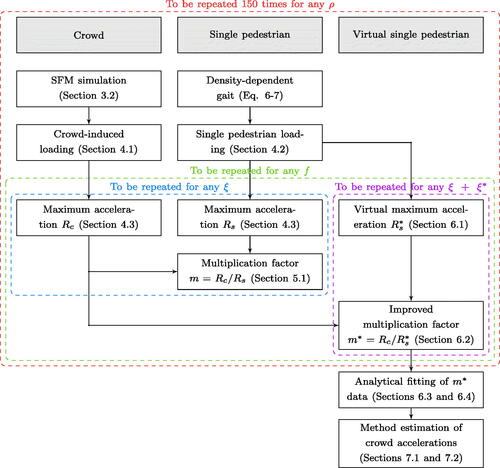
In the first place, pedestrian flow simulations are conducted by means of the SFM, a widely used crowd model that simulates pedestrian motions based on Newtonian mechanics (Helbing & Molnár, Citation1995). Starting on the sole number of occupants, the SFM allows to investigate the crowd dynamics from a microscopic perspective: each pedestrian is treated individually, assigned with initial gait parameters selected at random and with collective rules of conduct to be respected. The basics of the SFM are introduced in Section 3.1, while its detailed application (specifically arranged for unidirectional pedestrian motion in non-panic regime) is outlined in Section 3.2. Analyses aimed at the statistical characterization of simulated gait parameters are presented in Section 3.3. The SFM outputs, namely the 2-D time-varying position and velocity of each subject belonging to the crowd, are then used as inputs for the definition of the crowd-induced load on a step-by-step basis (Li, Fan, Nie, Li, & Chen, Citation2010), in keeping with Section 4.1.
The simulated crowd is then coupled with a representative single pedestrian, designed to have a walking speed and a step frequency that are physically compatible with the examined crowd density. The single pedestrian loading is determined as specified in Section 4.2, based on a deterministic moving multi-harmonic load (Young, Citation2001). The structural response due both to crowd and single pedestrian is established as the maximum acceleration at the footbridge mid-span, in line with the procedure set out in Section 4.3. Then, the multiplication factor is derived as the ratio of the crowd-induced acceleration to that caused by its representative single pedestrian, both assessed on the footbridge under consideration. Such a result strictly complies with a precise circumstance, namely with a specific set of crowd density, natural frequency, and damping ratio of the footbridge fundamental mode.
To confer high applicability and statistical reliability to the method, this procedure is carried out for different crowd-structure scenarios and repeated several times. Indeed, it is only when a huge amount of multiplication factors is available that an overall analysis can be performed. Once different-sized pedestrian groups (with crowd densities varying from 0.2 to 1.5 ped/m2) crossing footbridges of various natural frequencies and structural damping ratios (among the ranges [] Hz and [
]%, respectively) are handled in this respect, almost three million multiplication factors are derived in compliance with Section 5.1.
Simulated multiplication factors are highly sensitive to crowd and structure parameters. Section 5.2 presents a comparison against some earliest multipliers of the literature (Bachmann & Ammann, Citation1987; Fujino et al., Citation1993; Grundmann et al., Citation1993), quite coherent with simulated ones in their respective supporting hypotheses. Derived multiplication factors are linked to probabilistically modelled crowds and deterministic single pedestrians, as discussed in Section 5.3. This is aimed at avoiding time-consuming Monte Carlo analyses at the design stage; hence, a less onerous alternative to achieve consistency between simulated crowds and single pedestrians is sought to simplify the analytical modelling. With this purpose, a virtual footbridge is devised for single pedestrians, overdamped with respect to that crossed by walking crowds as specified in Section 6.1. Improved multiplication factors are thereby evaluated in Section 6.2 for all the examined casuistry, obtained as the ratio of crowd to virtual single pedestrian accelerations.
Improved multiplication factors are therefore grouped by crowd density and structural damping. In Section 6.3, the mean trend versus frequency of each cluster of data is submitted to a fitting procedure, and the parameters of the frequency-dependent fitted function are analytically defined as functions of crowd density and damping ratio. Later to the average trend, also the 95th percentile of numerical improved multiplication factors is submitted to a fitting modelling, as shown in Section 6.4. Once analytical definitions are established, the method can be applied to predict two characteristic values of the maximum crowd-induced acceleration: average and 95th percentile, as respectively illustrated in Section 7.1 and Section 7.2. The impact of geometric and modal parameters on the estimated structure response to crowd excitation is discussed in Section 7.3. Finally, Section 8.1 and Section 8.2 respectively deal with the comparison of simulated accelerations with some of the current codes of practice (BSI, Citation2008; HIVOSS, Citation2008; ISO 10137, Citation2007; SETRA, Citation2006) and with the experimental full-scale tests performed by Van Nimmen et al. (Citation2021).
3. Crowd dynamics modelling
This section rules the crowd dynamics management. To comply with human intelligent cognitive behaviours, crowd simulations are conducted through the SFM. The latter works on the microscopic scale and generates pedestrians who interact with each other at a highly detailed level, allowing full and direct governance of inter-subject variability and HHI. Moreover, in the event that a pedestrian experiences interaction with others and/or boundaries, his/her personal variability is accomplished as well. The SFM is briefly introduced in Section 3.1, whereas Section 3.2 is focused on its specific implementation. Lastly, gait parameters derived from the executed simulations are analysed in Section 3.3.
3.1. Social force model
The SFM is a widely appreciated microsimulation tool that describes the pedestrian motion as ruled by the so-called ‘social forces’, collective psychological motivations triggered by categorized environmental stimuli. Starting from the original version proposed by Helbing & Molnár (Citation1995), several arrangements of the SFM have been released to date. These are mainly proposals set up for the management of non-ordinary circumstances (building evacuation in panic regime, safety assurance at public establishments or events, etc.), fields for which the simulation of pedestrian flows plays a prominent role (Chen, Treiber, Kanagaraj, & Li, Citation2017). Although not as common, some applications of the SFM to the serviceability assessment of footbridges can also be found in literature (Jiménez-Alonso et al., Citation2016; Venuti et al., Citation2016; Wei, Van Nimmen, De Roeck, & Van Der Broeck, Citation2021).
To simulate unidirectional pedestrian flows on footbridges, the present work makes use of the SFM version revised by Bassoli & Vincenzi (Citation2021), who customised the classical model (Helbing, Buzna, Johansson, & Werner, Citation2005) to the fundamental speed-density relation offered by Weidmann (Citation1993). The latter is one of the best-known pedestrian adaptions to the motorised urban road traffic ‘Kladek formula’ (Kladek, Citation1966), and represents the natural decline of mean crowd velocity with increasing crowd density. In line with the flow simulations carried out by Bassoli & Vincenzi (Citation2021), each generic participant is subject to three social forces, reflecting the natural propensity for unrestricted walking (driving term), the inner mechanism of inter-pedestrian collision avoidance (repulsive effect among pedestrians), and the psychological reluctance towards side limits (repulsive effect of boundaries). Attractive forces and random fluctuations from the optimal conduct are instead neglected, in keeping with most of the SFM applications available in the literature (Helbing & Molnár, Citation1995; Johansson, Helbing, & Shukla, Citation2007).
The SFM implementation of Bassoli & Vincenzi (Citation2021) is briefly formulated in the following. At any time, the instantaneous position and velocity
of any generic pedestrian α are governed by the equation of motion as:
(1)
(1)
where
and
are the vectors collecting the pedestrian time-varying positions and velocities in X-Y space, respectively, with X and Y directions aligned parallel and orthogonal to the footbridge centreline. Positions and velocities are in m and m/s, while social forces are expressed in m/s2, since a unit mass is considered in defining accelerations. The acceleration force
acting on pedestrian α over time is defined as:
(2)
(2)
comprising the contributes of driving term,
repulsive interactions with other pedestrians β,
and repulsion towards boundaries i,
In this, N represents the number of pedestrians occupying the footbridge.
The driving term represents the intention of each pedestrian to walk at their desired speed in their intended direction of motion
calculated at each time step as the shortest route to the exit of the footbridge. Furthermore, deviations of the actual velocity
from the desired one
are managed by the so-called relaxation time
(3)
(3)
The repulsive effect among pedestrians describes that pedestrian α aims to preserve his/her personal space from other pedestrians β:
(4)
(4)
with the intensity of reluctance dictated by their distance dαβ with respect to the collision condition, calculated as the sum of their private area radii
assuming a homogeneous population (
). To avoid the unrealistic behaviour for which two pedestrians alter their trajectory ever since they are far apart, the repulsive force is actually activated only when
Parameters
and
respectively identify the repulsive interaction strength and range,
is the normalized vector pointing from pedestrian β to α, while
is the angle between the desired direction of motion
and the direction
of the pedestrian exerting the repulsive force. Finally, parameter
allows to account for the anisotropic nature of pedestrian interactions.
A key point of the adopted SFM version (Bassoli & Vincenzi, Citation2021) is that it overcomes one of the basic shortcomings of the social force model, related to the shape of the private area around the pedestrian. A walking person is typically more influenced by who is in front rather than those behind, implying that the aforementioned shape should not be circular but asymmetric. Otherwise, the classical SFM predicts that a slower person is going to speed up if a faster person approaches from behind, whereas a simple overtaking would take place in real conditions. Analytically, this issue is being tackled by considering the so-called anisotropic behaviour parameter less than one.
Except for the anisotropic behaviour, the repulsive effect of borders is similar to the repulsion among pedestrians:
(5)
(5)
monotonically decreasing with the distance
between the boundary i and the pedestrian α. Similarly to the repulsion force among pedestrians,
and
are the repulsive strength and range, and
the vector pointing from i to α. For further details regarding the SFM formulation, the reader is referred to the work of Bassoli & Vincenzi (Citation2021).
3.2. Pedestrian flow simulations
The structure designed to accommodate the crowd simulations is 3 m of width by 40 m of length (dimensions labelled B and L in the following), leading to a deck area A of 120 m2. In this respect, the influence of the footbridge geometry on the flow simulations will be discussed in detail in Section 7.3. Each generic pedestrian α is provided with a set of starting conditions: initial position and initial/desired velocity
The first is randomly selected within a 40 m long access route to the footbridge - being careful to keep each pedestrian private area free from other individuals - whereas the latter is drawn from
(1.34, 0.26) m/s, a widely adopted statistical distribution that describes typical pedestrian speeds in unrestricted traffic conditions (Buchmüller & Weidmann, Citation2006). To avoid unrealistic values, the above-mentioned distribution is limited to
m/s.
Social forces are formulated as outlined in Section 3.1 in keeping with Bassoli & Vincenzi (Citation2021), whose meta-parameters are listed in . Initial conditions and social forces are implemented on a system of first order differential equations, where N indicates the number of simulating pedestrians. The latter is solved numerically through a MATLAB routine, to evaluate each pedestrian time-varying position and velocity in X-Y space. To ensure a constant number of people N on the structure over time, once a pedestrian completes the crossing, a new pedestrian is positioned at the footbridge start. The incoming pedestrian is assigned the last recorded 2-D velocity and Y-position values of the outgoing pedestrian, to ensure that incoming pedestrians realistically adhere to the ongoing crowd flow. In this, the management of incoming and outgoing pedestrians is key to maintain a roughly stationary flow on the footbridge throughout the 400-second SFM analyses. The trajectory travelled by an example pedestrian on the footbridge, given by the set of all his/her SFM 2-D positions
in time, is shown in .
Figure 2. Example pedestrian crossing the footbridge: trajectory (black line), foot standing points on the trajectory (black markers), and projection of the foot positions on the bridge centreline (grey markers).
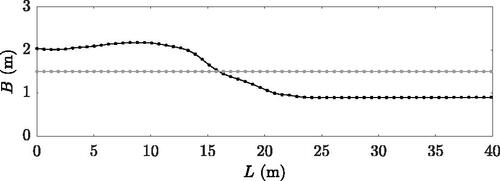
Table 1. Meta-parameters implemented in the SFM after Bassoli and Vincenzi (Citation2021).
It is worth commenting upon the personal variability, which occurs only when the pedestrian is disturbed by the surrounding environment. On the contrary, if the individual never approaches other people nor boundaries, his/her motion is just ruled by the driving term. In such event, his/her velocity remains constant during the whole simulation, coinciding with the randomly extracted initial one. To conclude, the SFM simulation enables personal variability (seen as individual speed variations over time), but does not guarantee its occurrence (variableness in personal velocity is not a beforehand imposition but a potential result). For this reason, a distinction is needed between the accomplished personal variability and the widely known intra-personal variability, which is innate and not induced by circumstances.
Different sized pedestrian crowds are simulated as specified above, including groups made of pedestrians. Such a selection is meant to attain crowd densities of
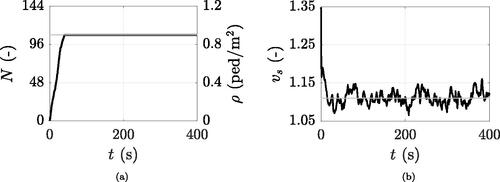
ped/m2, respectively. Indeed, although the input of the SFM is the number of participants N and not the crowd density ρ to be achieved, the latter can be foreseen in advance thanks to the incoming-outgoing pedestrian management process specified above. In this respect, shows that, after a transitory period consisting in people getting on the footbridge from the access route, the instantaneous crowd density stabilises at
and the average of people velocities (X and Y axes combined) settles according to the speed-density relation provided by Weidmann (Citation1993):
(6)
(6)
where ρ is expressed in ped/m2 and vs in m/s.
Figure 3. SFM simulated crowd made of 108 pedestrians: instantaneous (a) number of occupants and (b) mean crowd velocity in thick black, respective theoretical values in thin grey.
Since the random nature of the SFM inputs (i.e. starting positions and velocities) allows to obtain ever-changing results, each of the 14 above listed flow sizes is simulated 150 times, totalling over two thousand of different crowd scenarios. The number of runs (i.e. 150) is selected so as to pursue a high statistical integrity of results, whose convergence criteria is set out in terms of acceleration as specified in Section 4.3.
3.3. Simulated gait analysis
The simulation outcomes are herein discussed in terms of gait parameters, to check the appropriate reproduction of collective and personal variabilities versus crowd density as a confirmation of the SFM proper operation. Relying on literature, e.g. Ingólfsson (Citation2011), expectations on real crowds include that: (a) the inter-subject variability diminishes with increasing crowd density, as the traffic acts as a physical obligation to synchronisation, and (b) the intra-subject variability increases with increasing crowd density, as the subject has difficulty in adapting his/her rhythm to that required by the flow and tries impatiently to return to his/her desired pace, until the lack of space dictates an inexorable unison.
To validate such statistical guesses, the collective variability is calculated as the standard deviation of people average speed (m/s) and step frequency
(Hz), whereas the personal variability as the average of people standard deviations in terms of speed
(m/s) and step frequency
(Hz). In this, for each density, all participants to the 150 runs are considered together. Specifically, the time-varying speed
of each generic pedestrian α is evaluated as the combination of the instantaneous velocities in X and Y directions arising from the SFM. Then, pedestrian α time-varying pacing frequency
is derived via the cubic relation offered by Bruno & Venuti (Citation2008):
(7)
(7)
where
is expressed in Hz and
in m/s. The above equation is based on experimental records performed by Bertram & Ruina (Citation2001), implying that its validity can be either assumed as
m/s or
m/s (in keeping with Bruno & Venuti (Citation2008) or Bertram & Ruina (Citation2001), respectively). Collective and personal variabilities in terms of velocity and pacing frequency are perfectly in line with expectations, as shown in and . However, it is worth remarking that SFM simulations describe a personal variability which is not natural but caused by the surrounding.
Figure 4. Standard deviation of personal simulated speeds (a) and step frequencies (b) versus crowd density.
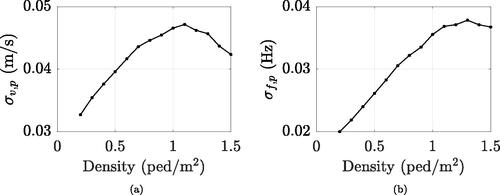
Figure 5. Standard deviation of collective speeds (a) and step frequencies (b) versus crowd density: simulations (dot markers) and analytical proposal (grey line).
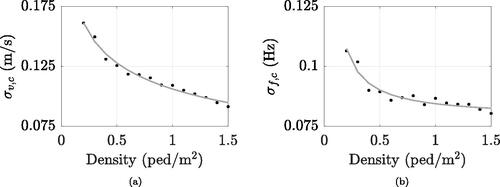
For this reason, estimated personal variabilities do not coincide with the so-called intra-subject variability, but are just a portion of it. On the other hand, obtained collective variabilities can be regarded as the proper inter-subject variability, hence not only qualitative but also quantitative discussions are in this case of significance. Estimated density-dependent collective variabilities are quite in line with Wei et al. (Citation2021) findings up to 1 ped/m2: for higher densities the simulated trend keeps on being monotonic (see ), which is perfectly in accordance with expectations. Analytically, estimated collective variabilities can be described by density-dependent power functions reading:
(8)
(8)
resulting in the grey lines of , fitting simulated data with coefficients of determination pairs to 0.98 and 0.93, respectively.
4. Simulated accelerations
This section concerns the post-processing of SFM results. Each simulated crowd is managed as follows. The time-varying positions and velocities of pedestrians arising from the SFM are converted into a space- and time-dependent crowd loading, as described in Section 4.1. In parallel, the load imparted by a single pedestrian representing the relevant crowd is also established, in line with Section 4.2. Both crowd and single pedestrian forces are then applied on different footbridges, listed in Section 4.3, so as to define their respective maximum accelerations.
4.1. Crowd-induced loading
Starting from the micro-scale outcomes returned by the SFM, the walking force induced by each pedestrian in the crowd is derived as a series of successive footfall forces. Finally, the crowd-induced loading is evaluated as the superimposition of all the individual walking forces. The next scheme describes the step-by-step treatment received by any generic pedestrian α:
The body weight
is extracted from a log-normal distribution featured by a mean of 73.85 kg and a standard deviation of 15.68 kg (Portier, Keith Tolson, & Roberts, Citation2007).
The 2-D trajectory is derived from the time-varying positions resulting from the SFM (see ), and the instantaneous velocities in X and Y directions are combined together to define the time-varying speed
Instants of application of the footfall forces are defined at
Foot standing points along the trajectory are identified as the 2-D positions occupied by pedestrian α at the corresponding application time instants. The 2-D problem is then reduced to a 1-D problem by projecting the foot standing points on the footbridge centreline, as shown in . This simplification is consistent with the fact bending modes only are considered (see Section 4.3).
The j-th footfall force is described as a Fourier series, in keeping with the single step force model offered by Li et al. (Citation2010):
The pedestrian walking force
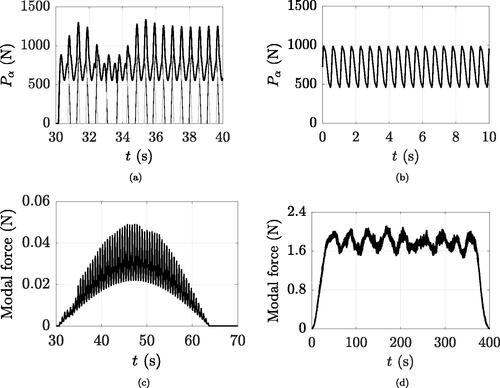
Figure 6. Implemented loadings: (a) force induced by a pedestrian who is part of a crowd (thick line), obtained by the superimposition of left (thin black lines) and right (thin grey lines) step forces; (b) force due to the crowd-coupled undisturbed representative single pedestrian; (c) modal force corresponding to (a); (d) modal force induced by the overall crowd.
In the end, the overall crowd loading is obtained by the superposition of all the involved person forces. This operation is ideally legitimate, in that the forces added together are exerted by participants who interacted with each other during the SFM simulations. The procedure allows to assemble footsteps different from one other, each depending on the SFM velocity which in turn depends on the surrounding conditions. However, if the pedestrian walks undisturbed, a steady speed is simulated by the SFM (see Section 3.2), and steps derived from the above specified procedure turn out to be all the same. In conclusion, the loading assembly procedure enables to accurately reproduce the personal variability, but the latter is strictly dependent on the flow simulation development.
4.2. Single pedestrian loading
Each simulated crowd density is assigned to its own single pedestrian, specifically designed to be representative of the crowd to which it is coupled. Differently from people belonging to the crowd, the single pedestrian is in this case supposed to produce a periodic walking force. This aims at limiting the computational burden of the method as much as possible. For this purpose, either the Li et al. (Citation2010) single step load model (arranged with the same footfall force at each step) or a moving multi-harmonic load could be used. As more practical to apply at the design stage, the latter is herein selected (the impact of this assumption in the method is discussed further on in Section 4.3). The following procedure is observed, so as to ensure that the single pedestrian walks: (i) at a velocity which is consistent with the density of the paired crowd, and (ii) with a step frequency which is physically sustainable at that specific speed:
The single pedestrian weight
Starting from the density ρ (ped/m2) to be represented, the single pedestrian steady speed vs (m/s) is evaluated via EquationEquation (6)
Once the velocity is established, the corresponding step frequency fs (Hz) is obtained through EquationEquation (7)
The single pedestrian walking force is obtained as the sum of n = 4 Fourier harmonic components corresponding to fs and integer multiples, as shown in :
with step frequency-dependent dynamic load factors (-) in keeping with Young (Citation2001), and zero phase shifts
(rad) to allow exact reproducibility.
Finally, the thus defined time-dependent load is treated as travelling in space with constant speed vs.
4.3. Maximum accelerations
Every crowd and single pedestrian loading are applied on over one thousand structures, having natural frequencies f varying from 0.5 to 5.5 Hz at 0.05 increments, and damping ratios ξ pairs to 0.1, 0.2, 0.5, 0.8, 1.0, 2.0, 3.0, 4.0, 5.0, 6.0, 7.0, 8.0, 9.0 and 10.0%. The inclusion of such high damping ratios is intended to account for HSI, the main effect of which is reproducible by increasing the damping of the unoccupied footbridge (Bassoli, Van Nimmen, et al., Citation2018; Živanović et al., Citation2009). Each of the considered structures is a 40 m long and 3 m wide simply supported beam, characterised by a linear dynamic behaviour and a modal mass of kg. This last value is chosen as typical for footbridges, even though it will be demonstrated further on that the modal mass is irrelevant in terms of multiplication factor (see Section 5.1).
Only the fundamental mode, namely the first bending mode having a half-sine mode shape, is dealt with. To calculate the modal force, the so far defined pedestrian loadings are weighted by the amplitude of the mode shape in correspondence of the footfall positions and divided by the modal mass. The modal force caused by a generic pedestrian α in the crowd is represented in , while shows an example of that exerted by a whole crowd, given by the sum of all pedestrian modal forces. Starting from the crowd-induced modal force, the footbridge response is evaluated by numerically integrating the equation of motion in the modal space, considering the footbridge as a single degree of freedom system and time increments of 0.001 s (see, for instance, Bassoli, Gambarelli, & Vincenzi (Citation2018)). The structural response is then selected as the maximum (in absolute value) of the mid-span acceleration time history.
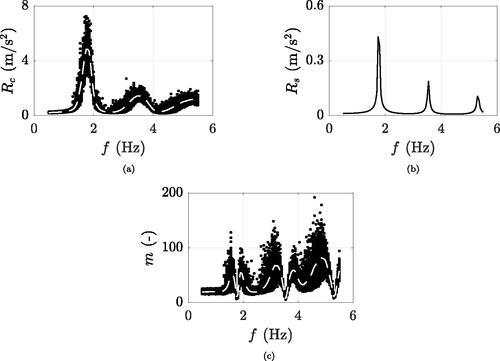
As an example, and show the maximum accelerations induced by the 150 simulated crowds (Rc) and by their corresponding single pedestrian (Rs) for a typical damping ratio of 0.5% and a crowd density of 0.9 ped/m2 (selected as central value within the accounted range of pedestrian traffic ped/m2). For such a density, the mean pedestrian velocity vs turning from EquationEquation (6)
(6)
(6) is 1.11 m/s, which corresponds to a mean pacing frequency fs of 1.77 Hz in keeping with EquationEquation (7)
(7)
(7) . Indeed, with reference to , the footbridges which turn out to be more sensitive to 0.9 ped/m2 crowds are those having a natural frequency of about 1.77 Hz and integer multiples. The peaks featuring the Rc trend are in fact products of a near-resonance occurrence, between the occupied structure and the (average) pedestrian excitation to which it is subject. Starting from the density of the matching crowd, the single pedestrian is designed to have gait parameters in compliance with EquationEquation (6)
(6)
(6) and EquationEquation (7)
(7)
(7) (see Section 4.2), resulting in the Rs peak frequencies almost coinciding with those of Rc (see, for instance, and ).
Figure 7. Example case of ped/m2 and
%: (a) crowd-induced maximum accelerations (150 simulated runs) in black and mean trend in dashed white, (b) maximum acceleration due to the crowd-coupled single pedestrian, (c) multiplication factors in black and mean trend in dashed white.
While the adoption of a step-by-step load model is crucial for pedestrians in crowded environments (where their movements are irregular as simulated by the SFM), integrating this model during the design phase poses certain challenges. Instead, opting for a moving multi-harmonic load as a reference condition for representative single pedestrians is more practical as less computationally demanding. To assess the impact of this decision on the method, footbridge accelerations resulting from periodic single pedestrians modelled with both step-by-step (Li et al., Citation2010) and moving multi-harmonic loads across various scenarios (including any combination of natural frequency, structural damping, and crowd density to be represented) were compared. This analysis yielded a mean coefficient of determination of 0.97, indicating that the selected load model does not result in substantial differences in terms of accelerations, upon which the method relies.
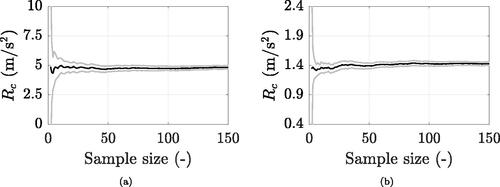
The average Rc corresponding to fixed crowd density, damping ratio and footbridge frequency is checked at increasing number of runs, together with t-distribution 95% confidence intervals (CIs). The acceptable mean-CI deviation is a priori selected as 5%, requirement largely satisfied by 150 runs for all density-damping-frequency combinations. Indeed, the mean and maximum deviation among all cases return 2 and 4%, respectively. For instance, depicts the example case of ped/m2,
%, and natural frequency f equal to 1.77 and 3.54 Hz (one and two times the typical pacing frequency at the examined density). The latter are selected as critical footbridge frequencies for the traffic level under consideration, since the maximum dispersion of Rc data exactly occurs at resonance (see, for instance, ).
Figure 8. Simulated mean crowd-induced maximum acceleration (black) and 95% confidence intervals (grey) to increasing number of runs: ped/m2,
% and (a) f = 1.77 Hz or (b) f = 3.54 Hz.
In this context, it is noteworthy to make an observation. In numerical simulations of crowd-induced accelerations, the only source of uncertainty is related to the loading, which arises from the variability in pedestrian paces as modelled by the SFM. Hence, there exists a single uncertainty that characterizes the uncertainty in the response. Indeed, all the other involved parameters (i.e. natural frequency, damping ratio, and crowd density) are variable but not probabilistic, thus precluding a comprehensive sensitivity analysis of uncertainties. Nonetheless, it is feasible to examine how a parameter, although deterministic, impacts the response variability. To this end, assuming all parameters uncorrelated, one is altered at a time while maintaining all the others coincident with the example values: ped/m2,
(-), f = 1.77 or 2.65 Hz. These latter two values delineate resonance and out-of-resonance conditions corresponding to the specified crowd density, respectively, depicted in black and grey in .
Figure 9. Standard deviation of numerically simulated crowd-induced accelerations, varying one parameter individually while keeping all others constant at their example values:
ped/m2,
(-), f = 1.77 (black lines) or 2.65 Hz (grey lines).
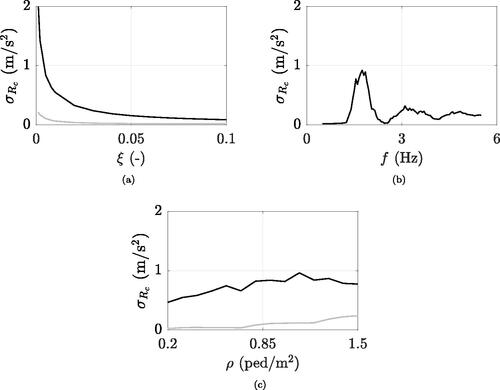
demonstrates that as the damping ratio decreases, the variability in the response increases. This is most pronounced in resonance cases, where small variations in the frequency content of the pedestrian load cause great variations in the dynamic amplification, especially for low damping ratios. In out-of-resonance conditions, small variations in the frequency content of the pedestrian force do not imply significant variations in the dynamic amplification factor and, consequently, in the structural response. This is also confirmed by , which shows how, for a given crowd density (supposed to walk at a specific mean pacing frequency), small variations in the natural frequency result in different levels of dispersion in the response. Regarding crowd density (refer to ), in the near-resonance scenario (black curve), the response remains nearly constant regardless of the traffic level: what proves significant is not the quantity of pedestrians, but rather how closely their pace, simulated by the SFM, aligns with the natural frequency of the footbridge. In out-of-resonance cases (grey line), the response is significantly influenced by a small number of pedestrians who, by chance (and independent of the average behaviour of the crowd), match the natural frequency of the structure. Consequently, as the probability of such event increases with the number of walking individuals, the variability in the response escalates with the density. However, for densities higher than about 1.1 ped/m2, the coefficient of variation (defined as the ratio of the standard deviation to the mean value of the acceleration response, not shown in the figure) remains almost the same in both the near-resonance and out-of-resonance scenarios, showing dependence on the acceleration level only.
5. Multiplication factors
This section complies with the multiplication factor definition and analysis. Section 5.1 deals with the determination of numerically simulated multiplication factors, and Section 5.2 compares them against literature (Bachmann & Ammann, Citation1987; Fujino et al., Citation1993; Grundmann et al., Citation1993). Finally, Section 5.3 addresses a probabilistic discussion which causes analytical complexity, introducing the need for virtual parameters in favour of simplicity.
5.1. Simulated data
For each scenario, i.e. for every run of any pedestrian group among those listed in Section 3.2 crossing any footbridge among those outlined in Section 4.3, a multiplication factor m is derived by computing the ratio of the crowd-induced acceleration Rc to that exerted by its corresponding single pedestrian Rs. With reference to the example case shown in , each m data (black dot of ) is calculated as the ratio of the maximum acceleration induced by one of the 150 simulated crowds (black dot of ) to that caused by its paired single pedestrian (point value in ).
Note that the modal mass only affects the modal force (see EquationEquation (17)(17)
(17) ), and consequently the acceleration. This implies that, since the modal mass has the same effect on the calculation of both accelerations (crowd and corresponding single pedestrian), its impact is elided while calculating m. In conclusion, Rc and Rs do depend on the selected modal mass, whereas their ratio m is absolutely independent of it. The same consideration also applies to the mode shape, which equally influences the modal force (and acceleration) of both crowd and single pedestrian. Therefore, m is also unaffected by the mode shape. As a consequence, despite simulated multiplication factors are related to a fundamental bending mode case (i.e. half-sine mode shape), its application is suitable for any vertical mode.
5.2. Comparison with relevant studies
In the following, the mean trend of the simulated multiplication factors is compared to some multipliers coming from the literature. Among them, those of Bachmann & Ammann (Citation1987), Grundmann et al. (Citation1993), and Fujino et al. (Citation1993) are examined, respectively suggesting
and
In the example case of 0.9 ped/m2 (corresponding to N = 108 pedestrians, being the deck area A equal to 120 m2), the latter return
and
as depicted in . Simulated m are fairly consistent with literature multipliers when the footbridge natural frequency is close to the crowd mean pacing frequency and integer multiples. As already discussed in Section 1, multiplication factors suggested by previous research are, in fact, calibrated on specific footbridge frequencies (i.e.
and
Hz), with pedestrian pacing frequencies synchronized with the footbridge. As a consequence, the lack of correspondence in off-resonance cases is reasonable and not regarded as a failure, but rather a sign that the validity of literature multipliers might be restricted to their relevant tuning scenario.
Figure 10. Simulated multiplication factor (in black) compared to the literature (Bachmann and Ammann (Citation1987) in dashed red, Grundmann et al. (Citation1993) in dash-dotted green, and Fujino et al. (Citation1993) in dotted blue): (a) specific crowd density and structural damping ( ped/m2,
%), (b) fixed natural frequency depending on the crowd density.
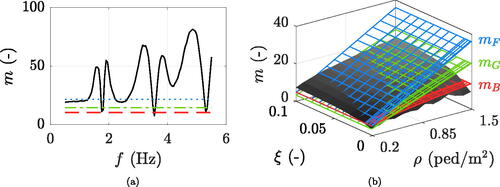
shows m data in case of a perfect resonance occurrence, thus for fixed but density-dependent natural frequencies, established through EquationEquation (6)(6)
(6) and EquationEquation (7)
(7)
(7) applied in sequence. In addition to natural frequencies, multiplication factors of literature are also tuned to specific levels of traffic, namely
and
ped/m2. Their matching with the simulated m is indeed variable with crowd density. Broadly speaking, in case of typical footbridge dampings, the Bachmann & Ammann (Citation1987) multiplier is well reproduced by simulations quite independently on the crowd density. All this is regarded as a significant achievement for validation purposes and suggests that classical multiplication factors might be not enough conservative outside their calibration domain.
5.3. Discussion
Ideally, given a set of crowd density and structural damping, the multiplication factor m is expected to be maximum when the footbridge natural frequency matches the mean pacing frequency of the crowd and multiples. The reason why m is instead minimum (see, for instance, ) is briefly discussed in the following, with reference to the example case of ped/m2 and
%. As the footbridge natural frequency matches 1.77 Hz (perfect resonance), both crowd and single pedestrian maximum accelerations are greatest (see and ). Instead, if a near-resonance is considered (natural frequency close but not equal to 1.77 Hz), the crowd-induced maximum acceleration Rc lightly decreases with respect to perfect resonance, whereas that of the single pedestrian Rs strongly declines. Thus, against expectations, the ratio of Rc to Rs increases as the f to the typical fs (and multiples) distance increases.
This is given by the different acceleration peak widths for Rc and Rs: the first is probabilistically modelled (as an average of 150 simulations made of a wide variety of participants) whereas the latter is not. As deterministic, the single pedestrian only excites a footbridge which matches his/her exact pacing frequency, which leads in the Rs peaks being narrower compared to Rc. To fix the above-mentioned inconsistency, not only Rc but also Rs should be statistically derived. However, this solution implies a significant consumption of time which does not meet the design stage requirements. In light of this, an alternative based on virtual parameters for the single pedestrian response simulation has been developed, as illustrated in the following.
6. Improved multiplication factors
In this section, improved multiplication factors are introduced. The latter are based on the definition of virtual single pedestrians, who walk on an overdamped footbridge as specified in Section 6.1. Improved multiplication factors are simulated in Section 6.2, and analytically defined in Section 6.3 (average trend) and Section 6.4 (95th percentile).
6.1. Virtual single pedestrians
To overcome what discussed in Section 5.3, the method involves resorting an extra damping to footbridges crossed by single pedestrians with respect to those trampled on by crowds. This extra damping is tasked with replicating the variability of the crowd also in the single pedestrian: since such randomness is globally recognised as density-dependent,
(-) is defined to vary proportionally with the pacing frequency collective variability
of EquationEquation (8)
(8)
(8) , namely:
(11)
(11)
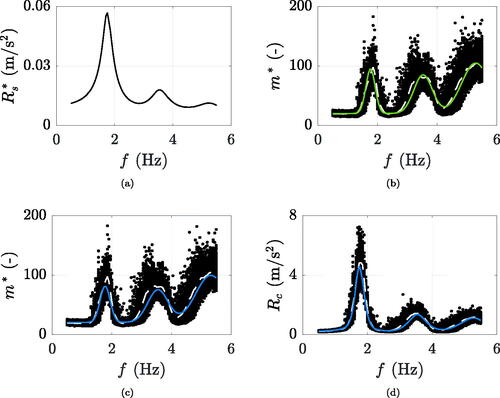
Analyses indicate that coefficient k is close to unity, for simplicity set equal to 1 in the following. Except for the damping, virtual single pedestrians are treated exactly the same as single pedestrians (see Section 4.2), leading to maximum accelerations As intended,
features widened peaks with respect to Rs (see, for instance, and , respectively).
Figure 11. Example case of ped/m2 and
%: (a) maximum acceleration due to the crowd-coupled virtual single pedestrian; (b-c) simulated improved multiplication factors in black, mean trend in dashed white, (b) fitted function in solid green, and (c) analytical function in solid blue; (d) simulated crowd induced maximum accelerations in black, mean trend in dashed white, and analytical prediction in solid blue.
The setting of the additional damping (i.e. the definition of EquationEquation (11)(11)
(11) ) was motivated by extensive preliminary analyses. Single pedestrians walking on footbridges with a dense range of test damping ratios (from 0.1 to 20% at 0.1 increments) were simulated, and the coefficient of determination R2 between one-normalized crowd and single pedestrian maximum induced accelerations was calculated for every scenario, as the goal was to increase the affinity of their shapes. The optimal extra damping was then defined as the one which maximizes the R2, revealing a strict similarity to the step frequency collective variability.
6.2. Simulated data
The definition of a virtual single pedestrian leads to an improved multiplication factor (calculated as the ratio of Rc to
), whose maximum values are actually located at mean crowd step frequency and multiple integers, as demonstrated by . However, in addition to the width, peaks of Rs and
also differ in terms of amplitude, which is why m and
are not directly comparable. The definition of an improved multiplication factor is meant to simplify the analytical modelling of the method, as demonstrated by the different levels of complexity between m and
average trends (white dashed lines in and , for instance), with the latter being vastly easier to be described analytically.
The data is hereinafter submitted to a fitting process, aimed at its analytical definition versus crowd density, footbridge frequency and damping ratio. Once the latter is calibrated, the mean maximum acceleration due to crowd excitation can be simply estimated having recourse to a virtual single pedestrian only.
6.3. Analytical modelling of the average trend
With the view to analytically define the mean crowd-induced maximum accelerations, the numerical data average trend of each density-damping cluster is subject to a fitting procedure. It is recalled that each density, independently of the damping, is featured by its own typical fs. The latter derives from the sequentially adoption of EquationEquation (6)
(6)
(6) and EquationEquation (7)
(7)
(7) starting from the examined crowd density and represents the average pacing frequency among the crowd. The fitting function that manages the average trend of
consists in the sum of three bell-shaped functions and a constant d:
(12)
(12)
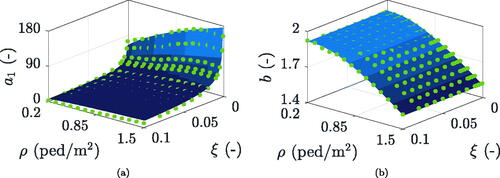
Parameters a and b are, respectively, the amplitude of the curve peaks and the position of the peak centres, while c controls the bells width. The three bell functions meant to fit the peaks are forced to have multiple positions (i.e. b, 2b and 3b), but the fundamental one is not assumed equal to the above specified fs: despite the fact b is supposed to match fs, the fitting procedure is being used to validate this hypothesis. In conclusion, the curve fitting is ruled by eight parameters, namely a1, b, c1, a2, c2, a3, c3, and d.
With reference to the density-damping cluster used as example, its respective fitted function is represented in green in . Similar results are obtained also for the other clusters, and for each of them the fitted eight parameters are recorded and noted down. The latter can be therefore analysed versus crowd density and structural damping, so as to analytically define them through density- and damping-dependent functions. illustrates the cases of a1 and b, but even the other six parameters are subject to similar procedures. Each green dot represents the parameter of the fitted function corresponding to a specific cluster (i.e. to particular density and damping). As expected, the b data, namely the green dots of , match up fairly well the theoretical density-dependent mean step frequency, represented by the blue surface of the same figure. With a coefficient of determination R2 pairs to 0.99, the hypothesis of b = fs is thus definitively regarded as correct. Apart from b, which is evaluated by EquationEquation (7)(7)
(7) into EquationEquation (6)
(6)
(6) , the other six parameters are described as follows, all reaching R2 values around 0.95. Since c1, c2, and c3 data are found to be interrelated and almost constant versus density and damping, their analytical description is defined as
and
Also a1, a2, and a3 data reveal intercorrelation, but they are strictly dependent on density and damping (see ). Leading to the blue surface of , parameter a1 is analytically defined as:
(13)
(13)
where ρ is expressed in ped/m2, A in m2, and ξ is dimensionless (percentage value over 100). Parameters a2 and a3 are turned into a1 functions as
and
Similarly to parameter a1, the analytical definition of d reads:
(14)
(14)
with units of measurement coinciding with those specified for EquationEquation (13)
(13)
(13) .
Figure 12. Analytical definition (blue surfaces) of two out of eight parameters, based on the discrete values resulting from the simulated improved multiplication factor mean trend fitting (green dots).
In conclusion, the average trend of the data set - which serves to reproduce average maximum crowd-induced accelerations starting from a virtual single pedestrian - is analytically defined through eight parameters, some of which are constant and other expressed as functions of density and damping. provides an overview of the analytically modelled coefficients, whose implementation into EquationEquation (12)
(12)
(12) do produce the analytical
In the case set as example before, this procedure results in the blue curve of .
Table 2. Analytical definitions of coefficients a1, a2, a3, b, c1, c2, c3, and d. In this, fs follows EquationEquation (6)(6)
(6) and EquationEquation (7)
(7)
(7) adopted in sequence, ρ is expressed in ped/m2, A in m2, and ξ is unitless (-).
6.4. Analytical modelling of 95th percentile
This section deals with the 95th percentile maximum accelerations whose prediction requires to analytically define the
data 95th percentile. For the latter, a modelling approach similar to that employed in Section 6.3 for the average trend could be applied, so as to obtain its definition as a function of a similar number of coefficients. However, an alternative approach is adopted, opting for a method that yields very similar results while involving fewer parameters.
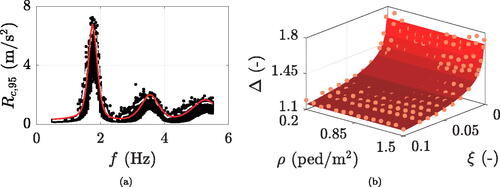
For the elements of each density-damping cluster, the ratio of 95th to 50th percentiles versus frequency is calculated, and its mean value along natural frequency Δ is recorded. This equal determining, for any scenario, the average ratio of 95th percentile to average crowd-induced maximum accelerations, respectively marked in white in and for the case of example. The thus determined Δ elements (represented by the orange dots of ) are subject to a power fitting in (unitless) ξ variable, given the missing influence of crowd density. Its calibration turns:
(15)
(15)
whose application results in the red surface of , achieving a coefficient of determination of 0.97. In this way, the analytical definition of the
95th percentile reads:
(16)
(16)
Figure 13. Example case of ped/m2 and
%: (a) simulated crowd induced maximum accelerations in black, 95th percentile in dash-dotted white, and analytical prediction in solid red; (b) analytical definition (red surface) of the Δ factor, based on the discrete values resulting from the ratio of 95th to 50th percentiles of simulated maximum crowd-induced accelerations (orange dots).
being calculated based on EquationEquation (12)
(12)
(12) .
7. Simplified estimation of crowd-induced accelerations
The analytical improved multiplication factors (50th and 95th percentile) are easily applicable to serviceability verifications, which generally deal with specific circumstances. The proposal on the average trend is discussed in Section 7.1, whereas the 95th percentile is faced in Section 7.2. Lastly, the impact of geometric and modal parameters on acceleration predictions is discussed in Section 7.3.
7.1. Average maximum accelerations
Since the mean trend of the improved multiplication factor is analytically defined, the method is capable of estimating the average maximum crowd-induced acceleration by just computing the maximum acceleration due to a virtual single pedestrian. When specific natural frequency
(Hz), damping ratio
(-), and crowd density
(ped/m2) have to be assessed, the procedure to be followed is that schematically outlined by the flowchart of (first part) and summarised in the following. Note that the method allows for the inclusion of the HSI effect on structural dynamic properties, implementing the equivalent modal parameters of the coupled crowd-structure system (evaluated, for instance, as outlined by Bassoli, Van Nimmen, et al. (Citation2018)). Concluding,
and
may represent the properties of the empty footbridge or the equivalent ones, contingent upon whether the HSI effect is accounted for:
Figure 14. Method prediction of the accelerations Rc (average maximum) and (95th percentile maximum) induced by a crowd density
within
ped/m2 on a footbridge whose natural frequency
and damping ratio
are between
Hz and
(-), respectively. In case of considering HSI, replace
and
with the dynamic properties of the crowd-structure coupled system.
![Figure 14. Method prediction of the accelerations Rc (average maximum) and Rc,95 (95th percentile maximum) induced by a crowd density ρ¯ within [0.2,1.5] ped/m2 on a footbridge whose natural frequency f¯ and damping ratio ξ¯ are between [0.5,5.5] Hz and [0.001,0.1] (-), respectively. In case of considering HSI, replace f¯ and ξ¯ with the dynamic properties of the crowd-structure coupled system.](/cms/asset/891643f5-9f41-4da0-85b4-6c9008ae72fa/nsie_a_2386456_f0014_b.jpg)
First, EquationEquation (6)
Once the representative gait is established, the single pedestrian multi-harmonic loading
To characterize the virtual structure, the extra damping
The maximum acceleration
Then, the definition of the improved multiplication factor is needed. In keeping with , coefficients a1, a2, a3, c1, c2, c3, and d are calculated as constants or functions of
Finally, the prediction of the crowd-induced acceleration (average maximum) is obtained by multiplying
Still referring to the density-damping cluster of , the average crowd-induced maximum accelerations predicted by the method turn out to satisfactorily match the mean trend of the maximum accelerations resulting from the SFM simulated crowds (depicted in white within the same figure) all along the examined natural frequency range. A good agreement between predicted and simulated accelerations versus footbridge frequency is also achieved for all the other density-damping clusters, with coefficients of determination averaging around 0.92 and never dropping under 0.80.
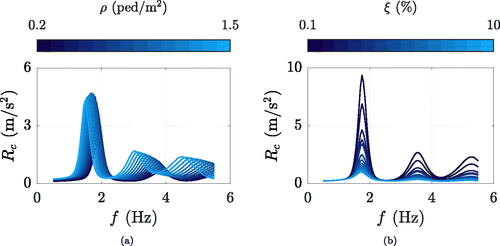
shows an overlaying of all the estimated average crowd-induced accelerations, for a specific footbridge damping as crowd density varies () and for a fixed density at varying damping (). It is worth of note that the worst-case scenario, i.e. the one that generates the greatest structural acceleration, does not necessarily coincide with the highest crowd density. Indeed, two effects do determine the maximum footbridge acceleration: (i) the increase of modal force with crowd density (although in a non-proportional way due to HHI), which implies a general increase of the structural response, and (ii) the decrease of step frequency as the crowd density increases, which may magnify or reduce the structural response depending on whether it comes towards or away from the footbridge natural frequency. These two effects may interact in a constructive or destructive way.
Figure 15. Overlay of crowd-induced maximum accelerations predicted by the method referring to (a) fixed damping ratio (%) and varying crowd density, and (b) fixed crowd density (
ped/m2) and varying damping ratio.
To provide numerical evidence in support of this study, the two footbridges of are used as examples. They have the same structure damping of 0.5% and different natural frequencies, pairs to 1.5 and 2.0 Hz. Maximum crowd-induced accelerations derived from the SFM analyses (black dots) are shown together with their mean trend (red line), calculated along the 150 analyses simulated for each crowd density. When the two effects specified above interact constructively, the crowd-induced acceleration simply increases with crowd density. This occurs, for instance, for a footbridge frequency of 1.5 Hz, as shown in . On the contrary, when the two effects are mutually opposite, the trend of the crowd-induced accelerations decreases (or otherwise not manifestly increases) with crowd density. Such a situation is experienced, for instance, by the bridge depicted in , having a natural frequency of 2.0 Hz.
Figure 16. Crowd accelerations (maximum values) resulting from the post-processed SFM (black dots) and relevant mean trend (red line) for % and f equal to (a) 1.5 and (b) 2.0 Hz.
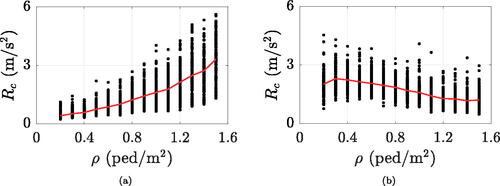
The first effect is absolute, i.e. equally valid for both the structures: a dense crowd is the most adverse condition because of its weight. As regards instead the second effect, the two example footbridges behave differently. The gravest situation for a structure with 1.5 Hz natural frequency is induced by a highly dense crowd, i.e. 1.5 ped/m2: such a density corresponds to a mean pedestrian velocity vs of about 0.81 m/s (EquationEquation (6)(6)
(6) ), which in turn equates to a mean step frequency fs of approximately 1.51 Hz (EquationEquation (7)
(7)
(7) ), adept at producing resonance with a footbridge natural frequency of 1.5 Hz. Conversely, the worst forcing density for a structure natural frequency of 2.0 Hz is a little one, which enables unrestricted walking (traffic up to 0.3 ped/m2, approximatively). Indeed, the latter corresponds to mean speed and pacing frequency around 1.34 m/s (EquationEquation (6)
(6)
(6) ) and 1.91 Hz (EquationEquation (7)
(7)
(7) ), respectively.
7.2. 95th percentile maximum accelerations
As regards the estimation of 95th percentile maximum accelerations due to crowd excitation, the process to be followed is regulated by the last part of the flowchart of , as explained in the following. As well as in the above Section 7.1, a specific set of natural frequency (Hz), damping ratio
(-), and crowd density
(ped/m2) is dealt with, as typical for actual footbridge vibration assessments. Depending on whether the HSI is taken into consideration, implemented modal parameters might be either those of the empty structure or the equivalent crowd-structure coupled system:
The mean improved multiplication factor
The factor Δ, which represents the average ratio of numerical improved multiplication factors 95th to 50th percentile versus frequency, is obtained via EquationEquation (15)
Once Δ is analytically determined, the 95th percentile improved multiplication factor
Finally, the 95th percentile maximum crowd-induced acceleration
shows the case of example, comprising the 95th percentile of the maximum accelerations imparted by the SFM simulated crowds, together with that predicted by the method. Moreover, other density-damping combinations are illustrated in . Estimated and computed responses are in line with each other, in those shown as well as in all other cases, with coefficients of determination ranging from 0.83 to 0.98.
7.3. Impact of geometry and modal parameters
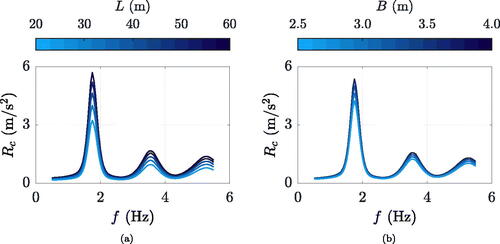
The analytical expression of the improved multiplication factor as a function of is meant to assign, with equal density, relevance to the footbridge deck area A. To check the versatility of the method in terms of footbridge geometry, further analyses are performed. For all the examined densities, the SFM is used to simulate 50 crowds crossing structures with lengths of 20, 30, 40, 50, and 60 m and widths of 2.5, 3, and 3.5 m, selected as typical dimensions for European footbridges. The average of simulated crowd-induced maximum accelerations (evaluated in line with Section 4) is compared to the mean maximum acceleration predicted by the method (determined as indicated in Section 7.1) for the examined ranges of crowd density, damping ratios and natural frequencies. The latter are illustrated in versus natural frequency, for a crowd density of 0.9 ped/m2 and 0.5% damping ratio to vary the length and the width of the footbridge, graphically proving the capability of the method to reproduce the geometry impact on structural accelerations. Considering all the clusters and the deck dimensions, coefficients of determination between predicted and simulated mean maximum accelerations turn around 0.93, demonstrating the effectiveness of the method in adapting to different footbridge geometries.
Figure 17. Example case of ped/m2 and
%: overlay of crowd-induced maximum accelerations predicted by the method at varying (a) footbridge length L (m) and (b) footbridge width B (m).
The designed model is independent of the modal mass, as the latter does not affect the improved multiplication factor for the same reasons discussed in Section 5.1. The latter also contains considerations on the mode shape irrelevance on pure multiplication factors, which also apply to improved ones. In conclusion, the method is calibrated on a symmetric (half-sine) bending mode, but the maximum acceleration contribution to any other vertical mode can be calculated. This enables the method to be applied to bridges with multiple spans as well, given that the deck geometry remains linear (otherwise, any curves present would affect the single pedestrian walking path). Moreover, the model foresees the possibility of combining the acceleration contribution of different bending modes. In this, to combine the response contributions (e.g. through the square root of the sum of the squares, SRSS), accelerations should be evaluated at the same footbridge section. Lastly, the method is also applicable to predict crowd-induced maximum Root Mean Square (RMS) accelerations, by multiplying the maximum RMS accelerations due to virtual single pedestrians by the designed improved multiplication factors. Considering all the scenarios, coefficients of determination between simulated and predicted maximum RMS accelerations (1 s of averaging time) are satisfactorily similar to the ones resulting on absolute maximums (specified in Section 7.1), demonstrating what stated above.
8. Comparison to existing codes and experiments
For validation purposes, the proposed model is compared to existing codes of practice (BSI, Citation2008; HIVOSS, Citation2008; ISO 10137, Citation2007; SETRA, Citation2006) and experimental records (Van Nimmen et al., Citation2021). Regulations are dealt with first.
8.1. Current regulations
Following lines are focused on national standards published in the past 15 years that deal with time domain force models for crowds and groups of pedestrians (BSI, Citation2008; HIVOSS, Citation2008; ISO 10137, Citation2007; SETRA, Citation2006). Maximum accelerations (120 s of analysis duration) resulting from the aforementioned vertical dynamic load models are depicted in . Simply supported beams with typical footbridge parameters (length, modal mass, mode shape, and natural frequencies as those indicated in Section 4.3, damping ratios of 0.5 and 1.0%) are considered, excited by crowd densities of 0.5, 0.8, and/or 1.0 ped/m2 depending on the relevant code recommendations. There is substantial discord of crowd-induced accelerations resulting from the guideline load models, confirming what already stated by other researchers (Georgakis & Ingólfsson, Citation2008; Zivanovic & Pavic, Citation2011).
Figure 18. Maximum crowd accelerations: (i) simulated through the post-processed SFM (black dots) with corresponding 95th percentile (white dash-dot line), (ii) estimated by the method (red line), and (iii) induced by the guideline forcings (violet point markers, blue dashed, green dash-dot and grey dotted lines respectively correspond to BSI (Citation2008), HIVOSS (Citation2008), ISO 10137 (Citation2007), and SETRA (Citation2006)) for six representative density-damping clusters, combining crowd densities of 0.5, 0.8 and 1.0 ped/m2 (in rows) to structural damping ratios of 0.5 and 1.0% (in columns).
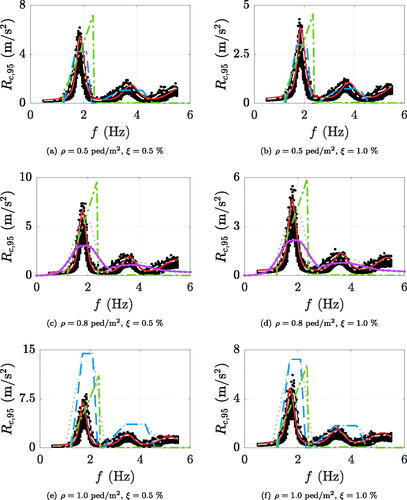
SETRA (Citation2006) and HIVOSS (Citation2008) tend to (i) overestimate the response along the f intervals which are mainly excitable at resonance by the first two harmonics of the pedestrian force in case of crowd densities beyond 1.0 ped/m2, and (ii) generally underestimates it in between. Effect (i) is a consequence of the overconservative assumption of perfectly synchronized people. On the contrary, the proposed method associates to an increase in density a decline in mean crowd velocity, but not a perfect synchronization among pedestrians. Effect (ii) should be avoided in favour of safety, for instance as suggested by Van Nimmen, Lombaert, De Roeck, & Van den Broeck (Citation2014).
For the application of ISO 10137 (Citation2007), the load is assumed as moving across the footbridge, with a density-dependent crossing velocity according to EquationEquation (6)(6)
(6) and with a resonant forcing frequency. Moreover, selected harmonics are the one(s) most capable of exciting resonance, i.e. the first when f lies between
Hz, the second for
Hz, and the third from 3.6 Hz. The standard generally leads to an overestimation of the response, as the loading model for multi-person traffic is
multiple of the response due to a single pedestrian, implying the conservative assumption that all people walk with the same pacing frequency and randomly distributed phase.
BSI (Citation2008) is less conservative than the other standards, both in the choice of the percentile value and in the use of 2.5 standard deviations of the response as an estimate of the peak response (four standard deviations are adopted by SETRA (Citation2006) for the same purpose), with logical reasoning that some exceedances of the predicted response should be allowed in real life (Živanović et al., Citation2010). Moreover, the most remarkable aspect of the code lies in the decision to probabilistically model pedestrians even for high density values.
8.2. Experimental tests
To experimentally validate the proposed method, estimated accelerations are compared with those recorded during the full-scale study carried out by Van Nimmen et al. (Citation2021) on the Eeklo footbridge. The structure is simply supported with land abutments at the sides and two piers at the midspan, having a width of 3.4 m (with 2.83 m wide free passage profile) and a total length of 96 m (42 m of main central span and two side spans of 27 m each). The first vertical bending mode is dealt with, whose dynamic properties are publicly shared by the authors (Van Nimmen et al., Citation2021) comprising the component values of the mode shape The natural frequency is
Hz, the damping ratio 0.0019 (-), and the modal mass
kg. Van Nimmen et al. (Citation2021) also provided public access to the raw accelerations recorded during eight free walking events, including four tests with 73 persons (
ped/m2) and four tests with 148 persons (
ped/m2). Adopting detrend, high- and low-pass filtering with cut-off frequencies of 0.25 and 10 Hz, respectively, and Hampel identifier (Liu, Shah, & Jiang, Citation2004) for outlier removal, experimentally identified absolute maximum accelerations at the central span mid-section are listed in for each exciting event, together with their average value and standard deviation per density group.
Table 3. Free walking events performed on the eeklo footbridge by Van Nimmen et al. (Citation2021): identification names, crowd densities, experimental maximum accelerations at the mid-central-span, average maximum values per density group and corresponding standard deviations, average maximum accelerations simulated by the method, relative error.
To account for the HSI phenomenon, the equivalent crowd-structure damping is computed in compliance with Bassoli, Van Nimmen, et al. (Citation2018), suggesting a (unitless) equivalent damping ratio of (
ped/m2) or
(
ped/m2) depending on the traffic level. Other than the crowd density, the calculation of the latter also depends on the footbridge dimensions, modal properties, and mean pedestrian weight, here set equal to 725 N (73.85 kg) in keeping with the characterization adopted for single pedestrians walking alone and within crowds (see Section 4.2 and Section 4.1). Compared to the damping, the alterations in natural frequency and modal mass induced by the crowd are not equally notable for the specific application case and are therefore omitted. The procedure outlined in Section 7.1 is applied, turning into single pedestrians walking at
or
Hz on virtual footbridges having total damping ratios of
or
(-) in case of
and
ped/m2, respectively. With the same crowd density order, this leads to virtual single pedestrian induced accelerations at the mid-central-span of 0.0138 and 0.0134 m/s2, and average improved multiplication factors of 16.703 and 23.592 (-). Therefore, the method estimates a mean maximum crowd-induced acceleration equal to
m/s2 in case of 0.25 ped/m2, and
m/s2 with 0.50 ped/m2.
As indicated in , the relative error between experimental (average per density group) and simulated maximum accelerations is 2.9 and 10.1% for 0.25 and 0.50 ped/m2, respectively. This might be partly attributed to the artificial setup of the tests, which leads to distributions of step frequencies and walking speeds slightly differing from those predicted by empirical relations, as stated by the authors themselves (Van Nimmen et al., Citation2021). However, predicted responses correctly follow within the experimental range given by the mean value of the tests plus or minus their standard deviation, namely and
m/s2 in case of 0.25 and 0.50 ped/m2, respectively.
9. Conclusions
This paper aims to offer a simplified model for predicting vertical responses of footbridges under crowd excitation, by multiplying the response due to a single pedestrian by a factor that simulates the effects of the crowd. Such enhancement is managed by two analytical improved multiplication factors, modelled to reflect the average behaviour and 95th percentile observed in nearly 3 million highly detailed simulations. The latter cover a wide range of traffic conditions and take heed of both inter-subject and step-by-step variability in pedestrian forcing. The HHI phenomenon is addressed as well, adopting the SFM to reproduce crowd flows made of diverse and interacting pedestrians. Moreover, the model also foresees the possibility to account for the HSI impact on the structure dynamic properties, implementing the modal parameters of the crowd-structure coupled system instead of those associated with the empty (i.e. unoccupied) footbridge.
The application of the proposed model for footbridge vibration assessment entails defining a representative single pedestrian with pace properties consistent with the crowd density being represented. Therefore, the acceleration imparted by this single pedestrian on a virtual footbridge is computed and amplified by an improved multiplication factor, aiming to replicate either the average or 95th percentile of crowd-induced accelerations. The mean improved multiplication factor is described by bell-shaped functions placed at a crowd-dependent pacing frequency and integer multiples, whereas the 95th percentile improved multiplication factor is modelled as a function of the average one. Analytical models of the improved multiplication factor allow for a simple estimation of mean and 95th percentile maximum crowd-induced accelerations in the vertical direction. Results are compared to current codes of practice (BSI, Citation2008; HIVOSS, Citation2008; ISO 10137, Citation2007; SETRA, Citation2006), generally based on prudential but overconservative assumptions. Furthermore, a comparison against experimental tests (Van Nimmen et al., Citation2021) is also foreseen.
In conclusion, the method enables to forecast crowd-induced vertical accelerations (both average and 95th percentile) by simulating the response of a virtual single pedestrian and applying the improved multiplication factor proposed and calibrated in this paper. This is regarded as a great achievement, since crowd modelling is known to be rather challenging and, above all, time-consuming. Clearly, similar to the existing guidelines, the method incorporates simplifications, such as assuming unidirectional pedestrian flows and not addressing the HSI effect on pedestrian movements due to structural vibrations. However, the management of HHI irrespective of the crowd density contributes valuable insights to the current literature for vibration assessment. A wide spectrum of traffic levels is covered, noteworthy feature as for certain natural frequencies a reduced crowd density might be much more adverse than a higher one. Moreover, the model is also broadly applicable to a great variety of footbridge parameters, including deck geometry, number of spans, natural frequency, damping ratio, modal mass, and mode shape. Furthermore, the method allows for the combination of the acceleration contributions of diverse bending modes (using, for instance, the SRSS). The method ease of use and immediate applicability, combined with its high enforceability, positions it as a potentially suitable tool for assessing the serviceability limit state of vertical vibrations.
Acknowledgments
The KU Leuven Structural Mechanics Section is gratefully acknowledged for publicly sharing experimental data.
Disclosure statement
No potential conflict of interest is reported by the authors.
Data availability statement
The MATLAB code designed to predict the crowd-induced maximum acceleration is available on reasonable request to the corresponding author.
References
- Bachmann, H., & Ammann, W. (1987). Vibrations in structures: Induced by man and machines. Zürich: International Association for Bridge and Structural Engineering (IABSE).
- Bassoli, E., & Vincenzi, L. (2021). Parameter calibration of a social force model for the crowd-induced vibrations of footbridges. Frontiers in Built Environment, 7, 656799. doi:10.3389/fbuil.2021.656799
- Bassoli, E., Gambarelli, P., & Vincenzi, L. (2018). Human-induced vibrations of a curved cable-stayed footbridge. Journal of Constructional Steel Research, 146, 84–96. doi:10.1016/j.jcsr.2018.02.001
- Bassoli, E., Van Nimmen, K., Vincenzi, L., & Van den Broeck, P. (2018). A spectral load model for pedestrian excitation including vertical human-structure interaction. Engineering Structures, 156, 537–547. doi:10.1016/j.engstruct.2017.11.050
- Bertram, J. E. A., & Ruina, A. (2001). Multiple walking speed–frequency relations are predicted by constrained optimization. Journal of Theoretical Biology, 209(4), 445–453. doi:10.1006/jtbi.2001.2279
- Bocian, M., Brownjohn, J. M. W., Racic, V., Hester, D., Quattrone, A., Gilbert, L., & Beasley, R. (2018). Time-dependent spectral analysis of interactions within groups of walking pedestrians and vertical structural motion using wavelets. Mechanical Systems and Signal Processing, 105, 502–523. doi:10.1016/j.ymssp.2017.12.020
- Bruno, L., & Corbetta, A. (2017). Uncertainties in crowd dynamic loading of footbridges: A novel multi-scale model of pedestrian traffic. Engineering Structures, 147, 545–566. doi:10.1016/j.engstruct.2017.05.066
- Bruno, L., & Venuti, F. (2008). The pedestrian speed-density relation: Modelling and application. In Proceedings of the 3rd International Conference on Footbridges (pp. 255–256).
- BSI (2008). UK national annex to eurocode 1: Actions on structures - Part 2: Traffic loads on bridges. NA to BS EN 1991-2:2003. London, UK: British Standards Institution.
- Buchmüller, S., & Weidmann, U. (2006). Parameters of pedestrians, pedestrian traffic and walking facilities (Tech. Rep.). Zürich: Institut für Verkehrsplanung und Transportsysteme (IVT).
- Butz, C., Feldmann, M., Heinemeyer, C., Sedlacek, G., Chabrolin, B., Lemaire, A., … Schlaich, M. (2008). Advanced load models for synchronous pedestrian excitation and optimised design guidelines for steel footbridges (SYNPEX) (Tech. Rep.). Luxembourg: European Commission Research Fund for Coal and Steel.
- Caprani, C. C., Keogh, J., Archbold, P., & Fanning, P. (2012). Enhancement factors for the vertical response of footbridges subjected to stochastic crowd loading. Computers & Structures, 102-103, 87–96. doi:10.1016/j.compstruc.2012.03.006
- Chen, X., Treiber, M., Kanagaraj, V., & Li, H. (2017). Social force models for pedestrian traffic – state of the art. Transport Reviews, 38(5), 625–653. doi:10.1080/01441647.2017.1396265
- Cunha, Á., Caetano, E., Magalhães, F., & Moutinho, C. (2017). Dynamic identification and continuous dynamic monitoring of bridges: Different applications along bridges life cycle. Structure and Infrastructure Engineering, 14(4), 445–467. doi:10.1080/15732479.2017.1406959
- da Silva, F. T., Brito, H. M. B. F., & Pimentel, R. L. (2013). Modeling of crowd load in vertical direction using biodynamic model for pedestrians crossing footbridges. Canadian Journal of Civil Engineering, 40(12), 1196–1204. doi:10.1139/cjce-2011-0587
- Dey, P., Sychterz, A., Narasimhan, S., & Walbridge, S. (2016). Performance of pedestrian-load models through experimental studies on lightweight aluminum bridges. Journal of Bridge Engineering, 21(8), C4015005. doi:10.1061/(ASCE)BE.1943-5592.0000824
- Fanning, P. J., Healy, P., & Pavic, A. (2010). Pedestrian bridge vibration serviceability: A case study in testing and simulation. Advances in Structural Engineering, 13(5), 861–873. doi:10.1260/1369-4332.13.5.861
- Fujino, Y., Pacheco, B. M., Nakamura, S. I., & Warnitchai, P. (1993). Synchronization of human walking observed during lateral vibration of a congested pedestrian bridge. Earthquake Engineering & Structural Dynamics, 22(9), 741–758. doi:10.1002/eqe.4290220902
- Georgakis, C., & Ingólfsson, E. T. (2008). Vertical footbridge vibrations: The response spectrum methodology. In Proceedings of the 3rd International Conference on Footbridges (pp. 267–275).
- Grundmann, H., Kreuzinger, H., & Schneider, M. (1993). Dynamic calculations of footbridges. Bauingenieur, 68(5), 215–225.
- Helbing, D., & Molnár, P. (1995). Social force model for pedestrian dynamics. Physical Review. E, Statistical Physics, Plasmas, Fluids, and Related Interdisciplinary Topics, 51(5), 4282–4286. doi:10.1103/physreve.51.4282
- Helbing, D., Buzna, L., Johansson, A., & Werner, T. (2005). Self-organized pedestrian crowd dynamics: Experiments, simulations, and design solutions. Transportation Science, 39(1), 1–24. doi:10.1287/trsc.1040.0108
- HIVOSS (2008). Design of footbridges - Guideline. Human induced vibrations of steel structures. Luxembourg: European Research program RFCS - Research Fund for Coal and Steel.
- Ingólfsson, E. T. (2011). Pedestrian-induced lateral vibrations of footbridges: Experimental studies and probabilistic modelling [Doctoral dissertation]. Technical University of Denmark.
- ISO 10137 (2007). Bases for design of structures - Serviceability of buildings and walkways against vibrations. Geneva: International Organization for Standardization.
- Jiménez-Alonso, J. F., Sáez, A., Caetano, E., & Magalhães, F. (2016). Vertical crowd–structure interaction model to analyze the change of the modal properties of a footbridge. Journal of Bridge Engineering, 21(8), C4015004. doi:10.1061/(ASCE)BE.1943-5592.0000828
- Johansson, A., Helbing, D., & Shukla, P. K. (2007). Specification of a microscopic pedestrian model by evolutionary adjustment to video tracking data. Advances in Complex Systems, 10(supp02), 271–288. doi:10.1142/S0219525907001355
- Kladek, H. (1966). Über die Geschwindigkeitscharakteristik auf Stadtstraßenabschnitten (Doctoral dissertation). Hochschule für Verkehrswesen, Friedrich List, Dresden, Germany. (in German).
- Li, Q., Fan, J., Nie, J., Li, Q., & Chen, Y. (2010). Crowd-induced random vibration of footbridge and vibration control using multiple tuned mass dampers. Journal of Sound and Vibration, 329(19), 4068–4092. doi:10.1016/j.jsv.2010.04.013
- Li, Y., Zhang, X., Wang, C., Zhang, Y., & Wei, X. (2023). Human-induced vertical vibration of a glass suspension footbridge: Experimental study and numerical analysis. Structure and Infrastructure Engineering, 1–19. doi:10.1080/15732479.2023.2230567
- Liu, H., Shah, S., & Jiang, W. (2004). On-line outlier detection and data cleaning. Computers & Chemical Engineering, 28(9), 1635–1647. doi:10.1016/j.compchemeng.2004.01.009
- Matsumoto, Y., Nishioka, T., Shiojiri, H., & Matsuzaki, K. (1978). Dynamic design of footbridges. IABSE Proceedings, P-17(78), 1–15.
- Pancaldi, F., Bassoli, E., Milani, M., & Vincenzi, L. (2021). A statistical approach for modeling individual vertical walking forces. Applied Sciences, 11(21), 10207. doi:10.3390/app112110207
- Piccardo, G., & Tubino, F. (2009). Simplified procedures for vibration serviceability analysis of footbridges subjected to realistic walking loads. Computers & Structures, 87(13-14), 890–903. doi:10.1016/j.compstruc.2009.04.006
- Piccardo, G., & Tubino, F. (2012). Equivalent spectral model and maximum dynamic response for the serviceability analysis of footbridges. Engineering Structures, 40, 445–456. doi:10.1016/j.engstruct.2012.03.005
- Portier, K., Keith Tolson, J., & Roberts, S. M. (2007). Body weight distributions for risk assessment. Risk Analysis: An Official Publication of the Society for Risk Analysis, 27(1), 11–26. doi:10.1111/j.1539-6924.2006.00856.x
- Racic, V., & Brownjohn, J. M. W. (2011). Stochastic model of near-periodic vertical loads due to humans walking. Advanced Engineering Informatics, 25(2), 259–275. doi:10.1016/j.aei.2010.07.004
- Sanhaci, C., & Kasperski, M. (2005). Random loads induced by walking. In Proceedings of the 6th European Conference on Structural Dynamics (pp. 441–446). Paris, France.
- SETRA (2006). Footbridges - Assessment of vibrational behaviour of footbridges under pedestrian loading. Paris: Technical Department for Transport, Roads and Bridges Engineering and Road Safety, Ministry of Transport and Infrastructure.
- Shahabpoor, E., Pavic, A., & Racic, V. (2017). Structural vibration serviceability: New design framework featuring human-structure interaction. Engineering Structures, 136, 295–311. doi:10.1016/j.engstruct.2017.01.030
- Tubino, F., & Piccardo, G. (2016). Serviceability assessment of footbridges in unrestricted pedestrian traffic conditions. Structure and Infrastructure Engineering, 12(12), 1650–1660. doi:10.1080/15732479.2016.1157610
- Tubino, F., Carassale, L., & Piccardo, G. (2016). Human-induced vibrations on two lively footbridges in Milan. Journal of Bridge Engineering, 21(8), C4015002. doi:10.1061/(ASCE)BE.1943-5592.0000816
- Tubino, F., Pagnini, L., & Piccardo, G. (2020). Uncertainty propagation in the serviceability assessment of footbridges. Structure and Infrastructure Engineering, 16(1), 123–137. doi:10.1080/15732479.2019.1618879
- Van Hauwermeiren, J., Van Nimmen, K., Van den Broeck, P., & Vergauwen, M. (2020). Vision-based methodology for characterizing the flow of a high-density crowd on footbridges: Strategy and application. Infrastructures, 5(6), 51. doi:10.3390/infrastructures5060051
- Van Nimmen, K., Lombaert, G., De Roeck, G., & Van den Broeck, P. (2014). Vibration serviceability of footbridges: Evaluation of the current codes of practice. Engineering Structures, 59, 448–461. doi:10.1016/j.engstruct.2013.11.006
- Van Nimmen, K., Lombaert, G., Jonkers, I., De Roeck, G., & Van den Broeck, P. (2014). Characterisation of walking loads by 3d inertial motion tracking. Journal of Sound and Vibration, 333(20), 5212–5226. doi:10.1016/j.jsv.2014.05.022
- Van Nimmen, K., Van den Broeck, P., Verbeke, P., Schauvliege, C., Mallié, M., Ney, L., & De Roeck, G. (2017). Numerical and experimental analysis of the vibration serviceability of the Bears’ Cage footbridge. Structure and Infrastructure Engineering, 13(3), 390–400. doi:10.1080/15732479.2016.1160133
- Van Nimmen, K., Van Hauwermeiren, J., & Van den Broeck, P. (2021). Eeklo footbridge: Benchmark dataset on pedestrian-induced vibrations. Journal of Bridge Engineering, 26(7). doi:10.1061/(ASCE)BE.1943-5592.0001707
- Van Nimmen, K., Zhao, G., Seyfarth, A., & Van den Broeck, P. (2018). A robust methodology for the reconstruction of the vertical pedestrian-induced load from the registered body motion. Vibration, 1(2), 250–268. doi:10.3390/vibration1020018
- Venuti, F., & Tubino, F. (2021). Human-induced loading and dynamic response of footbridges in the vertical direction due to restricted pedestrian traffic. Structure and Infrastructure Engineering, 17(10), 1431–1445. doi:10.1080/15732479.2021.1897630
- Venuti, F., Racic, V., & Corbetta, A. (2016). Modelling framework for dynamic interaction between multiple pedestrians and vertical vibrations of footbridges. Journal of Sound and Vibration, 379, 245–263. doi:10.1016/j.jsv.2016.05.047
- Wei, X., Liu, J. C., & Bi, S. (2022). Uncertainty quantification and propagation of crowd behaviour effects on pedestrian-induced vibrations of footbridges. Mechanical Systems and Signal Processing, 167, 108557. doi:10.1016/j.ymssp.2021.108557
- Wei, X., Van Nimmen, K., De Roeck, G., & Van Der Broeck, P. (2021). A simplified method to account for human-human interaction in the prediction of pedestrian-induced vibrations. Structural Control and Health Monitoring, 28(7), e2753. doi:10.1002/stc.2753
- Weidmann, U. (1993). Transporttechnik der fußgänger: Transporttechnische eigenschaften des fußgängerverkehrs (literaturauswertung). IVT Schriftenreihe, 90, 1–84.
- Young, P. (2001). Improved floor vibration prediction methodologies. In Arup Vibration Seminar, 4.
- Zivanovic, M., & Pavic, A. (2011). Dynamic response of footbridges due to vertical load models of pedestrians. In Proceedings of the 8th International Conference on Structural Dynamics (pp. 1027–1034).
- Živanović, S. (2012). Benchmark footbridge for vibration serviceability assessment under the vertical component of pedestrian load. Journal of Structural Engineering, 138(10), 1193–1202. doi:10.1061/(ASCE)ST.1943-541X.0000571
- Živanović, S., Diaz, I., & Pavić, A. (2009). Influence of walking and standing crowds on structural dynamic properties. In Proceedings of the 27th Conference on Structural Dynamics (pp. 1973–1982).
- Živanović, S., Pavić, A., & Ingólfsson, E. T. (2010). Modeling spatially unrestricted pedestrian traffic on footbridges. Journal of Structural Engineering, 136(10), 1296–1308. doi:10.1061/(ASCE)ST.1943-541X.0000226
- Živanović, S., Pavić, A., & Reynolds, P. (2007). Probability-based prediction of multi-mode vibration response to walking excitation. Engineering Structures, 29(6), 942–954. doi:10.1016/j.engstruct.2006.07.004