
Abstract
Integral floating microscopy is proposed to capture the three-dimensional information of microscopic (micro) objects. In the proposed method, perspective images are directly obtained from a single shot image by placing a lens array in the conventional microscope. Compared to the conventional light field microscopy, the proposed method provides an increased lateral resolution. In this paper, the effective capturing area and the depth of field are analyzed to optimize the configuration and maximize the lateral resolution with the depth information of a micro object. After that, optical visualization using an integral floating display with large depth perception is conducted to verify the 3D information. In addition, a computational visualization method with a depth map and texture information is provided. Lastly, the experiment result validating the analysis result is presented.
1. Introduction
The acquisition of the three-dimensional (3D) information of a microscopic (micro) object using a microscope has been an important issue in various research fields of late [Citation1–15]. There have been numerous researches to obtain the 3D information of micro objects using tomographic microscopy [Citation2,Citation3], confocal microscopy [Citation4,Citation5], and the lens array pickup method [Citation6–9]. Among them, tomographic microscopy and confocal microscopy have the advantage of achieving high-resolution 3D information of micro objects [Citation2–5]. Such methods, however, require bulky systems, including mechanical movement with time cost [Citation2–5].
Light field microscopy (LFM) is one of the promising technologies for obtaining 3D information. It captures perspective view images through the lens array inserted in the conventional microscope [Citation6–9]. The specimen is located at the working distance of the objective lens, and the telecentric stop is located at the back focal plane of the objective lens, which blocks peripheral rays for the symmetric acquisition of light field information. By placing the micro lens array at the image plane of the objective lens, the directional elements of the light field of a specimen are recorded, as shown in . As mechanical movement is replaced with the lens array in the conventional microscope, LFM captures the directional information of a micro object in a single shot with the simple configuration. The lateral resolution is decreased, however, with the number of lenses in LFM, because the number of pixels of the charge-coupled device (CCD) needs to be allocated into both the angular and lateral information of the object [Citation6,Citation9].
The 3D information captured with LFM could be visualized optically and computationally. Especially, optical 3D reconstruction has been performed using a 3D display technology of integral imaging (InIm), which has several advantages, such as full and quasi-continuous parallax [Citation10–13]. As InIm also uses a lens array to provide 3D information, it is a suitable 3D display system for reconstructing the 3D information from LFM, among the various categories of 3D display technologies. The lens boundaries in the lens array, however, lead to visual disturbance for the observers due to the seam, and degrade the natural perception of the reconstructed 3D images in InIm. Meanwhile, the shape-from-stereo method is commonly used for computational reconstruction in LFM [Citation6]. The shape-from-stereo method calculates the disparity of each perspective view image and interpolates images to reconstruct 3D information. As the shape-from-stereo method is based on the texture of each perspective image in LFM, the lateral resolution of the reconstructed 3D image is also restricted to the poor lateral resolution of the perspective image.
In this paper, integral floating microscopy (IFM) is proposed, which adopts the principle of integral floating display (IFD) to LFM for a high lateral resolution. By placing the specimen in the front focal plane of the objective lens and placing the lens array in the back focal plane, the perspective view images are obtained directly, without any image processing. Due to the modified sampling relation between the angular and lateral resolutions, the lateral resolution of each perspective image is increased. In Section 2, the principles and optical properties of the DOF and the resolution of IFM are analyzed. In Section 3, two visualization methods of captured 3D information are presented: the optical and the computational reconstruction methods. With the improved high lateral resolution, the performance of 3D visualization is enhanced. Then, experimental verifications are conducted from capturing to visualizing 3D information.
2. Analysis of the properties of IFM
2.1. Principle of IFM
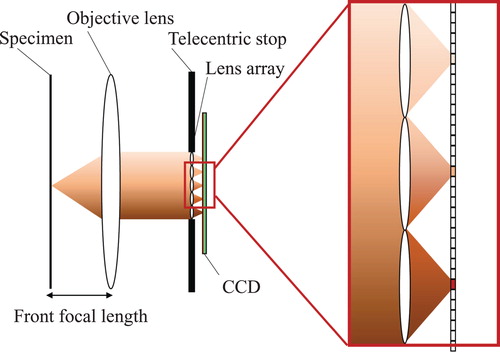
The specimen and the lens array are located at the front and back focal planes of the objective lens, respectively, as shown in . After the diverging rays from a point in the specimen become parallel rays through the objective lens, the parallel rays go into the lens array. The directional information of a point is converged into a single pixel of CCD located at the focal length of the lens array. Hence, each lens in the lens array covers the whole area of the sample within the FOV of the objective lens. The image obtained through IFM is a form of the perspective view images. The obtained perspective view images are similar to the multi-view display because the information of each point in the specimen is recorded into each pixel in the CCD [Citation11–13].
Figure 1. Schematic diagram of LFM.
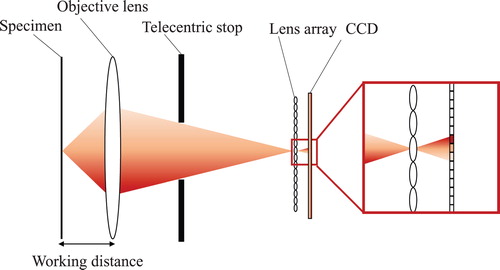
Figure 2. Schematic diagram of IFM.
The lateral and angular resolutions of IFM depend on the specifications of the objective lens, lens array, and CCD. The number of pixels per lens determines the lateral resolution of each perspective image or the resolution of the reconstructed 3D information because the pixels per lens cover the whole area within the FOV of the objective lens. Meanwhile, the different angular data go into the different lens in the form of parallel rays, so the angular resolution is related to the number of lenses in the lens array. In contrast, the sampling relation between the lateral and angular resolutions of LFM has a reverse relation to IFM. The lateral and angular resolutions in LFM are determined by the number of lenses in the lens array and the number of pixels per lens, respectively [Citation6,Citation9]. Thus, the essential component of the lateral resolution is the large number of pixels per lens for IFM and the large number of lenses for LFM. Considering the difficulties in fabricating a micro lens array with an extremely small pitch, it is easy to acquire 3D information with a higher lateral resolution in IFM compared to LFM.
2.2. Effective pixel and lens numbers in IFM
The effective lens and pixel numbers are restricted by the specifications of the objective and lens arrays, which is similar to the f-number mismatch issue in LFM [Citation6,Citation9].
First, the limited size of the telecentric stop and the FOV restrict the effective lens number. As mentioned earlier, the effective lens number determines the range of the angular sampling of the directional information of the specimen. shows the schematic diagram of the effective lens number. The blue and green points on the specimen represent the last points in the detectable area. Due to the telecentric stop of the objective lens, only the lenses in the overlapped area capture the whole FOV area. If the lens array is located outside the overlapped region, no lens could capture the blue and green information together. The distance between the overlapped region and the telecentric stop of the microscope, which is denoted as Ro, is presented as follows:
(1)
Figure 3. Schematic diagram of the effective lens number.
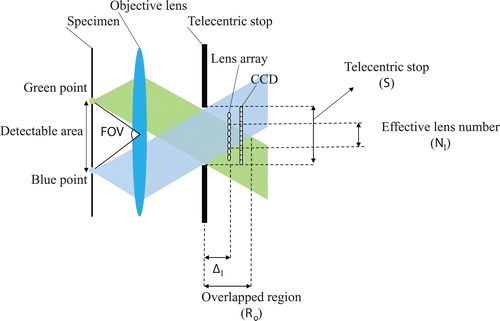
Figure 4. Schematic diagram of the effective pixel number.
where S means the size of the telecentric stop of the objective lens. As the lens array goes into the overlapped region, the number of lenses is increased, which could capture the blue and green information together. As shown in , the lens at the overlapped region determines the effective lens and the number of effective lenses (Nl) as follows:
(2)
where Δl is the distance between the lens array and the telecentric stop, lp is the lens pitch of the lens array, and
is the floor operator that returns the largest previous integer. The effective lens number (Nl) increases as Δl becomes smaller. As shown in Equation (2), the optimum position of the lens array (Δl) equals zero, which means the plane of the telecentric stop. As the telecentric stop is generally placed inside the barrel of the objective lens, however, the lens array should be placed on the plane closest to the telecentric stop in practice.
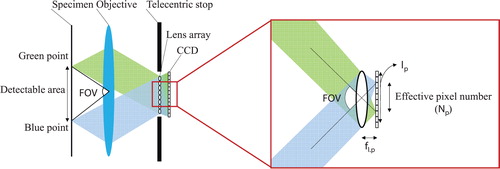
The number of pixels per lens related to the lateral resolution is determined not only by the lens pitch but also by the pixel pitch. Under the configuration illustrated in , the maximum pixel number (Np.max) is represented as Equation (3) when the pp indicates the pixel pitch of the CCD. It is assumed that the lens array is located at the plane of the telecentric stop.
(3)
As the FOVs of the objective lens and the lens array are different, however, all the pixels of the CCD corresponding to each lens could not be utilized. This is called a “mismatched FOV problem” in IFM, which is also a limitation in LFM [Citation6,Citation9]. When the FOV of the elemental lens is smaller than that of the objective lens, the information of the specimen within the FOV of the objective lens is fully obtained in spite of the reduction of the effective pixel number. Thus, a clear perspective image is achieved by image cropping. On the other hand, when the FOV of the elemental lens is larger than that of the objective lens, the overlapping in the information obtained within the FOV of the objective lens becomes a critical problem because the separation of overlapped data is a much more difficult process. Thus, only the case when the FOV of the elemental lens is smaller than that of the objective lens is described herein.
As shown in , the pixels between the blue and green pixels capture the information of the specimen. The number of pixels that record the information per lens is called “effective pixel number” and is described as
(4)
where fl.p is the focal length of the lens array. If the FOV of the objective lens and the lens array are matched (i.e.
), the effective pixel number (NP) has the maximum value of Equation (3).
2.3. Depth of field
DOF is a distance within which all the parts of the object are recorded with acceptably sharp images on the CCD [Citation6]. The region outside the DOF is captured with blurring. The DOF in IFM is defined as the distance where the blurring does not exceed one pixel of the CCD, as shown in Figure . In microscopes, as the perfectly focused light also has a spatial extent, both the wave and geometrical optics should be considered [Citation6]. In general, the DOF of the objective lens is represented as Equation (5) considering wave optics:
(5)
Figure 5. Schematic diagram of the DOF in IFM.
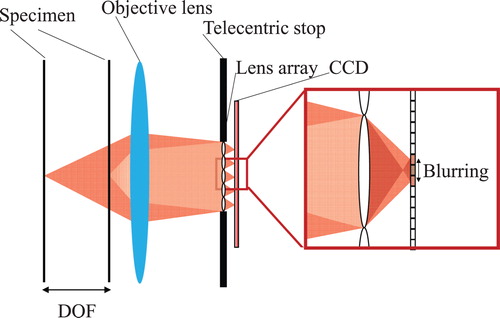
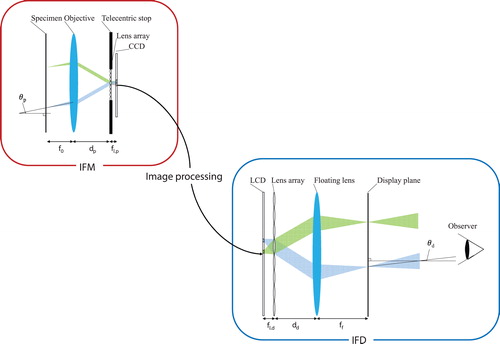
Figure 6. The whole process of the pickup and the display system using IFM and IFD.
3. Optical and computational 3D reconstruction
There are various conventional 3D display technologies in the optical reconstruction field, such as InIm and IFD [Citation9,Citation10,Citation12]. Among them, due to the similarity of the IFM and IFD configurations, IFD is the appropriate method for displaying 3D information captured using IFM, without heavy computational costs. Placing the large convex lens as a floating device in front of the lens array, IFD is a modified version of InIm, which provides large depth perception [Citation16–19]. Also, as each perspective view image corresponds to the area of one lens in the lens array, the boundary problem is alleviated, which degrades the quality of InIm in IFM [Citation19].
As the specifications of IFM and IFD are different, however, the specifications of IFD need to be adjusted. Based on the parameters of IFM, the distance between the floating lens and the lens array and the focal length of the floating lens should be designed to provide an angularly correct image. shows the overall process of visualizing the 3D information of IFM using IFD. In the said figure, fl.p is the focal length of the lens array, and dp is the distance between the objective lens and the lens array of IFM. In IFD, ld and fl.d are the lens pitch and focal length of the lens array, respectively. Also, ff is the focal length of the floating lens, and dd is the distance between the objective lens and the lens array. θp is the angle of the chief ray of each point in the specimen in IFM, and θd is the reconstructed angle in IFD. θp and θd should be matched to reconstruct a 3D image without distortion. As it is hard to fabricate a customized lens array, it is preferred that the focal length and the location of the floating lens become variables. The design parameters of the floating lens are determined as follows:
(7)
(8)
The first step is choosing the lens array of IFD. Then the focal length of the floating lens (fd) is decided by Equation (7). Lastly, the distance between the lens array and the floating lens (dd) is fixed by Equation (8). By following this process, the specifications of the display system are decided.
Estimating the 3D shape in computational reconstruction also has advantages, such as the ease of processing 3D information and of transferring it to other types of applications [Citation6,Citation20,Citation21]. The 3D information captured using IFM can also be computationally visualized. As mentioned earlier, there are several ways of visualizing 3D information in a virtual space, such as shape-from-stereo [Citation22] and shape-from-focus [Citation23]. Among these, in this paper, depth map extraction with optical flow, a shape-from-stereo method, is used to reconstruct 3D information virtually [Citation21]. The optical flow uses the relative motion between the different positions to calculate the disparity between the perspective information by comparing the captured perspective image with the center image [Citation21]. As IFM obtains perspective views with high lateral resolution, the optical flow algorithm, which is based on the texture information, could extract accurate disparity. From the extracted disparity map, the depth map of IFM could be extracted, which contains the texture and depth information.
4. Experiment results
shows the experiment setup of IFM. The lens array is inserted in the conventional microscope. The detailed specifications of the presented system are presented in .
Figure 7. Experiment setup of IFM.
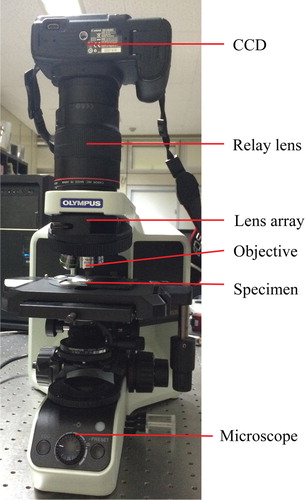
Table 1. Specifications of the demonstrated IFM system.
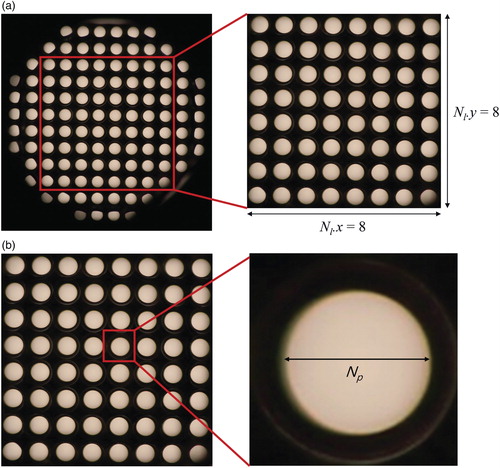
Figure 8. Experiment results for the effective number: (a) effective lens number and (b) effective pixel number.
The magnification factor of the objective lens is 4, and the effective focal length is 45 mm. A 1mm lens array whose focal length is 3.3 mm is used, and a Canon 5D Mark 2, whose pixel pitch is 6.4 µm, is used with the relay lens, whose focal length is 65 mm. A resolution target and aloe samples are used as the samples.
(a) shows the experiment results of the effective lens number. The diffuser is used to show the effective area clearly. The effective lens number shows not only the angular resolution of the system but also the location of the telecentric stop (Δl), which is hard to measure. The effective lens number (Nl) is 8, and the location of the telecentric stop could be estimated as 18.5 mm away from the lens array using Equation (2). The estimation of the location of the telecentric stop could be useful to the implementation of the relay optic system to place the lens array at the optimal position later. As discussed in Section 3, the different FOVs between the lens array and the objective lens raise the mismatched FOV problem. (b) shows the mismatched FOV problem and the effective pixel number. The illuminated area, which is obtained with the diffuser, is the effective area. The calculated effective pixel number is about 247 using Equation (3), and the average experiment value is 253. This proves the validity of the results of the analysis of the effective pixel number. As a result, the lateral resolution becomes 253 × 253 (∼50 k), which is larger than the lateral resolution of the conventional LFM [Citation6].
As defined in Section 2.3, the DOF is about 286 µm when the pixel pitch is 2.63 μm. shows the captured image according to the change in the depth of the specimen. Δs is the depth difference of the specimen from the focused plane. Each image is recorded at Δs of 0 and 1.5 mm, respectively. (a) represents the clear image within the DOF. The graph shows the intensity along the blue line in the captured images. In (b), as the location of the specimen is outside the DOF, the pattern of the resolution target is blurred, and the variation of the graph is diminished.
Figure 9. Experiment results for the DOF: (a) Δs = 0 mm and (b) Δs = 1.5 mm.
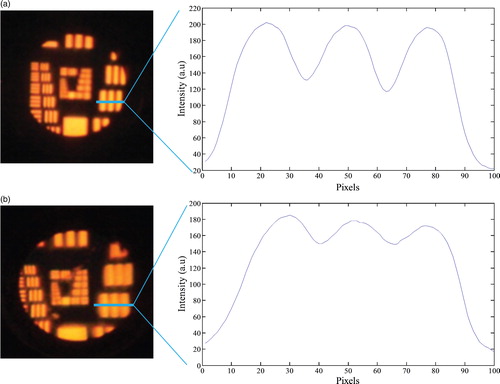
Figure 10. Captured information of a microscopic specimen using IFM (aloe).
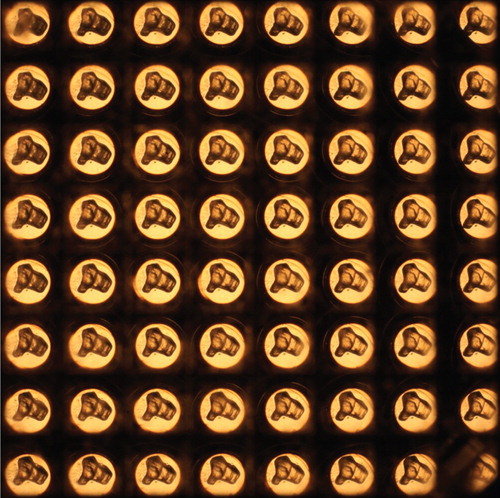
After verifying the basic analysis results of IFM, the 3D information of the biological specimen is captured. A transparent aloe sample with a lateral size of about 2 mm is used, and the 3D information is captured as shown in . As it is located at the front focal plane of the objective lens, the captured image looks similar to the orthographic images. shows the different parallax images according to different positions. Each perspective view of the whole specimen in the FOV of the objective lens is captured in each lens in the lens array.
The obtained 3D information could also be reconstructed using IFD, as shown in . A high-resolution display panel with QXGA (2048 × 1536) is used for displaying 3D information captured from IFM. Via a lens array and a floating lens, 3D information could be reconstructed. Two variables, ff and dd, are designed to determine the specifications of IFD to reconstruct the information of IFM. ff is determined to be 450 mm, and dd is determined to be 293 mm, using Equations (7) and (8). The detailed specifications of the display experiments are shown in . The results of IFD with the captured image from IFM are shown in . The left image set consists of the captured perspective images from IFM while the right image set consists of the images optically reconstructed with IFD. As a perspective view of each lens in the lens array is observed at a viewpoint, the boundary problem of InIm is alleviated, and clear images are observed, as expected. The lateral resolution of the reconstruction is restricted, however, by the resolution of the display panel in IFD. This is why the pixelation structure is shown in the result.
shows the computational reconstruction of IFM. The depth map is extracted from the captured 3D information using the optical flow algorithm [Citation21]. In (a), the bright region represents the high altitude of the specimen, and the black area represents the low altitude. In the computational process, it is assumed that the area outside the effective area has zero altitude. The texture of the specimen is mapped onto the extracted depth map with a different viewing angle, as shown in (b) and (c), where when Az is 150°, El is 60°, and when Az is 75°, El is 60°. Az and El are the azimuthal and elevation angles, respectively. The azimuthal angle represents the rotation along the depth axis, and the elevation angle represents the angle between the x–y plane and the observer.
5. Conclusion
Here, IFM, a method of capturing 3D information, is proposed. By placing the lens array at the back focal plane of the objective lens, and the specimen at the front focal plane, 3D information with a high lateral resolution is obtained in a single shot. The effective number of lenses in the lens array and the effective number of pixels in the CCD, which are utilized as resources in practice, are analyzed. The effective lens number and the pixel number are decided by the location of the lens array and the FOV of the objective lens array. When the lens array is located at the back focal length, and when the FOVs between the lens array and the objective lens are matched, the maximum amount of 3D information is achieved. Also, numerical analysis of the DOF is performed. The DOF of IFM is much larger than that of LFM and of the conventional microscopy.
To verify the validity of the captured 3D information, the design method of the optical 3D reconstruction using an IFD is proposed. To match the angular component of the light fields of IFM and IFD, the location and the focal length of the floating lens are determined. Additionally, besides depth map extraction, computational reconstruction is also performed. The experiment results using the resolution target and the biological samples verify the analysis results obtained in this paper and confirm the feasibility of the system. Optical reconstruction using IFD with a high-resolution display panel is performed, and computational reconstruction using the optical flow method validates the captured 3D information of IFM.
Figure 11. Experiment setup of IFD for displaying the captured 3D information with IFM.
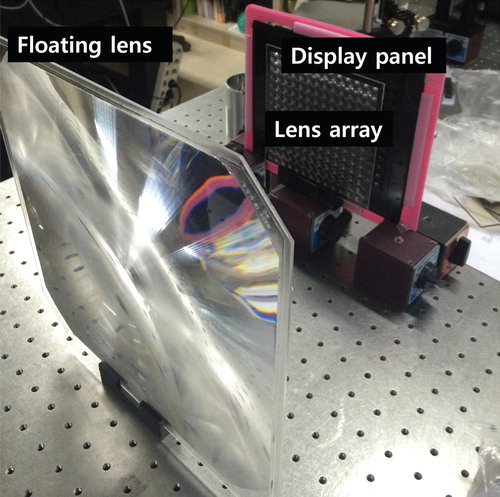
Figure 12. 3D information reconstructed with IFD.
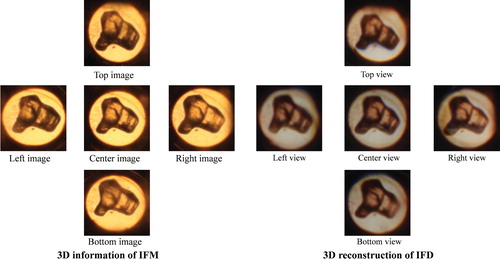
Figure 13. Depth map extraction with captured 3D information: (a) extracted depth map; (b) depth map with texture mapping (Az = 150°, El = 60°); and (c) depth map with texture mapping (Az = −75°, El = 60°).
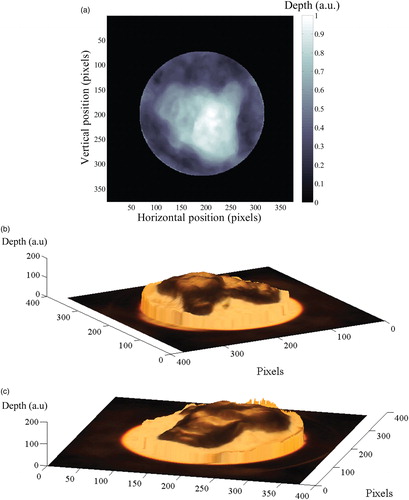
Table 2. Specification of reconstruction using IFD.
Funding
This research was supported by The Cross-Ministry Giga KOREA Project of the Ministry of Science, ICT, and Future Planning, South Korea [GK14D0200, Development of a Super-Multiview (SMV) Display Providing Real-Time Interaction].
Additional information
Jong-Young Hong received his BS degree in Electrical and Computer Engineering from Seoul National University, South Korea, in 2013. He is currently working toward a Ph.D. degree at the School of Electrical Engineering of the same university. His research focuses on 3D displays, holography, and light field microscopy.
Jiwoon Yeom received his BS degree in Electrical Engineering from Seoul National University, South Korea, in 2010, and is currently pursuing a Ph.D. degree at the same university. His current research interests are 3D displays and image processing, especially integral imaging and holography.
Jonghyun Kim received his BS degree in Electrical Engineering from Seoul National University, South Korea, in 2011. He is currently working toward a Ph.D. degree at the School of Electrical Engineering of the same university. His current research interests are 3D displays, 3D imaging, light field microscopy, real-time 3D visualization systems, and frontal-projection-type 3D displays.
Soon-gi Park received his BS and MS degrees in Information Display from Kyung Hee University in 2009 and 2011, respectively. He is currently pursuing a Ph.D. in Electrical Engineering from Seoul National University. His research interest is 3D displays, including integral imaging, depth-fused displays, and multi-projection displays.
Youngmo Jeong received his BS degree in Electrical and Computer Engineering from Seoul National University, South Korea, in 2013. He is currently a Ph.D. candidate in Electrical Engineering at the same university. His primary research interests are in the areas of 3D displays, optical information processing, and light field cameras.
Byoungho Lee received his Ph.D. from the Department of Electrical Engineering and Computer Science of the University of California at Berkeley in 1993. He has been in the faculty of the School of Electrical Engineering of Seoul National University since September 1994. Professor Lee is a Fellow of IEEE, Optical Society of America (OSA) and SPIE, and a Member of the Korean Academy of Science and Technology. He served as a director-at-large of OSA, chair of the Member and Education Services Council of OSA, and chair of the Holography and Diffractive Optics Technical Group of OSA. Currently, he is on the editorial board of Optics Letters, Light: Science and Applications, and Journal of the Society for Information Display. He has served on the editorial board of Applied Optics and Japanese Journal of Applied Physics and has been editor-in-chief of the Journal of the Optical Society of Korea. He has received several distinguished awards, such as the Scientist of the Month Award of Korea (September 2009), the Academic Award of the Optical Society of Korea (2006), and the Academic Award of Seoul National University (2013). He is currently the vice president of both the Korean Information Display Society and the Optical Society of Korea.
References
- J. Mertz, Introduction to Optical Microscopy (Roberts, Colorado, 2010).
- J. Sharpe, U. Ahlgren, P. Prerry, B. Hill, A. Ross, J. Hecksher-Sørensen, and D. Davidson, Science 296, 541 (2002). doi: 10.1126/science.1068206
- J.K. Udupa, Proc. IEEE 71, 420 (1983). doi: 10.1109/PROC.1983.12599
- T. Wilson, Confocal microscopy (Academic Press, London, 1990).
- J. Pawley, Handbook of Biological Confocal Microscopy (Springer, New York, 2010).
- M. Levoy, R. Ng, A. Adams, M. Footer, and M. Horowitz, ACM Trans. Graph. 25, 924 (2006). doi: 10.1145/1141911.1141976
- Y.-T. Lim, J.-H. Park, K.-C. Kwon, and N. Kim, Opt. Express 17, 19253 (2009). doi: 10.1364/OE.17.019253
- M. Levoy, IEEE Comput. Graph. Appl. Mag. 39, 46 (2006). doi: 10.1109/MC.2006.270
- J. Kim, J.-H. Jung, Y. Jeong, K. Hong, and B. Lee, Opt. Express 22, 10210 (2014). doi: 10.1364/OE.22.010210
- G. Lippmann, J. Phys. Theor. Appl. 7, 821 (1908). doi: 10.1051/jphystap:019080070082100
- J. Hong, Y. Kim, H.-J. Choi, J. Hahn, J.-H. Park, H. Kim, S.-W. Min, N. Chen, and B. Lee, Appl. Opt. 50, H87 (2011). doi: 10.1364/AO.50.000H87
- J. Kim, J.-H. Jung, C. Jang, and B. Lee, Opt. Express 21, 18742 (2013). doi: 10.1364/OE.21.018742
- S.-g. Park, J. Yeom, Y. Jeong, N. Chen, J.-Y. Hong, and B. Lee, J. Inf. Disp. 15, 37 (2014). doi: 10.1080/15980316.2013.867906
- A. Stern and B. Javidi, Opt. Eng. 94, 591 (2006).
- C. Fehn, Proc. SPIE 5291, 93 (2004).
- S.-W. Min, M. Hahn, J. Kim, and B. Lee, Opt. Express 13, 4358 (2005). doi: 10.1364/OPEX.13.004358
- J. Kim, S.-W. Min, Y. Kim, and B. Lee, Appl. Opt. 47, D80 (2008). doi: 10.1364/AO.47.000D80
- H. Kakeya, Proc. SPIE 6803, 680317 (2008).
- J. Kim, G. Park, Y. Kim, S.-W. Min, and B. Lee, Appl. Opt. 48, H176 (2009). doi: 10.1364/AO.48.00H176
- J.-H. Park, S. Jung, H. Choi, Y. Kim, and B. Lee, Appl. Opt. 43, 4882 (2004). doi: 10.1364/AO.43.004882
- J.-H. Jung, K. Hong, G. Park, I. Chung, J.-H. Park, and B. Lee, Opt. Express 18, 26373 (2010). doi: 10.1364/OE.18.026373
- Y. Schechner and N. Kiryati, Int. J. Comput. Vision 39, 141 (2000). doi: 10.1023/A:1008175127327
- S.K. Nayar and Y. Nakagawa, Proc. Int. Conf. Robot. Autom. 2, 218 (1990).