
ABSTRACT
This paper presents an examination of the control of optical quenching according to the junction temperature of a high-brightness laser. A high-brightness blue laser source is being reviewed for head-up display). The laser is problematic, however, because its luminous efficiency, and hence its lifetime, is reduced due to its low laser junction temperature, and particularly due to its blue optical quenching, which is a disadvantageous characteristic. This problem was addressed by applying a current supply method with a high-frequency pulse width modulation (PWM) scheme and a digital micro-mirror device panel based on a method using a color wheel that uses yellow phosphor material. PWM of the frequency and analysis and optimization of the duty ratio enabled the prevention of the optical quenching of the blue laser to obtain high optical efficiency.
I. Introduction
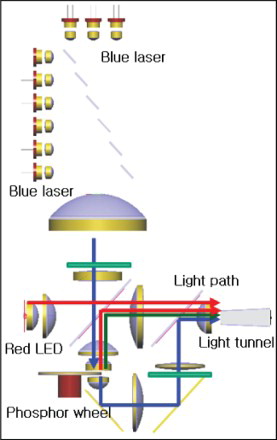
The methods that can be used to enhance the image color so that it exceeds 24 bits in the projection system structure of head-up displays (HUDs) that use a digital micro-mirror device (DMD) panel are based on the use of different light sources, including light-emitting diodes (LEDs), blue laser, phosphor, and a halogen lamp [Citation1]. These methods are divided into two types: a time-sharing method that generates primary colors, including blue, red, and green, by employing a rotating color filter, a color wheel, and a color drum at 120 or 240 Hz using a monochromatic light source; and a method that exhibits colors through a pulse width modulation (PWM) drive by using three types of LED light sources, including high-brightness blue, red, and green. In cases in which blue, red, and green are exhibited using a color wheel, an optical relay lens and total internal reflection prime are used to transmit the 24-bit color data to the DMD panel through the color filter deposited on the color wheel and the optical path of blue, red, and green [Citation2]. As shown in , the light emitted by the monochromatic light source generates 24-bit colors of blue, red, and green through the color wheel that rotates at a constant frequency and an optical lens. At this time, the display brightness of the HUD, the light output efficiency, and the lifetime are determined by the efficiency of the driving circuit of the light source and the construction of both the color synthesizing system of the illuminating optical system and the radiant heat system [Citation3].
Figure 1. Optical configuration with laser and a DMD panel.
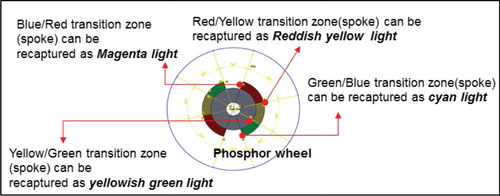
As shown in , the boundary section between two color filters of the color wheel is defined as the color transition section, and in this section, a one-dimensional (1D) color is synthesized by other colors, including yellow, dark red, and cyan. The purity of the colors synthesized by the color transition section generates a difference depending on the size of the transition section between two color filters, and causes a reduction in the brightness. Moreover, as this color transition section causes the 1D color to become polluted, a high-brightness blue laser, whose spot size is small enough to allow color transition time reduction, is used as a light source [Citation4]. In particular, the combination of an indium gallium nitride (InGaN) phosphor and a metal color wheel creates a virtual display that forms a high-power light source [Citation5].
Figure 2. Spoke time (color transition zone) and phosphor wheel using laser.
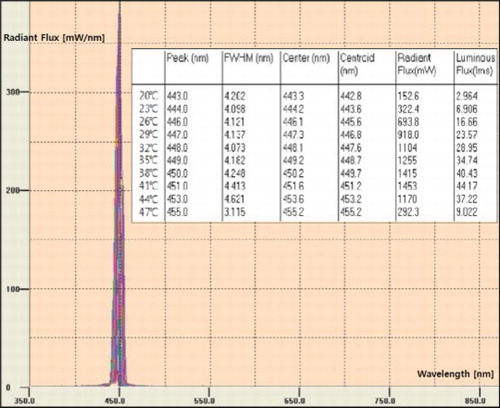
Although a high-brightness blue laser with a 435–455 nm wavelength range is highly efficient in terms of light output [Citation6], it has a disadvantage in that the light output decreases as the temperature of the laser stem increases. In other words, as shown in , the temperature of the laser stem (junction or case temperature) increases as a function of the current. As shown in Figure , the laser generates light at a variety of pure wavelengths as determined by the laser diode, leading to a drastic reduction in the laser lifetime at stem temperatures above 40°C [Citation7–9]. This temperature characteristic of the wavelength appears to be the cause of the change in the image color of a virtual display that uses a DMD panel. That is, the color transition of the light source causes the color reproduction range (color gamut) to become unstable.
Figure 3. Case temperature according to the threshold current of laser.
Figure 4. Color quenching of the blue laser according to the stem temperature.
An increase in the brightness of the virtual display will therefore require the suppression of the optical quenching resulting from the temperature increase that decreases the light efficiency of the blue laser. In this respect, Section 2 describes a driving circuit for increasing the light efficiency of the light source, and Section 3 describes the driving waveform and presents the experiment results and effect. Lastly, Section 4 presents the conclusion of the paper.
2. Laser junction temperature and light source driving circuit
The wavelength range of a blue LED is 400–500 nm (on average, 446 nm), which is a comparatively wide range. As blue laser is characterized by a very narrow wavelength range of 440–455 nm, it is considered a light source with higher light efficiency than LED [Citation10]. In other words, the optical efficiency of an illumination system is characterized by a small Etendue value [Citation11,Citation12]. As the temperature characteristics of a laser are more sensitive than those of LED, however, the threshold voltage of laser in accordance with an increase in temperature increases by approximately 1.5% per 1°C. In accordance with this temperature increase, the central wavelength of the laser diode shifts by 0.3 nm for every 1°C increase in the stem temperature. This change in the laser stem temperature was minimized by configuring the driving and control circuitry as shown in Figure .
Figure 5. Current driving schematic of the laser module.
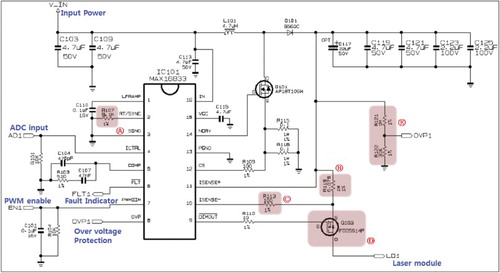
The driving voltage required when six lasers with a forward current of 1.2 A (and a forward voltage of 3.7 V) are connected in series is 18 V. The drive efficiency was increased by building a system with 24 V input power through boost approach application. The PWM drive signal is outputted from the digital light processing (DLP) system, and the analog value, which was transformed by applying a low-pass filter to the PWM output section, was used as the input for the ICTRL unit, which plays the role of an analog-to-digital converter allowing the control of the output current of the laser.
The drive switching frequency was determined from the resistor connected to the schematic pin RT/SYNC (indicated by (A) in ). The switching frequency was calculated using the internal resistance (7.350 × 10⁹ Ω) and external resistance (9.1 kΩ), as in Equation (1), to obtain an 807.6 kHz switching frequency.
(1)
The generation of electromagnetic-wave radiation noise, which can occur at the drive switching frequency, was prevented by using a method of applying a spread spectrum, and this was achieved by outputting a low dithering frequency. The frequency was determined by externally connecting a 0.1 µF capacitor to the pin LFRAMP, and at this time, the frequency was calculated using the 50 µA external value and the 0.1 µF capacitor value. A 500 Hz lamp output frequency was used to eliminate the electromagnetic-radiation noise. A detection resistor connected to the schematic pin ISENSE+ was used to determine the maximum current value that was to be applied to the laser (indicated by (B) in ). The supplying current was calculated using Equation (2).
(2)
where, VICTRL has a 1.1 V value at 0 V, and the maximum current value supplied to the laser was specified to be up to 2.4 A. The value specified for the current was designed to accommodate the current in the inductor (FET) and the output current of the diode (2.5 A). The supplying current is controlled using a p-channel MOSFET (indicated by (D) in ). A 100 Ω resistor (indicated by (C) in ) connected to the pin ISENSE− was designed to protect the circuit when the laser is short-circuited under unusual circumstances.
The PWM waveform, which is inputted in the PWMDIM pin on the circuit diagram, receives an input from the DLP and generates each color by differentially outputting the laser to the color wheel, which is composed of four filters (blue, green, red, and yellow), by maintaining the PWM driving ratio. The pin NDRV was made to play the role of a switching driver that can output up to 3 A by connecting an n-channel MOSFET to the outside. The resistor connected to the pin CS was designed to prevent the fast turning off of the switching MOSFET from occurring abnormally. The laser is protected from abnormal behavior by adding a protection circuit to the driving chip. In particular, the protection circuit is designed for overvoltage protection (OVP) and as protection against laser short circuit. The overvoltage value was determined by the pin on the circuit diagram, the OVP value, and the resistance value, which are connected as shown in (E) in . PWM driving switching and the driving chip were designed for situations in which the differential voltage value that is inputted in the pin exceeds 1.23 V. In this case, the actual overvoltage value was calculated as being more than the value of the current supplied when six lasers are connected in series. The voltage applied to the 30 kΩ resistor in (E) in was determined to be 42 V by using Equation (3).
(3)
When 0.5 and 1 A were supplied, respectively, to the laser, high efficiency (96.5% and 94.8%, respectively) was gained. The efficiency was calculated as the ratio of the output power (output voltage × current output) to the input power (input voltage × input current), and as a result, 94.8% driving efficiency was obtained when an output current of 1 A (voltage: 26.4 V) was supplied by connecting the six lasers in series.
3. Driving waveform and experiment results
By connecting six high-brightness lasers to the driving circuit in series, the present study measured the brightness of the laser by changing the amount of current supplied by changing the PWM driving duty ratio. Thus, the PWM driving duty ratio of the current supplied to the lasers was changed to 10, 20, 30, ∼80, 90, and 100% (CW driving). The current supplied to the laser was experimented with by changing its value to 500, 1000, 1500, and 2000 mA. The stem temperature of the laser increased when the PWM driving duty ratio and the amount of current were increased. The experiment conditions were kept the same by applying a cooling fan to maintain the 30°C stem temperature at the time the brightness was measured. This experiment enabled the most efficient PWM driving duty ratio of the laser to be obtained.
The value measured for the laser was represented as the average value of the sample and the standard deviation, which indicates the mean value and the difference between the measured values and the mean value. The standard deviation (S) was calculated using Equation (4). The sample is expressed as X, the mean as /X, and the number of samples as n.
(4)
provides the values that were obtained by experimenting with the wavelength property of the laser, which was measured through an integrating sphere when a 500 mA current was supplied.
Table 1. Duty ratio and wavelength of blue laser.
The range specified by the difference between the two extreme values of the laser wavelength – that is, full width at half maximum (FWHM), which means half of the value – was expressed. The experiment was carried out using 10 different values of the PWM driving duty ratio. The junction temperature of the laser increased due to the current that was applied to the laser, and accordingly, the phenomenon of laser wavelength and color coordinate changes occurred. As shown in , the current applied to the laser and the increase in the light output value according to the PWM driving duty ratio were compared (the light output value represents the mean value, and the standard deviation was 2.1). The brightness of the laser increased due to the applied current, and the rate of increase varied as a function of the applied current and the PWM driving duty. When a 2000 mA current was applied, the brightness increase rate was saturated at a level exceeding 80% of the duty. When a 1500 mA current was applied, the brightness increase rate was sharply enhanced in the range of 60–80% of the PWM driving duty ratio, but it was confirmed not to have reached saturation. When a 1000 mA current was applied, the brightness increase rate was the highest in the range of 80–100% of the PWM driving duty ratio.
Figure 6. Radiant flux and duty ratio of PWM driving.
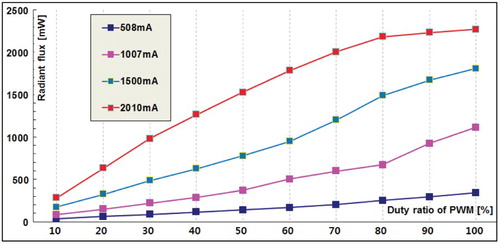
Similar to the measurement value, the brightness corresponding to a 50% duty ratio for the 2000 mA current was found to be higher than that at a 100% duty ratio for the 1000 mA current. Although the value of the applied current was the same overall, the difference in brightness doubled. As a result, the light efficiency and brightness significantly differed in accordance with the method that was used to apply current to the laser. This therefore has been determined to be the most important factor in the laser driving method as it determines the effect of the laser stem temperature.
The driving efficiency in accordance with the PWM current ratio applied to the laser is plotted in Figure . Based on the power supplied as input to the laser, the value of the light generated as output is presented by converting to efficiency (mean value; standard deviation: 0.0002). When the input current was 2010 mA and the driving duty was 30% (supply current: 603 mA = 2010 mA × 0.3), the light efficiency was found to be the highest. On the other hand, when the input current was 2010 mA and the driving duty was in the 80–100% range, the efficiency was found to be the worst. In other words, as the efficiency was low even if the input current was high, the heating increased; thus, the laser was shown to have had reduced optical output. This causes burning and shortens the life of the laser. It also increases the amount of noise [dB] because the wind speed of the cooling fan increases as the cooling system required for cooling becomes larger.
Figure 7. Optical relative efficiency and driving method of laser.
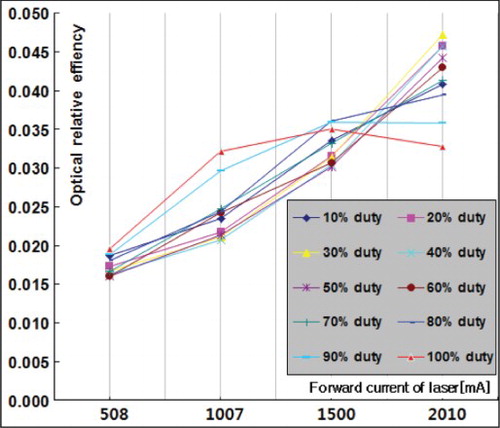
As shown by the measurement results, the efficiency at 20%, 30%, and 40% duty was 0.046, 0.047, and 0.046, respectively. Accordingly, the efficiency was higher than the efficiency at the duty ratios other than these. The efficiency was low overall, however, when a 500 mA current was applied, because the driving current was less than the rated applied current. When the applied current was above 2000 mA (e.g. 2570 mA), the light output of the laser decreased as the duty ratio increased, and as a result, burning damage occurred. As it exceeded the maximum permitted electric current of the laser, a problem occurred even if the driving duty was low. The efficiency corresponding to the driving duty of the laser was calculated using Equation (5). It is shown below by defining the ratio of the light output compared to the input power as the efficiency of the laser.
(5)
In terms of light efficiency, cooling efficiency, and power consumption reduction, the highest efficiency of the laser could be obtained when the PWM driving duty was operated within the 20–40% range. Moreover, the efficiency was found to be the highest when the current that was applied to the laser was between 1500 and 2000 mA. Efficiency analysis was done to determine the angle of each color that constitutes the color wheel of the DMD system, thereby gaining a wide range of colors and increasing the quality and brightness.
4. Conclusion
Theoretically, the application of a forward current can be expected to increase the efficiency of laser. In other words, the light output should increase in proportion to the current and the PWM duty. Due to the stem temperature properties of laser, however, the light output is not proportional to the amount of increase of the applied current. Due to this characteristic, the present study optimized the light output of the laser module by using a 2010 mA applied current and a 30% driving duty ratio.
As a virtual display, especially HUD, delivers information about the vehicle to the driver, the luminance and color characteristics of the laser are very important. As such, a laser with a high Etendue value was used as a light source, and the laser was optimized to improve its light efficiency and color characteristic. In addition to this study, additional research on whether the color of a person is determined by the external illumination, color capacity, and change in color will be conducted. The optimization method proposed in the paper can be extended to new markets as it can be applied not only to other vehicles but also to HUDs in the motorcycle sector.
Disclosure statement
No potential conflict of interest was reported by the author.
Additional information
Notes on contributors

Yongseok Chi
Yongseok Chi received his M.S. and Ph.D. degrees in electronics and electrical engineering from Dankook University in 2008 and 2014, respectively. He was a research engineer from 1998 to 2004: from 1998 to 2000 at Elevator Research Lab. in LG Industrial Company, and from 2000 to 2004 at PDP Research Lab. in Samsung SDI Co., Ltd. From 2004 to 2012, he was a chief research engineer at Materials and Devices Research Lab. in LG Electronics. He is currently an Assistant Professor at Dongseo University in South Korea. His research interests are in the areas of head-up displays, head-mounted displays, and pico-projector systems.
References
- S.C. Shin, Y.S. Chi, T.-J. Ahn, S.S. Jeong, S.-G. Lee and K.-Y. Choi, in Proceedings of SPIE 8167, Optical Design and Engineering IV, Marseille, France, September 2011, pp. 176–181.
- D.C. Hutchison, Texas Instruments Report, 2005, pp. 2–5.
- K. Li, LED array with recycling for high-power projector applications, SID International Symposium Digest of Technical Papers, 2011, pp. 323–325.
- M. Bass, in Handbook of Optics, Fundamentals, Techniques, and Design, vol. 1 (New York, 1995), pp. 7–44.
- M.H. Do, S.B. Kim, and S.K. Chung, Inst. Electron. Inf. Eng. 29 (12), 1171–1181 (1992).
- Y.S. Han, M.H. Do, S.B. Kim, and S.K. Chung, Inst. Electron. Inf. Eng. 31 (5), 579–583 (1994).
- K. Tai, R.J. Fischer, C.W. Seabury, N.A. Olsson, T.-C.D. Huo, Y. Ota and A.Y. Cho, Appl. Phys. Lett. 55, 2473–2475 (1989). doi: 10.1063/1.102002
- W. Nakwaski and M. Osinski, IEEE J. Quantum Electron. 27, 1391–1401 (1991). doi: 10.1109/3.89956
- T. Mizushima and H. Furuya, Laser projection display with low electric consumption and wide color gamut by using efficient green SHG laser and new illumination optics, SID Digest, 2006, pp. 1681–1684.
- A. Pourhashemi, R. Farrell, D.A. Cohen, D.L. Becerra, S.P. DenBaars and S. Nakamura, Electron. Lett. 52, 2003–2005 (2016). doi: 10.1049/el.2016.3055
- R.J. Gove, DMD display system: the impact of all-digital display, Society for Information Display International Symposium, 1994, pp. 5–9.
- N. Abu-Ageel and D. Aslam, J. Disp. Technol. 10, 700–703 (2014). doi: 10.1109/JDT.2014.2316417