
ABSTRACT
In an attempt to contribute to the development of ultra-high-definition (UHD) TV viewing guidelines, the factors that may affect the image quality and visual comfort for both the adult and elderly groups were considered: viewing distance (2H, 4H, and 6H), surrounding environment (illuminance levels 0.6 and 250 lx), video content (day and night, high and low speed), and resolution (UHD and full HD). It was found that the surrounding viewing conditions affected the visual comfort of the adult group more than that of the elderly group. The young adults felt more comfortable visually watching TV in an illuminated room than in a dark room. It was also found that the higher resolution ensures satisfactory visual quality despite the deviations in the viewing distance. With the UHD resolution, the viewing distance was the most significant factor contributing to the image quality and visual comfort for both age groups. Therefore, ‘visual comfort distance’ was recommended considering each human factor variable for the optimal UHD TV viewing experience.
1. Introduction
Ultra-high-definition (UHD) TVs offer visuals that look real-world, and whose field of view (FOV) creates a movie-theater-like experience [Citation1,Citation2]. Considering the recent release of the 8K resolution, UHD TVs can be expected to become the next big item in the market. Smart devices have changed the way people watch and read media contents, but TVs are still frequently used as the main device and are broadly used across various generations. For virtual-reality-based devices, including UHD TVs, human factors [Citation3] play a critical role. Thus, in addition to the development of technologies such as those for improving the image quality and presence, the viewing environment has become an important factor to consider [Citation4]. Broadly speaking, human factors are human characteristics that system developers take into consideration for building a safe and efficient system. For example, optimal viewing distances are suggested based on the TV sizes (or image heights: H): ITU-R (1.6H) [Citation5].
The human factors are greatly affected by the display size, lighting conditions, viewing angle, resolution, and video contents in judging the image quality and visual comfort for displays. With an increased display technology, viewers can enjoy better virtual reality experiences, but attention should be paid to the resulting health concerns, such as viewer stress, asthenopia, and visually induced motion sickness (VIMS) [Citation6]. Among the well-known health concerns are visual discomfort and fatigue, which are widely studied in the stereoscopic display [Citation7,Citation8]. It is also necessary to consider the effect of the resolution and human health on this extension. An initial study was conducted through a subjective assessment, in which a group of participants in their 20s and 30s was compared to an older group with participants over 55. The amounts of time that it took for the two participant groups to start feeling tired after watching on a UHD TV were compared under controlled experimental conditions. The older group felt tired faster when exposed to dynamic images in a normally illuminated room (Av) from a distance of 1.6H. As for the younger group, when they were exposed to dynamic images in a dark room (Dk), they felt tired more. The group differences for static images were not significant, but for dynamic images, the group differences were sufficiently affected by the lighting conditions and viewing distances. These results suggest that more studies should be conducted on the viewing experiences of different age groups.
Spatial contrast sensitivity is highly related to variables like the display resolution (full HD (FHD), UHD), viewing distance, and surrounding conditions, which are considered human factors affecting the image quality and visual comfort. Theoretically, it is well known that the spatial contrast sensitivity of elderly people under photopic vision is lower than that of young adults due to their optical characteristics: pupillary miosos [Citation9], crystalline lens increase density [Citation10,Citation11], and intraocular light scatter and optical aberrations increase [Citation12,Citation13]. When the stimulus is at a low temporal frequency, however, the low spatial frequency sensitivity under the photopic level is not impacted by aging [Citation14], which implies that video contents may affect the different psychophysical results for different age groups. It was also shown in previous studies that the ‘preferred contrast value’ was different between the young and elderly observers for color displays [Citation15].
A study examined the viewing experiences of the research participants by controlling the picture quality (2K vs. 4K resolution) and comparing the results according to age (20s vs. 50s) [Citation16]. The results showed that the younger group reported higher scores in the psychological evaluation. Both groups scored higher in the Index of Nervous System Activity (NIRS) for the 4K content compared to the 2K content. It can be inferred from the study results that age and picture quality impose psychological effects on viewers, and specifically, that 4K creates more psychological experiences than 2K. In another study, the participants (young, old, and older) watched 2D and 3D images on a 4K TV. The results showed that there were differences in body sway among the different age groups showing different misery symptoms [Citation17].
As a follow-up to the aforementioned studies, a subjective assessment was conducted with four determining factors: age, illuminance level, viewing distance, and video content. In an attempt to contribute to the development of UHD TV viewing guidelines, the visual comfort and image quality that the participants assessed after watching on a UHD TV, and subsequently the effects of the human factors on the participants’ viewing experiences, were examined.
2. Method
2.1. Apparatuses
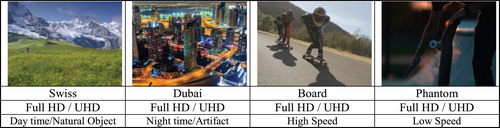
This study adopted two illuminance levels (0.6 lx vs. 250 lx) and used a 60-inch Samsung UHD 4K TV for the assessment. The full white of the display was 363.3 cd/m2 (x = 0.3584, y = 0.3638) with the normal picture mode. To effectively test the main effects of the picture quality on the ideal viewing distance, the video contents were controlled to compare the UHD and FHD TVs. Video contents that had both a UHD and an FHD picture quality resolution were chosen. As for the video contents, four different types were presented at the two different resolutions (Figure ).
Figure 1. Four different types of video contents: Swiss – day, Dubai – night, Board – high speed, Phantom – low speed.
2.2. Study participants
The study participants were 10 young adults in their 20s and 30s (adult group) and 10 elderly people over 55 years old (elderly group). The participants’ eyesight was examined using Dr Hahn's vision test chart for 3M, and all the participants were determined to have normal vision. In the subjective assessment of the image quality and visual comfort, the two variables were measured based on a 5-point Likert scale (5 points – excellent; 4 points – good; 3 points – fair; 2 points – poor; and 1 point – bad).
2.3. Procedure
The illuminance level, video content, and viewing distance were manipulated to create various conditions for the UHD TV viewing, and based on the assessment results of visual comfort and image quality, an attempt was made to identify the ideal viewing conditions. As can be seen in Table , the levels of manipulation can be summarized as follows: illuminance level (Dk: 0.6 lx vs. Av: 250 lx); viewing distance (2H vs. 4H vs. 6H, H: TV height = 0.748 m); and picture quality (FHD vs. UHD). The illuminance level was measured on the surface where the TV was placed. The video contents were randomly presented for 1 minute each. Enough time (approximately 10 seconds) was incorporated between the images to prevent lingering tiredness from affecting the later viewing experiences. After the image presentation, the study participants were asked to assess the visual comfort of the presentation as well as the quality of the image. A presentation was first given in a Dk for 5 minutes for visual adaptation, and later in an Av, after a 5-minute rest. More details on the experimental procedures and conditions can be found in Figures and .
Figure 2. Experiment procedure for a single video content (Q; assessment of visual comfort and image quality).
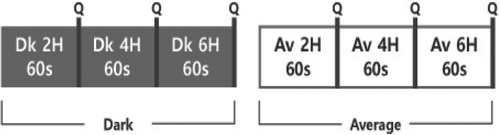
Figure 3. Actual surrounding environment conditions (illuminance level): (a) 250 lx; (b) 0.6 lx.
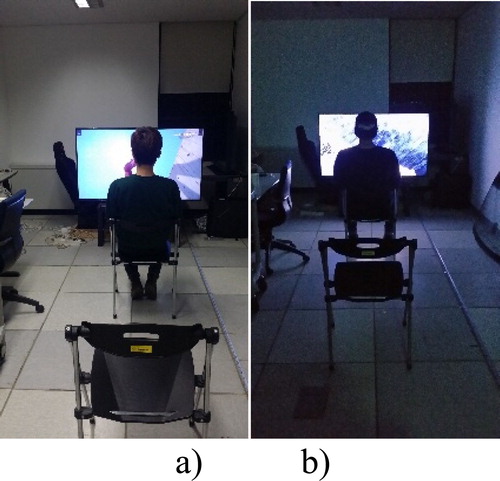
Table 1. Viewing conditions.
3. Results
A subjective assessment of the image quality and visual comfort was conducted with the four determining factors of age (young adult and elderly), illuminance level (dark, dim, and average), viewing distance (2H, 4H, and 6H), and video contents (four moving images). First, the relationship between image quality and visual comfort was analyzed to determine if one affected the other. Second, the image quality and visual comfort results were compared considering the different factors. Finally, the viewing comfort distance was presented based on the results.
The relationship between image quality and visual comfort was computed using Spearman's rho correlation. Image quality and visual comfort showed a low correlation for both the adult (correlation coefficient = 0.310; p < .032) and elderly (correlation coefficient = −0.078; p < .600) groups. Therefore, the factors that may affect the image quality and visual comfort for both the adult and elderly groups were considered to be the viewing distance, surrounding environment (illuminance level), video content, and resolution.
The correlation coefficient for image quality and visual comfort against viewing distance, surrounding environment, and resolution were computed, and the values that were obtained are shown in Table . The video contents were discarded for not having an ascending order. Viewing distance and image quality showed an inverse relationship (correlation coefficient = −0.514; p < .000) in the elderly group, indicating that viewing at a close distance leads to better image quality perception. Visual comfort and viewing distance had the highest and valid correlation values, showing that viewing at a farther distance boosted the visual comfort of both the adult and elderly groups.
Table 2. Correlation coefficients of image quality and visual comfort against viewing distance, s the adult and elderly groups.
3.1. FHD vs. UHD resolutions
3.1.1. Image quality
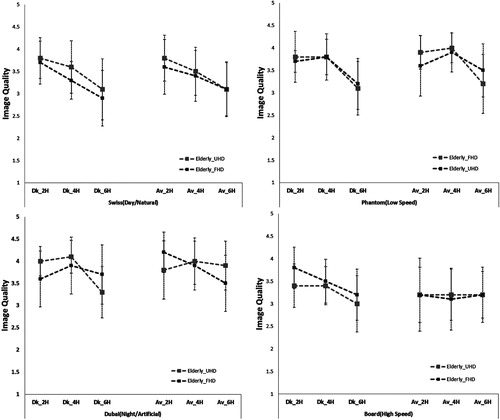
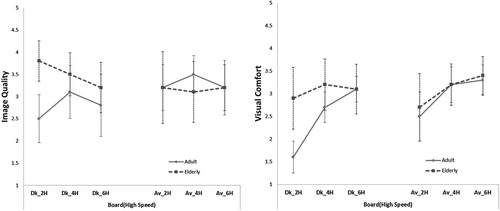
Figure shows the adult group's assessment results of the image quality for the ‘Board’ and ‘Dubai’ images in FHD and UHD. The error bars correspond to the 95% confidence level. The ‘Board’ image portrays fast action (surfing or skateboarding) while the ‘Dubai’ image presents artificial objects (buildings, roads, etc.) at night quickly replacing one another. When presented in FHD, both images were assessed to be of better quality when the viewing distance was farther. In UHD, however, the image quality was assessed as poor once the viewing distance became farther than 4H.
Figure 4. Image quality score for UHD and FHD when viewing the ‘Board’ and ‘Dubai’ video contents for the young adult group.
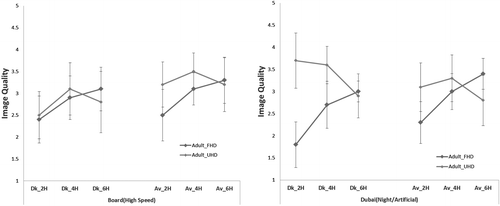
Figure shows the adult group's assessment results of the image quality of the ‘Swiss’ and ‘Phantom’ images in UHD and FHD. The ‘Swiss’ image showed serene nature (trees, mountains, etc.) in daylight while the ‘Phantom’ image showed action in slow motion. The quality of the ‘Swiss’ image in FHD was not affected by the viewing distance or illuminance level, but the quality of the image in UHD was reported to be dramatically poor at 6H. The quality of the ‘Phantom’ image was assessed as the poorest at 6H both in UHD and FHD. It can be seen in Figures and that the adult group assessed the UHD images to be of better quality than the FHD images regardless of whether the video content was closer than 6H.
Figure 5. Image quality score for UHD and FHD when viewing the ‘Swiss’ and ‘Phantom’ video contents for the young adult group.
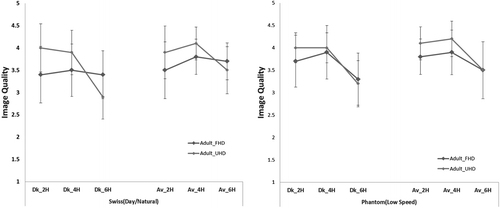
Figure shows the elderly group's assessment results of the quality of the same images. For the ‘Swiss’ image in both UHD and FHD, the elderly participants assessed the image quality at 2H as the best, and they assessed it as worse as the viewing distance increased. For the ‘Phantom’ image in both UHD and FHD, the image quality score increased at 4H but decreased at 6H. These findings indicate that elderly people, compared to young adults, do not sense much difference between UHD and FHD images.
Figure 6. Image quality score for UHD and FHD when viewing the video content for the elderly group.
3.1.2. Visual comfort
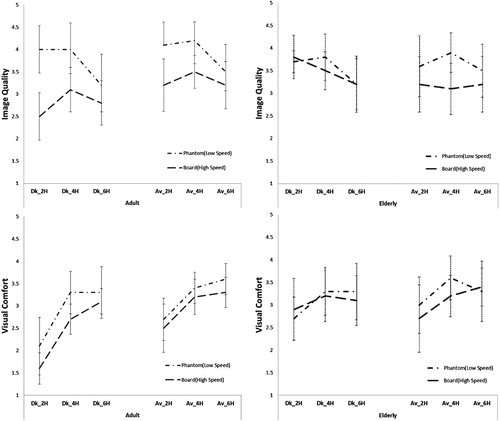
Figure shows the adult group's assessment results of visual comfort for the images in UHD and FHD. Their visual comfort scores at 4H were higher than those at 2H. Otherwise, minimal changes were reported across different conditions.
Figure 7. Visual comfort score for UHD and FHD when viewing the video content for the young adult group.
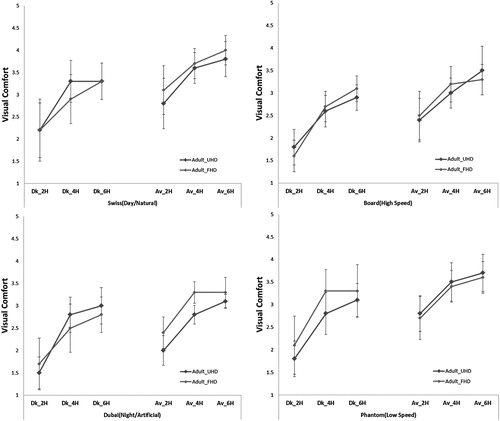
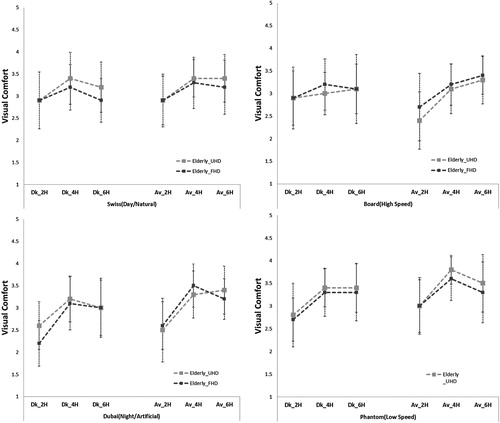
Figure reports the elderly group's assessment results of visual comfort for the images in UHD and FHD. For most of the images, their visual comfort scores were the highest at 4H when in UHD. Compared to the young adults, whose visual comfort scores slightly or barely increased as the viewing distance increased, the elderly participants’ scores increased for the ‘Swiss,’ ‘Dubai,’ and ‘Phantom’ images up to 4H but decreased again at 6H.
Figure 8. Visual comfort score for UHD and FHD when viewing the video content for the elderly group.
3.2. Adult vs. elderly participants
Figure reports the assessment results of the image quality and visual comfort for the UHD image of a motionless nature in daylight by both the elderly and young adult study participants. Both groups assessed the image at 6H as having a lower quality. Meanwhile, the elderly participants felt most comfortable at 4H whereas the young adults felt more comfortable as the viewing distance increased, regardless of the illuminance level. The visual comfort depended on the viewing distance, which is highly related to the total brightness of the display. Therefore, the elderly participants with lower vision needed higher brightness for visual comfort.
Figure 9. Image quality and visual comfort scores for UHD when viewing the ‘Swiss’ video content for each age group.
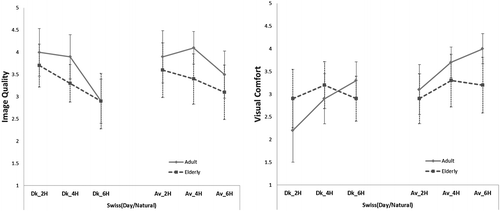
Figure shows the assessment results of the image quality and visual comfort by both the elderly and young adult study participants for the UHD image of quickly changing artificial objects at night. The image quality scores of the elderly participants were generally higher than those of the young adults across all the viewing distance conditions. The elderly participants also scored slightly higher on visual comfort than the young adults. The elderly group's visual comfort and image quality scores both declined when the viewing distance became farther than 4H. In contrast, the adult group's visual comfort scores continued to increase while their image quality scores decreased.
Figure 10. Image quality and visual comfort scores for UHD when viewing the ‘Dubai’ video content for each age group.
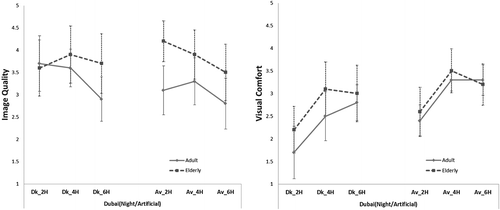
Figure compares the image quality and visual comfort assessment results by the young adult and elderly study participants for the UHD image of surfers and skateboarders in action. The young adults reported that the image quality at 4H was the best across all the illuminance levels, but the scores decreased at 6H. In comparison, their visual comfort scores sharply increased up to 4H, after which the scores increased slightly at 6H.
Figure 11. Image quality and visual comfort scores for UHD when viewing the ‘Board’ video content for each age group.
3.3. Surrounding conditions
The effects of dark and average viewing environments on image quality and visual comfort were analyzed using one-way ANOVA (Table ).
Table 3. ANOVA results for viewing environment affecting the image quality and visual comfort.
Figures and show the adult group's assessment results of image quality and visual comfort, respectively, for the UHD images in a Dk vs. an Av. Figure shows that the young adults were more affected by the illuminance level. Regardless of the video content, the young adults felt more comfortable visually watching TV in an Av than in a Dk. Additionally, their visual comfort scores increased as the viewing distance increased for most of the video contents. This was also shown by the ANOVA results in Table . Meanwhile, the young adults’ image quality scores drastically decreased when the viewing distance reached over 4H.
Figure 12. Visual comfort score according to the illuminance level for UHD when viewing a video content for the young adult group.
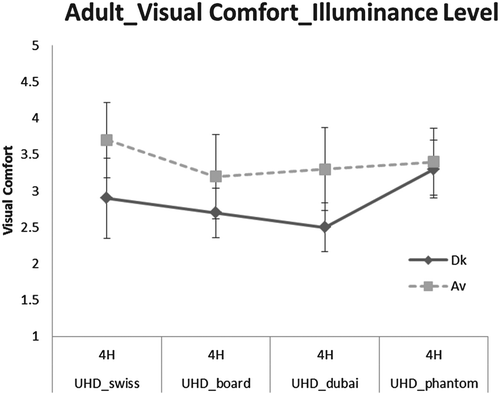
Figure 13. Image quality score according to the illuminance level for UHD when viewing a video content for the young adult group.
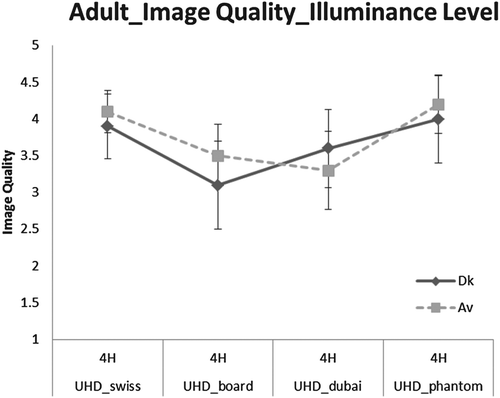
Table 4. ANOVA results for viewing distance affecting the image quality and visual comfort.
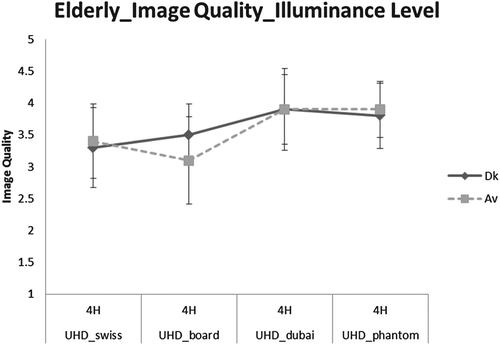
Figures and compare the elderly group's assessment results of image quality and visual comfort, respectively, for the UHD images in Dk vs. Av. Figure shows that both the elderly and young adult study participants felt more comfortable visually watching TV in Av than in Dk. The score difference between Av and Dk for the elderly participants, however, was not as large as that for the young adults. With the exception of the ‘Board’ image in Av, the elderly participants’ visual comfort scores were higher at 4H both in Av and Dk. It was inferred from Figure that the image quality scores for the ‘Swiss’ and ‘Phantom’ images were not very much affected by the illuminance level. The image quality scores for the ‘Board’ image at 2H and 4H were higher in Dk than in Av, and those for the ‘Dubai’ image were the highest at 2H in Av.
Figure 14. Visual comfort score according to the illuminance level for UHD when viewing a video content for the elderly group.
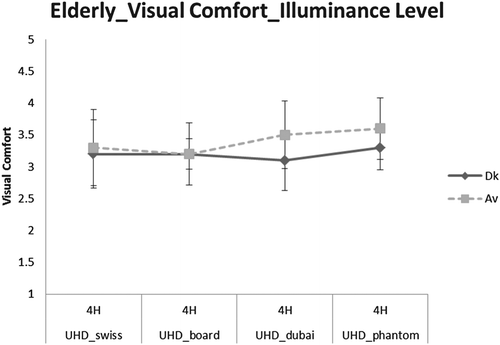
Figure 15. Image quality score according to the illuminance level for UHD when viewing a video content for the elderly group.
3.4. Video contents
In Figure , the elderly group's assessment results of image quality and visual comfort for the ‘Swiss’ image in UHD and the ‘Dubai’ image in UHD were compared with the adult group's scores. The young adults generally found the ‘Swiss’ image more visually comfortable and also of better quality than the ‘Dubai’ image unless they watched at 6H in Dk, when the image quality scores decreased for both images while the visual comfort scores slightly or barely increased. In contrast, the elderly participants reported higher image quality scores for the ‘Swiss’ image in Dk but showed the opposite in Av, rating the ‘Dubai’ image better. Their visual comfort scores were more affected by the viewing distance than by the illuminance level when they viewed the ‘Swiss’ image. For the ‘Dubai’ image, the visual comfort scores were very low, but the image quality scores were the highest.
Figure 16. Image quality and visual comfort scores for UHD for the ‘Swiss’ and ‘Dubai’ video contents for each age group.
In Figure , the elderly group's assessment results of image quality and visual comfort for the ‘Board’ image in UHD and the ‘Phantom’ image in UHD were compared with the adult group's scores. The young adults’ image quality and visual comfort scores were both better for the ‘Phantom’ image than for the ‘Board’ image. For the ‘Phantom’ image, the young adults’ visual comfort scores slightly or barely increased as the viewing distance increased from 4H to 6H, but their image quality scores sharply decreased for the same distance change. The elderly participants also has higher scores for the ‘Phantom’ image than for the ‘Board’ image on both image quality and visual comfort, although the score differences were not as large as those for the young adults. Their visual comfort scores increased up to 4H but decreased thereafter. Their image quality scores decreased as the viewing distance increased. Overall, 4H was the compromising viewing distance that balanced the visual comfort and image quality for both the elderly and young adult study participants.
Figure 17. Image quality and visual comfort scores for UHD for the ‘Board’ and ‘Phantom’ video contents for each age group.
3.5. Visual comfort distance
The effects of the viewing distance on the image quality and visual comfort were analyzed via one-way ANOVA (Table ). The viewing distance was the most significant factor affecting the image quality and visual comfort for both age groups. The results are repeatedly shown in the previous graphs. Therefore, an extra experiment was performed to determine the most appropriate viewing comfort distance (‘visual comfort distance’) for the different conditions.
Figure shows the recommended ‘visual comfort distance’ for the adult group on the left and the elderly group on the right. The recommended viewing distance range was computed based on the results of the previous experiment, and the range was narrowed to a single distance through a psychophysical experiment for a small group consisting of people with different ages. The best viewing distance was similar for the elderly group in various conditions and slightly farther under dark surrounding conditions. The recommended distance varied, however, for the adult viewing group, especially for FHD and the different surrounding conditions. This shows that the elderly participants’ ideal viewing distance was closer despite the video contents or surrounding conditions, which was due to their lower vision compared to the young adults.
Figure 18. ‘Visual comfort distance’ considering different conditions for the young adult (left) and elderly (right) groups.
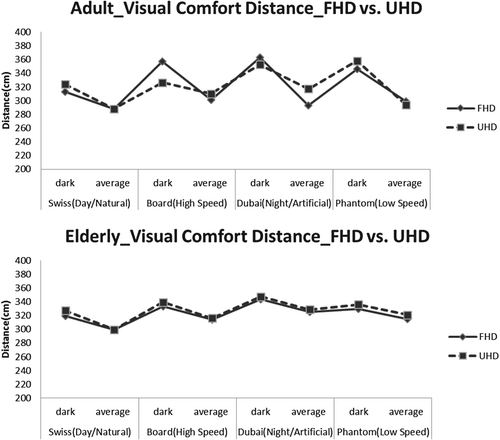
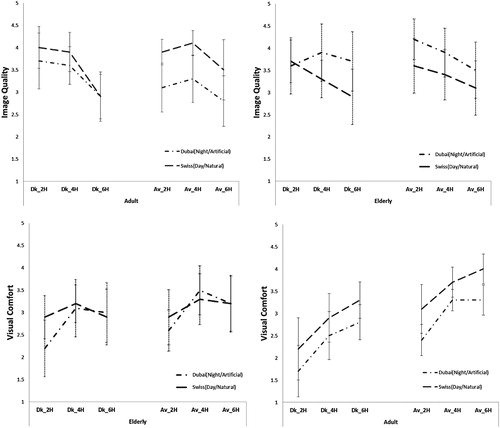
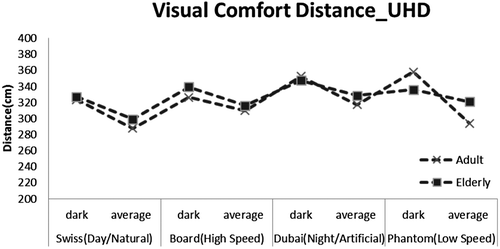
Figure shows the recommended ‘visual comfort distance’ of the various types of video content in UHD for the young adult and elderly groups under dark and average surrounding conditions. The largest difference occurred for the ‘Phantom’ video content, which was slow motion and resumed to be affected by the resolution difference. Note that the distance recommended in this study is not an absolute value but a reference value to consider when comparing users (adult/elderly), viewing conditions (Dk/Av), and different video contents.
Figure 19. Recommended ‘visual comfort distance’ of the various types of video content in UHD for the adult and elderly groups under dark and average surrounding conditions.
4. Conclusion
The effects of the viewing distance, video contents, and surrounding conditions on the image quality and visual comfort between different age groups were analyzed in this study. These two age groups were considered due to elderly people's different spatial contrast sensitivity level due to their presbyopia. The different vision of the two groups caused image quality and visual comfort to have a nonlinear relationship, which was considered linear. The image quality and visual comfort were shown to have crossing relationships depending on the viewing distance, and to have optimal points where both the image quality and the visual comfort were satisfied. ‘Visual comfort distance’ was recommended as a result through the experiment with various variables. Through such experiments, it was found that the higher resolution of UHD compared to FHD ensures satisfactory visual quality despite the deviations in the viewing distance. It was also found that the surrounding viewing conditions affected the visual comfort of the adult group more than they did the elderly group.
Disclosure statement
No potential conflict of interest was reported by the authors.
Additional information
Funding
Notes on contributors

YungKyung Park
YungKyung Park, Ph.D., has been a professor at Ewha Women's University, South Korea since 2012, conducting research in the color science field. Before joining Ewha Women's University, Park was a senior engineer at Samsung Electronics (LCD Division). During her second-year stint at Samsung Electronics, Park conducted research on image quality and color appearance. She received a Ph.D. degree in color science from Leeds University, U.K., and a Master's degree in color imaging science from Derby University, U.K. She received her B.A. and Master's degree in physics from Ewha Women's University.

YoonJung Kim
YoonJung Kim is a senior researcher of Ewha Color Design Research Institute, South Korea. She received her B.S. and M.S. degrees in electric engineering from Ewha Women's University in 2002. Her research work has been focused on the development of the image quality of large and next-generation displays.

Daeun Park
Daeun Park obtained her bachelor's degree in communications from Kunkuk University in 2013, after which she pursued a Master's degree in color design from Ewha Women's University. In the Master's studies, she has conducted several researches about image and light colors.
References
- J.J.W. Lin, H.B.L. Duh, D.E. Parker, H. Abi-Rached and T.A. Furness, Proc. IEEE Virtual Reality 2002, 164–171 (2002).
- M. Emoto, Y. Kusakabe and M. Sugawara, J. Disp. Technol. 10 (8), 635–641 (2014). doi: 10.1109/JDT.2014.2312233
- M. Sugawara, K. Masaoka, M. Emoto, Y. Matsuo and Y. Nojiri, SMPTE Motion Imag. J. 117 (3), 23–29 (2008). doi: 10.5594/J15117
- H. Kim, S. Ahn, W. Kim and S. Lee, IEEE Trans. Broadcast. 62 (4), 757–769 (2016). doi: 10.1109/TBC.2016.2590818
- ITU-R BT.2022, General Viewing Conditions for Subjective Assessment of Quality of SDTV and HDTV Television Pictures on Flat Panel Displays, ITU, 2012 (unpublished).
- A.G. Solimini, A. Mannocci, D.D. Thiene, G.L. Torre, BMC Public Health 12 (1) (2012). doi: 10.1186/1471-2458-12-779
- M. Lambooij, M. Fortuin, I. Heynderickx and W. IJsselsteijn, J. Imaging Sci. Technol. 53 (3), 30201-1 (2009). doi: 10.2352/J.ImagingSci.Technol.2009.53.3.030201
- W.J. Tam, F. Speranza, S. Yano, K. Shimono and H. Ono, IEEE Trans. Broadcast. 57 (2), 335–346 (2011). doi: 10.1109/TBC.2011.2125070
- I.E. Loewenfeld, Topics Neuro-ophthalmology 130 (1979).
- J. Pokorny, V.C. Smith and M. Lutze, Appl. Opt. 26 (8), 1437–1440 (1987). doi: 10.1364/AO.26.001437
- F.S. Said and R.A. Weale, Gerontology 3 (4), 213–231 (1959). doi: 10.1159/000210900
- P. Artal, A. Guirao, E. Berrio, P. Piers and S. Norrby, Int. Ophthalmol. Clin. 43 (2), 63–77 (2003). doi: 10.1097/00004397-200343020-00008
- A. Glasser and M.C. Campbell, Vision Res. 38 (2), 209–229 (1998). doi: 10.1016/S0042-6989(97)00102-8
- C. Owsley, Vision Res. 51 (13), 1610–1622 (2011). doi: 10.1016/j.visres.2010.10.020
- G. Kutas, Y. Kwak, P. Bodrogi, D.S. Park, S.D. Lee, H.K. Choh and C.Y. Kim, Displays 29 (3), 297–307 (2008). doi: 10.1016/j.displa.2007.08.012
- K. Sakamoto, S. Sakashita, H. Shimazaki, M. Kawashima, K. Yamashita and A. Okada, in 2015 IEEE International Symposium on (IEEE, 2015).
- K. Yoshikawa, H. Takada and M. Miyao, SID Symp. Dig. Tech. Pap. 45 (1), (2014). doi: 10.1002/j.2168-0159.2014.tb00285.x