
 ?Mathematical formulae have been encoded as MathML and are displayed in this HTML version using MathJax in order to improve their display. Uncheck the box to turn MathJax off. This feature requires Javascript. Click on a formula to zoom.
Abstract
Deep red phosphor-based LEDs play a crucial role in plant growth applications, where the LED emission covers the phytochrome (Pr) absorption. In this context, a series of Sm3+-activated Li3BaSrLn3(MO4)8:Sm3+ [Ln = La Gd and Y; M = Mo and W] deep red phosphors were synthesized using the solid-state method. The outcome of the PXRD patterns suggests that the synthesized phosphors were crystallized in a monoclinic structure with the space group C2/c. SEM analysis was executed to study the morphology of the phosphors, and an FT-IR study was performed to study the stretching frequency of the MO/W-O bond in the (Mo/W)O4 groups. All the Sm3+-activated phosphors showed intense emission at 646 nm due to their 4G5/2→6H9/2 transition and exhibited excellent thermal stability (> 72% at 423K). The selected phosphors showed internal quantum efficiency at around 30%. The pc-LEDs were fabricated with the combination of near-UV LED and the synthesized deep-red phosphors. Besides, the emission spectrum of the fabricated LED was compared with the phytochrome Pr absorption spectrum for de plant growth application. These results suggest that the synthesized phosphor can be useful in the white LED fabrication to improve the CRI and can also be beneficial in the plant growth field.
1. Introduction
Phosphor-converted white light-emitting diodes (LEDs) are considered potential alternative candidates for conventional lighting sources, such as incandescent bulbs and fluorescent lamps, due to their advantages such as their high energy conversion efficiency, good color rendering, long-duration ability, and eco-friendly nature [Citation1–3]. As of now, commercial white LEDs are made up of the combination of a blue LED with yellow Y3Al5O12:Ce3+ (YAG:Ce3+)-emitting phosphor [Citation4]. This device lacks the red-emitting component, which accounts for its low color rendering index (CRI) and high correlated temperature (CCT) [Citation5–7]. These issues can be resolved by utilizing the methodology of mixing near-ultraviolet (n-UV) LED chips with red-, green-, and blue-emitting phosphors. In this context, numerous commercial red phosphors have been synthesized, including Y2O2S:Eu3+ [Citation8], Y2O3:Eu3+ [Citation9] and YVO4:Eu3+ [Citation10]. However, the absorption of these phosphors is still not good enough in the n-UV region. Divalent europium-activated nitride or oxy-nitride based phosphors have also been considered potential alternatives. However, their synthetic condition and emission band restrict their usage in white LEDs.
Sm3+-activated phosphors are also attracting much attention for white LEDs due to their multiple emissions at 563 nm (4G5/2→6H5/2), 599 nm (4G5/2→6H7/2), 646 nm (4G5/2→6H9/2), and 705 nm (4G5/2→6H11/2), which are expected to improve the CRI of the white LEDs and intensify their red emission at the transition. The excitation and emission of the Sm3+ ion correspond to the electric dipole transition, and the red luminescence intensity is greatly affected by the selection of the host lattice [Citation11]. In recent years, transition metal oxide-based host lattices started to be seen as more attractive for getting better emission of Ln3+ ions, and because of its advantages such as its broad charge transfer band in the n-UV region, and its commercial support [Citation12]. There are three kinds of transition metal oxide-based Sm3+-activated red phosphors: NaKLaMO5:Sm3+ (M = Nb, Ta) [Citation13], La2MoO6:Sm3+, and [Citation14] YVO4:Sm3+ [Citation15]. However, these phosphors have some demerits, such as poor red color saturation, low thermal stability, and IQE. Therefore, these phosphors failed to improve the CRI and white LED device efficiency. To overcome these defects and thereby improve the CRI and white LED device efficiency, new host lattices that have high thermal stability and IQE must be found. The molybdate host lattice is considered a good host matrix for Ln3+-based luminescent materials due to its high thermal quenching behavior and chemical stability [Citation16]. Recently, the research group developed an Eu3+-activated red phosphor with an Li3BaSrLa3(MoO4)8 host lattice. It showed a higher thermal stability, zero concentration quenching, and QY [Citation17]. There is still no report on Sm3+-activated Li3BaSrLn3(MO4)8 [Ln = La, Gd and Y; M = Mo and W] red phosphors. Thus, Sm3+-activated Li3BaSrLn3(MO4)8 [Ln = La, Gd and, Y; M = Mo and W] orange red phosphors were synthesized for white LED application. The synthesized phosphors showed outstanding thermal stability and decent IQE, which will greatly improve the white LED efficiency.
In other active areas where red or deep red LEDs are considered essential resources for plant growth, Sm3+-activated phosphor-based LED could especially be effectively utilized for plant growth applications because the emission spectral band of Sm3+-activated phosphor is well-matched with the absorption spectrum of plant pigments and overlaps well with the phytochrome Pr photoreceptor. For example, the Sm3+-activated Sr8ZnY(PO4)7 phosphors for plant growth application reported by Zhou et al. showed intense emission at 606 nm (4G5/2→6H7/2) [Citation18]. Still, there was a spectral mismatch between the LED emission and the pigment absorption. To completely cover the absorption spectrum of the phytochrome Pr, the LED phosphor should have multiple emissions in the red to deep red region. The Sm3+-activated phosphor in this study showed intense emission at 646 nm (4G5/2→6H9/2), as well as at 606 nm (4G5/2→6H7/2), which can make it a suitable choice for plant growth, since it can cover the Pr absorption more efficiently.
2. Experimental section
The Li3BaSrLn3(MO4)8:Sm3+ [Ln = La Gd and Y; M = Mo and W] phosphors were synthesized via the high-temperature solid-state route. The raw materials were purchased from Alfa Aesar. The stoichiometric amounts of Li2CO3, BaCO3, SrCO3, La2O3, Gd2O3, Y2O3, Sm2O3, MoO3, and WO3 were ground well in an agate mortar and pestle. These raw materials were heated at 600oC for 12 h, reground, and further heated at 800oC for another 12 h. The final product was reground and stored in vials for further use.
2.1. Characterization
The x-ray diffraction of all the synthesized phosphors was recorded using the Rigaku ULTIMA IV, Japan with Cu-Kα1 radiation for generations of x-rays. The crystal structure was drawn using Diamond software. The SEM images were acquired with a JEOL JSM 6480LV scanning electron microscope (SEM). Fourier transform infrared spectroscopy (FTIR) was carried out in the range of 400–4000 cm−1 with a PerkinElmer Spectrum Version 10.4.00. The photoluminescence (excitation and emission) spectra, lifetime, and quantum yield were recorded using Edinburg Spectrofluorometer FS–5 instruments with attached SC – 10 modules and SC – 30 integrating sphere modules. A pulsed xenon lamp was used as the excitation source, and the signals were noted with a photomultiplier. The temperature-dependent PL spectra were measured using the Edinburgh FS–5 spectrometer equipped with a temperature controller. The CIE color coordinates were calculated from the emission spectral data of the synthesized phosphors using MATLAB software. All the measurements were carried out at room temperature.
3. Results and discussion
3.1. Phase conformation and crystal structure study
The powder XRD pattern of the Sm3+-activated Li3BaSrLn3(MoO4)8 (Ln = La Gd and Y) and Li3BaSrLn3(WO4)8 (Ln = La Gd and Y) phosphors are shown in Figures and , respectively. As seen from the XRD pattern, all the diffraction peaks are identical with the JCPDS (Joint Committee for the Powder Diffraction System) card number 77–0830, and no impurity line was observed. The synthesized phosphors were crystallized in the monoclinic phase with the space group C2/c. Also, the Sm3+-activated phosphors did not show any changes in the XRD patterns, which confirms the successful incorporation of Sm3+ in the Ln3+ sites because the identical ionic radii of the Sm3+ ion (CN = 8) was 1.079Å and the ionic radii of the La3+, Gd3+ and Y3+ (CN = 8) ions were 1.16, 1.053, and 1.019Å, respectively. Also, the ionic radii of the W6+ (CN = 4, r = 0.42Å) was similar to the Mo6+ (CN = 4, r = 0.41Å), so the XRD patterns of the Li3BaSrLn3(MoO4)8 and the Li3BaSrLn3(WO4)8 were similar [Citation19].
Figure 1. Powder XRD patterns of the Li3BaSrLn3−x(MoO4)8:xSm3+ [Ln = (a) La, (b) Gd, and (c) Y] phosphor.
![Figure 1. Powder XRD patterns of the Li3BaSrLn3−x(MoO4)8:xSm3+ [Ln = (a) La, (b) Gd, and (c) Y] phosphor.](/cms/asset/8474cd0e-6bb5-4753-9159-4a70e2d29530/tjid_a_1831630_f0001_oc.jpg)
Figure 2. Powder XRD patterns of the Li3BaSrLn3−x(WO4)8:xSm3+ [Ln = (a) La, (b) Gd, and (c) Y] phosphor.
![Figure 2. Powder XRD patterns of the Li3BaSrLn3−x(WO4)8:xSm3+ [Ln = (a) La, (b) Gd, and (c) Y] phosphor.](/cms/asset/26a61637-6a18-49f1-97f8-20e3e689d548/tjid_a_1831630_f0002_oc.jpg)
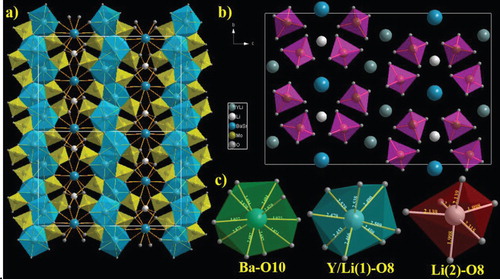
Figure illustrates the crystal structure of the Li3BaSrY3(MoO4)8 phosphor. Site Y is shared with the Li at the proportion of 0.75:0.25, and forms a distorted Y:Li(1)O8 polyhedron from its coordination with eight oxygen atoms. The adjoining Y:Li(1)O8 polyhedra are associated together through mutual edges to provide a two-dimensional Y:Li(1) layer made out of six rings. The Ba/Sr atom is surrounded by 10 oxygen atoms and forms a distorted polyhedron. The bond distances of Ba/Sr – O range from 2.687–3.027 Å. The Li(2) atom forms a distorted octahedron by coordinating with the six oxygen atoms, and the bond distance of Li(2) – O ranges from 1.998–2.315 Å. The Ba/SrO10 and Y:Li(1)O8 polyhedra form a chain by connecting with the O(5)–O(5) and O(1)–O(7) edges, which are parallel to the Y:Li(1)O8 chains. Also, the crystal structure contains two kinds of molybdate sites, Mo(1) and Mo(2), and both molybdate atoms are in the 8f site. Mo(1) is coordinated with the O(1), O(2), O(3), and O(4) atoms. Similarly, Mo(2) is coordinated with the O(5), O(6), O(7), and O(8) atoms, and the bond distances of Mo(1) – O4 and Mo(2) – O4 range from 1.740–1.765 Å and 1.721–1.784 Å, respectively. The bond distances of MoO4 are the shortest pairs in the structure and stabilize the MoO4 tetrahedral structure [Citation20].
Figure 3. (a and b) Crystal structure of the Li3BaSrY3(MoO4)8 phosphor, and (c) coordination of Ba, Y/Li(1), and Li(2) with oxygen.
3.2. Scanning electron microscopy (SEM)
To study the morphology of the synthesized phosphors, SEM images were collected with a scanning electron microscope. Figures and illustrate the SEM images of the Sm3+-activated Li3BaSrLn3(MoO4)8 [Ln = La, Gd and Y] and Li3BaSrLn3(WO4)8 [Ln = La, Gd and Y] phosphors, respectively. The SEM images clearly indicate that the synthesized phosphor had an irregular morphology, and the particles were aggregated. The average size of the particle ranged from 2 to 5 micrometers. The lower and higher magnifications of the SEM images are shown in RHS and LHS, respectively. The elemental mapping and EDX analysis of the Sm3+-activated Li3BaSrLn3(MoO4)8 (Ln = La, Gd and Y) and Li3BaSrLn3(WO4)8 [Ln = La, Gd and Y] phosphors are presented in Figures S1 to 6. The elemental mapping reveals the presence of all the elements and their homogeneous distribution on the surface of the phosphors. The homogeneous distribution of the Ln3+ ions in the lattice can favor the luminescence characteristics of the phosphor. Also, the EDX spectrum reveals the existence of all the Ba, Sr, La, Gd, Y, Sm, Mo, W, and O elements in the phosphor composition.
Figure 4. SEM image of the Sm3+-activated Li3BaSrLn3(MoO4)8 [Ln = (a and b) La, (c and d) Gd, and (e and f) Y] phosphor.
![Figure 4. SEM image of the Sm3+-activated Li3BaSrLn3(MoO4)8 [Ln = (a and b) La, (c and d) Gd, and (e and f) Y] phosphor.](/cms/asset/335eb4b0-1f29-4142-8503-e4fdb48dfbfe/tjid_a_1831630_f0004_oc.jpg)
Figure 5. SEM image of the Sm3+-activated Li3BaSrLn3(WO4)8 [Ln = (a and b) La, (c and d) Gd, and (e and f) Y] phosphor.
![Figure 5. SEM image of the Sm3+-activated Li3BaSrLn3(WO4)8 [Ln = (a and b) La, (c and d) Gd, and (e and f) Y] phosphor.](/cms/asset/0cf293b8-895e-4e14-beb8-5dc771511ce0/tjid_a_1831630_f0005_oc.jpg)
3.3. FT-IR spectroscopy
Figure shows the FT-IR spectrum of the Li3BaSrLn3(MO4)8 [Ln = La, Gd and Y; M = Mo (a) and W (b)] phosphors. All the Li3BaSrLn3(MoO4)8 (Ln = La, Gd and Y) phosphors that show sharp peaks at 421 cm−1 are ascribed to the stretching vibrations of the O-Mo-O of MoO4 group in the host lattice. The MoO4 group stretching vibration are mostly observed below the 500-cm−1 region. Besides, the Ln-O stretching frequency can be observed in the 400- to 500-cm−1 region [Citation12]. The Ln-O stretching vibrations are not visible because of the possible overlap between the MoO4 groups and the Ln-O stretching vibrations. Also, the spectra show strong bands at 834 cm−1, which correspond to the stretching vibrations of the Mo-O of the MoO4 groups [Citation21].
Figure 6. (a) FT-IR spectrum of the Li3BaSrLn3(MoO4)8 (Ln = La, Gd, and Y) and (b) Li3BaSrLn3(WO4)8 (Ln = La, Gd, and Y) phosphors.
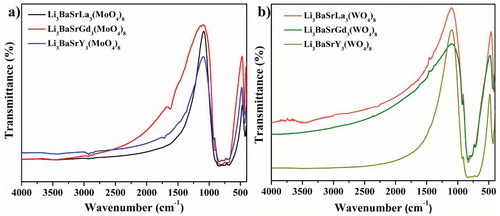
Similar phenomena were seen with the Li3BaSrLn3(WO4)8 (Ln = La, Gd and Y) phosphors (Figure b). The sharp peak at 836 cm−1, which is responsible for the stretching vibrations of the W-O of the WO4 groups, is in the lattice. Another intense peak at 431 cm−1 is seen at the stretching vibrations of the O-W-O of the WO4 group in the host lattice. Apart from that, the Ln-O stretching frequency can be observed in the 400- to 500-cm−1 region, which is invisible because of the possible overlap between the MoO4 groups and the Ln-O stretching vibrations. All the FT-IR spectra that show a small peak at around the 1,700-cm−1 region are ascribed to the O-H stretching vibrations of the H2O molecule, which is observed from the air atmosphere.
3.4. Photoluminescence (PL) study
The photoluminescence excitation spectra of the Sm3+-activated Li3BaSrLn3(MoO4)8 [Ln = La, Gd and Y] and Li3BaSrLn3(WO4)8 [Ln = La, Gd and Y] phosphors are presented in Figures and (LHS), respectively. All the excitation spectra that contain a broadband in the 220- to 350-nm region220- can be attributed to the charge transfer transition of the O2–-Sm3+ and the electronic transition from the 2p orbital of the oxygen to the 5d orbital of the MO4 (M = Mo and W) groups. Also, the spectra consist of several sharp intense absorptions in the range of 360–500 nm, which are attributed to the 4f-4f electronic transition of the Sm3+ ions. The sharp peaks at 363, 376, 406, 421, and 465 nm are attributed to the 6H5/2→4L15/2, 6H5/2→6P7/2, 6H5/2→4F7/2, 6H5/2→4P7/2, and 6H5/2→4I11/2 electronic transitions, respectively. Among them, the peak at 406 nm (6H5/2→4F7/2) is stronger than the other peaks [Citation22].
Figure 7. PLE (LHS) and PL (RHS) spectra of the Li3BaSrLn3(MoO4)8:Sm3+ [Ln = (a and b) La, (c and d) Gd, and (e and f) Y] phosphor.
![Figure 7. PLE (LHS) and PL (RHS) spectra of the Li3BaSrLn3(MoO4)8:Sm3+ [Ln = (a and b) La, (c and d) Gd, and (e and f) Y] phosphor.](/cms/asset/560572e6-3942-4f73-8412-96c130617950/tjid_a_1831630_f0007_oc.jpg)
Figure 8. PLE (LHS) and PL (RHS) spectra of the Li3BaSrLn3(WO4)8:Sm3+ [Ln = (a and b) La, (c and d) Gd, and (e and f) Y] phosphor.
![Figure 8. PLE (LHS) and PL (RHS) spectra of the Li3BaSrLn3(WO4)8:Sm3+ [Ln = (a and b) La, (c and d) Gd, and (e and f) Y] phosphor.](/cms/asset/870003b7-3448-4114-b0e8-fc49a9377429/tjid_a_1831630_f0008_oc.jpg)
The PL emission spectrum of the Sm3+-activated Li3BaSrLn3(MoO4)8 [(a) (Ln = La), (b) Gd, and (c) Y] and Li3BaSrLn3(WO4)8 [Ln = La, Gd and Y] phosphors are presented in Figures and (RHS), respectively, which were monitored under excitation at 406 nm. All the emission spectra exhibited a sharp red orange emission at 646 nm, and consisted of several sharp peaks at 563, 599, 646, and 705 nm, which are assigned to the 4G5/2→6H5/2, 4G5/2→6H7/2, 4G5/2→6H9/2, and 4G5/2→6H11/2 transitions, respectively [Citation23]. Among these, the 646-nm (4G5/2→6H9/2) peak showed the maximum intensity. All these transitions obey the selection rule ΔJ = ±1 [Citation24]. The major part of the 4G5/2→6H5/2 transition is considered a magnetic-dipole (MD) allowed transition, and the 4G5/2→6H7/2 transition is considered a partially magnetic dipole (MD) and partially electric dipole (ED) transition, whereas the 4G5/2→6H9/2 transition is a completely ED transition [Citation25]. The intensity ratio between the 646-nm (4G5/2→6H9/2) and 563-nm (4G5/2→6H5/2) regions is called R1, which can be used to measure the departure from the centrosymmetry of the sites occupied by the Sm3+ ions. Likewise, the intensity ratio between the 604-nm (4G5/2→6H7/2) and 563-nm (4G5/2→6H5/2) regions is denoted as R2, which can be used to indicate the polarizability of the chemical environment around the Sm3+ ion. The calculated R1 and R2 values are tabulated in Tables ST1 and ST2, and the R1 and R2 values are greater than 1. These values indicate that the Sm3+ ion occupied the low-symmetry center in the host lattice [Citation26].
3.5. Concentration quenching studies
Figures and show the emission intensity of the Sm3+-activated Li3BaSrLn3(MoO4)8 [(a) Ln = La, (b) Gd, and (c) Y] and Li3BaSrLn3(WO4)8 [(a) Ln = La, (b) Gd, and (c) Y] phosphors versus the Sm3+ concentration, respectively. The optimal concentration quenching study is important for evaluating the luminescent nature of the phosphor. The optimum concentration of the Sm3+ ion in the Li3BaSrLn3(MoO4)8 lattice was found to have been x = 0.1, 0.05, and 0.1 for the La, Gd, and Y host lattices, respectively. Similarly, the optimum concentration of the Sm3+ ion in the Li3BaSrLn3(WO4)8 lattice was found to have been x = 0.1, 0.3, and 0.1 for the La, Gd, and Y host lattices, respectively. When the Sm3+ ion concentration increased, the emission intensity also increased until it reached optimum concentration. Afterwards, the emission intensity started decreasing with the addition of the Sm3+ ion in the host lattices. This phenomenon is called ‘concentration quenching,’ which mainly arises due to the cross-relaxation process among the Sm3+ ions. In the Li3BaSrLn3(MoO4)8 lattice, the Y3+ host lattice showed a higher emission intensity than the other lattices (Figure d). Likewise, the Gd3+-based host lattice exhibited greater emission than the other lattices in the Li3BaSrLn3(MoO4)8 lattice (Figure d).
Figure 9. PL emission intensity of the 4G5/2→6H9/2 transition of the Li3BaSrLn3(MoO4)8:Sm3+ [Ln = (a) La, (b) Gd, and (c) Y] phosphor; and (d) overall emission intensity of the Sm3+-doped Li3BaSrLn3(MoO4)8 (Ln = La, Gd, and Y) phosphor.
![Figure 9. PL emission intensity of the 4G5/2→6H9/2 transition of the Li3BaSrLn3(MoO4)8:Sm3+ [Ln = (a) La, (b) Gd, and (c) Y] phosphor; and (d) overall emission intensity of the Sm3+-doped Li3BaSrLn3(MoO4)8 (Ln = La, Gd, and Y) phosphor.](/cms/asset/76abe241-fdf6-4401-8fc2-b058176fa2ad/tjid_a_1831630_f0009_oc.jpg)
Figure 10. PL emission intensity of the 4G5/2→6H9/2 transition of the Li3BaSrLn3(WO4)8:Sm3+ [Ln = (a) La, (b) Gd, and (c) Y] phosphor; and (d) overall emission intensity of the Sm3+-doped Li3BaSrLn3(WO4)8 (Ln = La, Gd, and Y) phosphor.
![Figure 10. PL emission intensity of the 4G5/2→6H9/2 transition of the Li3BaSrLn3(WO4)8:Sm3+ [Ln = (a) La, (b) Gd, and (c) Y] phosphor; and (d) overall emission intensity of the Sm3+-doped Li3BaSrLn3(WO4)8 (Ln = La, Gd, and Y) phosphor.](/cms/asset/acc032f4-5303-4a20-b6db-fb105137de46/tjid_a_1831630_f0010_oc.jpg)
Furthermore, the concentration quenching process can be well explained by finding the critical distance (Rc) between the adjacent Sm3+ ions, which was derived by Blasse. The Rc energy transfer can be determined from the critical concentration of the activator ion. Rc was calculated as follows [Citation27].
(1)
(1) Here, Rc refers to the critical distance, N corresponds to the number of available cationic sites in the host lattice, V is the volume of the unit cell, and Xc is the critical concentration of the Sm3+ ions. In this present Li3BaSrLn3(MoO4)8 lattice, the number available cation (N) = 6, the unit cell volume (V) = 1280.373 Å3, and the critical concentration quenching (Xc) values were 0.1, 0.05, and 0.1 for the La, Gd, and Y host lattices, respectively. The Rc of both the La and Y host lattices was 15.973 Å, and that of the Gd host lattice was 20.125 Å. The Li3BaSrLn3(WO4)8 host lattice had the same N (6) and V (1280.373 Å3). The Xc values were 0.1, 0.3, and 0.1 for the La, Gd, and Y host lattices, respectively; of the La and Y host lattices, 15.973 Å; and of the Gd host lattice, 11.075 Å. The determined Rc values were greater than 5 Å, which clearly shows that the multipolar interaction was highly responsible for the concentration quenching.
The multipolar interaction was further analyzed with the Dexter theory [Citation28]. Through the relationship of the emission intensity (I) with the Sm3+ ion concentration, the interaction mechanism was determined as follows.
(2)
(2)
(3)
(3) In the above equations, γ represents the intrinsic transition probability of the senzitizer; A and X0 are contants; Γ(1 + s/d) is a Γ function; and s refers to the index for the electric multipole, the electric dipole – dipole (D – D), the electric dipole – quadrupole (D – Q), and the electric quadrupole – quadrupole (Q – Q) interaction when s = 6, 8, and 10, respectively. If s = 3, the interaction was an exchange interaction. d relates to the dimension of the sample. Here, d = 3, so the energy transfer that arose among the Sm3+ ions inside the particles is considered. From Equations 2 and 3, it can be modified as:
(4)
(4) where C and f are the concentration of the Sm3+ ion and the independent of the doping concentration, respectively. Figure shows the linear relationship between the log C and log (I/C) values of the Li3BaSrLn3(MO4)8:Sm3+ [Ln = La, Gd and Y; M = Mo (LHS) and W (RHS)] phosphors. The obtained slope values (-s/d) of all the phosphors are close to 1. The s value was estimated from the slope as 3. Thus, the energy transfer arose between the activator (Sm3+) ions in the Li3BaSrLn3(MO4)8:Sm3+ [Ln = La, Gd and Y; M = Mo and W] lattice, which prevailed through the predominant exchange interaction mechanism.
Figure 11. Relationship between log C and log (I/C) for the Li3BaSrLn3(MO4)8:Sm3+ [Ln = La, Gd, and Y; M = Mo (LHS) and W (RHS)] phosphors.
![Figure 11. Relationship between log C and log (I/C) for the Li3BaSrLn3(MO4)8:Sm3+ [Ln = La, Gd, and Y; M = Mo (LHS) and W (RHS)] phosphors.](/cms/asset/45b66478-b7bc-4662-b667-4967bae42124/tjid_a_1831630_f0011_oc.jpg)
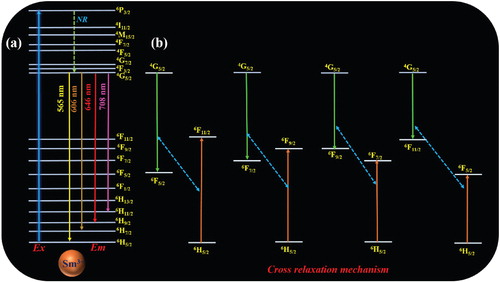
The preceding discussion revealed that the dipole–dipole interaction was responsible for the crossover relaxation between the Sm3+ ions. Figure shows the schematic energy level diagram and crossover relaxation mechanism of the Sm3+ ion. Upon 406-nm excitation, the Sm3+ ions were excited from the ground state (6H5/2) to the highest excited state (4K11/2), and the energy level difference between the ground state (6H5/2) of the Sm3+ ion and the other excited states was significant. According to Kasha's rule, electronic vibrational relaxation arises among the excited levels, and then fast non-radiative (NR) decay occurs via the crossover relaxation process (Figure b). Afterwards, the excited electrons come back from the first excited state to the 4G5/2 to 6H5/2 (565 nm), 6H7/2 (606 nm), 6H9/2 (646 nm), and 6H11/2 (708 nm) ground states, as shown in Figure a [Citation29,Citation30].
Figure 12. (a) Energy level diagram, and (b) cross-relaxation mechanism of the Sm3+ ion in the Li3BaSrLn3(MO4)8 lattice.
3.6. Energy transfer study
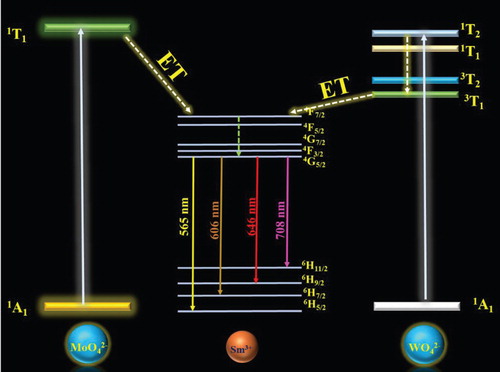
Figure shows the schematic energy transfer diagram of the MoO42– to Sm3+ ions in the molybdate host lattice. Initially, upon excitation, the MoO4 group absorbed energy and was excited from the 1A1 ground sate to the 1T1 excited state, and subsequently transferred the energy to the highest excited state of the Sm3+ ion non-radiatively. Similarly, the WO4 group participated in the energy transfer process, when the electron from the WO4 was excited from the 1A1 ground sate to the highest excited state 1T2. The excited electrons fell to the first excited state (3T1) through a non-radiative process. Afterwards, the energy was transferred to the highest excited level of the Sm3+ ion. Simultaneously, the transferred energy dropped from the highest excited state to the first excited state of 4G5/2. As a final point, the emission arose from the 4G5/2 level to the 6HJ (J = 5/2, 7/2, 9/2 and 11/2) level [Citation31].
Figure 13. Schematic diagram of the energy transfer from MoO42– to the Sm3+ ion.
3.7. Decay curve analysis
Figures and show the decay curve profiles of the Sm3+-activated Li3BaSrLn3(MoO4)8 (Ln = La, Gd and Y) and Li3BaSrLn3(WO4)8 (Ln = La, Gd and Y) phosphors, respectively. The decay curve analysis was monitored under the excitation at 406 nm and the emission at 646 nm. All the decay curves of all the phosphors fit well with the single exponential function. The single exponential fitting indicates the presence of only one emissive center in the present lattice. The equation is , where I and I0 represent the emission intensities at t and t = 0, respectively, and τ signifies the lifetime. The calculated lifetime values are given in RHS in Figures and , and the lifetime values of all the phosphors are shown in the millisecond (ms) range. When the concentration of Sm3+ in the Li3BaSrLn3(MO4)8 [M = Mo and W] lattice was increased, the lifetime values gradually decreased because of the rapid energy transfer between the Sm3+ ions in the host lattices as the distance between the Sm3+ ions decreased [Citation32,Citation33].
Figure 14. Decay curve of the Sm3+-activated Li3BaSrLn3(MoO4)8 [Ln = (a) La, (c) Gd, and (e) Y] phosphor; and (b, d, and f) lifetime values of all the phosphors.
![Figure 14. Decay curve of the Sm3+-activated Li3BaSrLn3(MoO4)8 [Ln = (a) La, (c) Gd, and (e) Y] phosphor; and (b, d, and f) lifetime values of all the phosphors.](/cms/asset/974a7110-4eff-4e77-b42b-0d422dcfc2fd/tjid_a_1831630_f0014_oc.jpg)
Figure 15. Decay curve of the Sm3+-activated Li3BaSrLn3(WO4)8 [Ln = (a) La, (c) Gd, and (e) Y] phosphor; and (b, d, and f) lifetime values of all the phosphors.
![Figure 15. Decay curve of the Sm3+-activated Li3BaSrLn3(WO4)8 [Ln = (a) La, (c) Gd, and (e) Y] phosphor; and (b, d, and f) lifetime values of all the phosphors.](/cms/asset/8e036cc8-ecf9-4b67-8e61-8340adb39d35/tjid_a_1831630_f0015_oc.jpg)
3.8. Temperature-dependent PL
The temperature-dependent PL emission of the Sm3+-activated Li3BaSrLn3(MoO4)8 (Ln = La, Gd, and Y) and Li3BaSrLn3(WO4)8 (Ln = La, Gd, and Y) phosphors are shown in Figures and (LHS), respectively. The temperature-dependent PL emission is one of the crucial analyses to demonstrate the practical application of the synthesized phosphor. The temperature-dependent emissions of all the Sm3+-activated phosphors were monitored under 406 nm. Figure shows the intensity variations based on the temperature, and the gradual decrease in the emission intensity with increasing temperature, due to the thermal quenching effect. The optimized phosphor compositions showed excellent thermal stability at 423K, which was retained at 72.28%. This higher value of the thermal stability shows that the synthesized phosphors can be effective contenders in white LED fabrication. In comparison, the Li3BaSrGd3(WO4)8:0.3Sm3+ phosphor showed excellent thermal stability (84.72%) compared to the other compositions. Also, the energy of activation (Ea) was evaluated for all the phosphors according to the Arrhenius equation, which is shown below.
(7)
(7) Here, I0 refers to the PL emission initial intensity of the phosphor at room temperature, I(T) corresponds to the PL intensity at various temperatures, c describes a constant for the host, ΔEa signifies the activation energy for thermal quenching, and k represents the Boltzmann constant at eVK−1. After specific rearrangements, Equation 7 can be altered as follows.
(8)
(8) Ea was calculated from the plot of ln[(I0/I) – 1] vs. 1/kT and obtained from the slope. The Arrhenius plot and the calculated respective Ea values are mentioned in their respective RHS in Figures 6.15 and 6.16. The determined Ea values are much higher than those of the other Sm3+-actived phosphors such as La6Ba4Si6O24F2:0.01Sm3+ (0.16 eV) [Citation34] Ba3Lu(PO4)3:0.05Sm3+ (0.142 eV) [Citation35] KLaSr3(PO4)3F:0.03Sm3+ (0.163 eV) [Citation36] Na3GdP2O8:0.03Sm3+ (0.20 eV) [Citation37]. This outstanding result suggests that the synthesized phosphors can be a promising red-emitting component of the white LED application.
Figure 16. Temperature-dependent PLs of the Sm3+-activated Li3BaSrLn3(MoO4)8 phosphors [Ln = (a) La, (c) Gd, and (e) Y] and Arrhenius plot of the Li3BaSrLn3(MoO4)8 phosphors [Ln = (b) La, (d) Gd, and (f) Y].
![Figure 16. Temperature-dependent PLs of the Sm3+-activated Li3BaSrLn3(MoO4)8 phosphors [Ln = (a) La, (c) Gd, and (e) Y] and Arrhenius plot of the Li3BaSrLn3(MoO4)8 phosphors [Ln = (b) La, (d) Gd, and (f) Y].](/cms/asset/3cedd39c-3a03-4ad1-b63f-d490e949d58b/tjid_a_1831630_f0016_oc.jpg)
Figure 17. Temperature-dependent PLs of the Sm3+-activated Li3BaSrLn3(WO4)8 phosphors [Ln = (a) La, (c) Gd, and (e) Y]; and Arrhenius plot of the Li3BaSrLn3(WO4)8 phosphors [Ln = (b) La, (d) Gd, and (f) Y].
![Figure 17. Temperature-dependent PLs of the Sm3+-activated Li3BaSrLn3(WO4)8 phosphors [Ln = (a) La, (c) Gd, and (e) Y]; and Arrhenius plot of the Li3BaSrLn3(WO4)8 phosphors [Ln = (b) La, (d) Gd, and (f) Y].](/cms/asset/47e9c735-76d7-419d-b479-b7f2ef3fbc81/tjid_a_1831630_f0017_oc.jpg)
Figure 18. Normalized intensity variations of the Li3BaSrLn3(MO4)8 [Ln = La, Gd, and Y; M = (a) Mo and (b) W] phosphors at different temperatures.
![Figure 18. Normalized intensity variations of the Li3BaSrLn3(MO4)8 [Ln = La, Gd, and Y; M = (a) Mo and (b) W] phosphors at different temperatures.](/cms/asset/ecf9f29d-09ca-4b3e-8b0c-1bd3f6a263d2/tjid_a_1831630_f0018_oc.jpg)
3.9. CIE color coordinates and internal quantum efficiency (IQE)
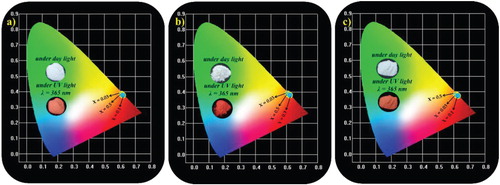
CIE is an essential parameter to identify the exact emission color of a synthesized phosphor. Figures and show the CIE chromaticity coordinates of the Sm3+-activated Li3BaSrLn3(MoO4)8 [Ln = (a) La, (b) Gd, and (c) Y] and Li3BaSrLn3(WO4)8 [Ln = (a) La, (b) Gd, and (c) Y] phosphors, which were calculated from the PL emission spectra under the 406-nm excitation. All the synthesized phosphors showed a red-orange emission with excellent CIE chromaticity coordinates. The CIE chromaticity coordinates of the Li3BaSrLn3(MoO4)8:Sm3+ phosphors were (0.623, 0.375), (0.623, 0.375), and (0.622, 0.375) for the Y, Gd, and La host lattices, respectively; and the CIE chromaticity coordinates of the Li3BaSrLn3(WO4)8:Sm3+ phosphors were (0.616, 0.381), (0.617, 0.381), and (0.616, 0.382) for the Y, Gd, and La host lattices, respectively. All these CIE values of the Li3BaSrLn3(MoO4)8:Sm3+ are close to the CIE chromaticity coordinates of the commercial Y2O3 red phosphor(0.644, 0.357).
Figure 19. CIE images of the Sm3+-activated Li3BaSrLn3(MoO4)8:Sm3+ (Ln = La, Gd, and Y) red-orange phosphors.
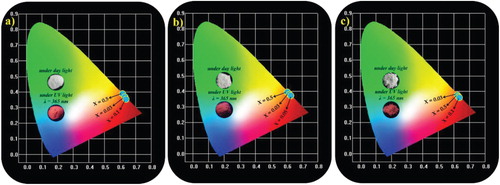
Figure 20. CIE images of the Sm3+-activated Li3BaSrLn3(WO4)8:Sm3+ (Ln = La, Gd, and Y) red-orange phosphors.
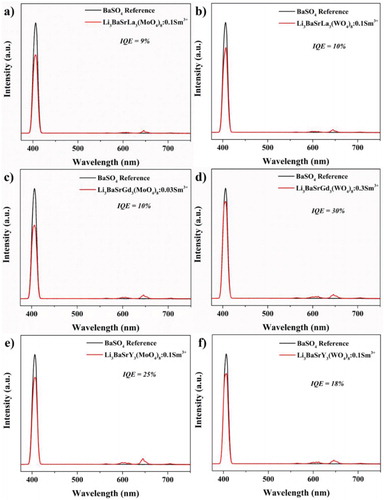
The internal quantum efficiency (IQE) was determined for the optimized composition of the Sm3+-activated Li3BaSrLn3(MO4)8 (Ln = La, Gd, and Y; M = Mo and W) phosphors, which were monitored under 406 nm. The IQE was calculated according to the following equation.
(7)
(7) In the above equation, η denotes the IQE; LS corresponds to the emission spectrum of the synthesized red phosphor; and ER and ES are the excitation lights without and with the existence of the deep red phosphors, respectively. The calculated IQE is mentioned in Figure , and all the phosphors show a greater IQE than the other reported Sm3+-activated phosphors such as NaKLa0.97Sm0.03NbO5 (8.5%) [Citation13], Bi0.97Sm0.03OCl (2.12%) [Citation38], and NaLa0.98Sm0.02MgWO6 (11.9%) [Citation39]. These outcomes show that the Sm3+-doped Li3BaSrLn3(MO4)8 phosphor can be a potential red-emitting phosphor for WLED application.
Figure 21. IQE measurement for the optimized composition of the Sm3+-activated Li3BaSrLn3(MO4)8 (Ln = La, Gd, and Y; M = Mo and W) phosphors.
3.10. LED fabrication and plant growth study
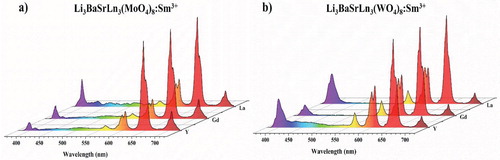
To assess the commercial application of the synthesized Sm3+-activated Li3BaSrLn3(MO4)8 [Ln = La, Gd, and Y; M = Mo and W] phosphors, the red-orange LEDs were fabricated for the synthesized phosphors with the combination of the nUV and LED chips. Figure shows the LED emission spectrum of the fabricated deep red LEDs. All the LEDs show a red-orange emission in the spectrum, and the Sm3+ ion emission dominates the nUV-LED emission. With these results, it can be concluded that the synthesized phosphor can be a potential red-orange emitting component of WLED fabrication.
Figure 22. LED emission spectrum of the fabricated red-orange-emitting LED device from the combination of InGaN LED with the (a) Li3BaSrLn3(MoO4)8:Sm3+ (Ln = La, Gd, and Y) and (b) Li3BaSrLn3(WO4)8:Sm3+ (Ln = La, Gd, and Y) phosphors.
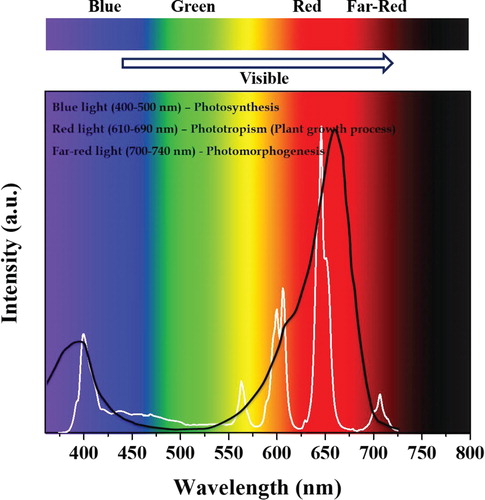
To prove the efficiency of the fabricated LEDs for plant growth application, the LED emission spectrum (Li3BaSrY3(WO4)8:Sm3+) was compared with the absorption spectrum of the phytochrome Pr (Figure ). The phytochrome Pr is an essential photoreceptor for plant growth application. The LED emission spectrum consists of two dominant emissions at around 394 nm, which belongs to the n-UV LED emission, and the other peaks at 580, 604, 646, and 704 nm correspond to the emission of the Sm3+ ion. The emission at 646 nm is higher than the other emissions in the spectrum, which is highly attractive in covering the full range of the phytochrome Pr absorption spectrum. Likewise, the absorption spectrum of phytochrome Pr contains two emissions in the n-UV and red regions. The n-UV LED emission of the fabricated LED was well-matched with the n-UV region absorption of phytochrome Pr, and the rest of the Sm3+ emissions precisely overlapped with the red region absorption band of phytochrome Pr. These excellent outputs indicate that the presently synthesized phosphors could be applicable in plant growth LED applications.
Figure 23. LED emission spectrum of the fabricated LED (Li3BaSrY3(WO4)8:Sm3+) and absorption of phytochrome Pr.
4. Conclusion
A series of Sm3+-activated Li3BaSrLn3(MO4)8 (Ln = La, Gd, and Y; M = Mo and W) deep red emitting phosphors was synthesized, and their optical properties were systematically studied. The PL emission revealed that all the phosphors showed intense red emissions at 646 nm due to the 4G5/2 → 6H9/2 transition. The energy transfer mechanism was also studied systematically. Temperature-dependent PL emission and IQE were performed to analyze the practical application of the synthesized phosphor, and the optimized phosphor compositions exhibited the highest thermal stability and IQE. The deep red LEDs were fabricated by combining the optimized red phosphors with n-UV LED, and all the LEDs showed intense red emissions at 646 nm. The fabricated deep red LED emission spectrum matched well the absorption spectrum of phytochrome Pr. These results show that the studied phosphor can be a potential red component of white LEDs, and a resource for plant growth application.
Disclosure statement
No potential conflict of interest was reported by the author(s).
Additional information
Notes on contributors

Marikumar Rajendran
Marikumar Rajendran received his M.Sc., and M.Phil. from the Manonmaniam Sundaranar University, Tirunelveli, India. He is pursuing a PhD under the supervision of Prof. Sivakumar at Department of Chemistry, National Institute of Technology, Rourkela, India. His research direction is the design and synthesis of Lanthanide activated oxide based phosphor materials and molecular complexes for white LEDs and plant growth applications.

Kasturi Singh
Dr. Kasturi Singh received her PhD and Master’s degrees in Chemistry from the Department of Chemistry, National Institute of Technology, Rourkela, India. Her research interest focused on Lanthanide activated phosphor materials and molecular complexes for solid state lighting applications. Currently she is working as a Research Associate at NIT Rourkela.

Sivakumar Vaidyanathan
Prof. Sivakumar Vaidyanathan received his Bachelor’s and Master’s degrees in Chemistry from Muthurangam Government Arts College, Vellore (affiliated to the University of Madras) and his PhD in Solid-State Chemistry (2007) from the Indian Institute of Technology, Madras, with Prof. U. V. Varadaraju. Then, he moved to Prof. Duk Young Jeon’s group at the Korea Advanced Institute of Science and Technology, Republic of Korea, as a Brain Korea 21 postdoctoral research fellow (2007–2009). He also worked as a postdoctoral fellow at the Commissariat a` l’Energie Atomique (CEA), Saclay, France, for a year. After spending a year in NIT Calicut as a faculty member in the Department of Chemistry, he moved to the Department of Chemistry at the National Institute of Technology Rourkela. His research focuses on lanthanide photochemistry and photophysics, molecular materials (including deep blue) for OLEDs, phosphors for LEDs (solid-state lighting), and organic fluorophores for diverse applications.
References
- W. Geng, X. Zhou, J. Ding, and Y. Wang, J. Am. Ceram. Soc 101, 4560–4571 (2018). doi: 10.1111/jace.15693
- P. Du, X. Huang, and J.S. Yu, Chem. Eng. J 337, 91–100 (2018). doi: 10.1016/j.cej.2017.12.063
- M. Zhao, H. Liao, L. Ning, Q. Zhang, Q. Liu, and Z. Xia, Adv. Mater 30, 1802489 (2018). doi: 10.1002/adma.201802489
- V. Bachmann, C. Ronda, and A. Meijerink, Chem. Mater 21, 2077–2084 (2009). doi: 10.1021/cm8030768
- B. Li, X. Huang, and J. Lin, J. Lumin 204, 410–418 (2018). doi: 10.1016/j.jlumin.2018.08.044
- H. Guo, L. Sun, J. Liang, B. Li, and X. Huang, J. Lumin 205, 115–121 (2019). doi: 10.1016/j.jlumin.2018.09.010
- C.-H. Huang, T.-S. Chan, W.-R. Liu, D.-Y. Wang, Y.-C. Chiu, Y.-T. Yeh, and T.-M. Chen, J. Mater. Chem 22, 20210–20216 (2012). doi: 10.1039/c2jm33160h
- C. Guo, L. Luan, C. Chen, D. Huang, and Q. Su, Mater. Lett 62, 600–602 (2008). doi: 10.1016/j.matlet.2007.06.016
- H. Peng, H. Song, B. Chen, J. Wang, S. Lu, X. Kong, and J. Zhang, J. Chem. Phys 118, 3277–3282 (2003). doi: 10.1063/1.1538181
- L. Yanhong, and H.J. Guangyan, Solid State Chem 178, 645–649 (2005). doi: 10.1016/j.jssc.2004.12.018
- A. Garbout, T. Turki, and M. Férid, J. Lumin 196, 326–336 (2018). doi: 10.1016/j.jlumin.2017.12.066
- M. Rajendran, and S.J. Vaidyanathan, Alloys Compd 789, 919–931 (2019). doi: 10.1016/j.jallcom.2019.03.141
- B. Han, B. Liu, Y. Dai, and J. Zhang, Mater. Res. Bull 121, 110612 (2020). doi: 10.1016/j.materresbull.2019.110612
- Y. Hua, and J.S. Yu, J. Alloys Compd 820, 153162 (2020). doi: 10.1016/j.jallcom.2019.153162
- I.E. Kolesnikov, E.V. Golyeva, M.A. Kurochkin, E.Y. Kolesnikov, and E. Lähderanta, J. Lumin 219, 116946 (2020). doi: 10.1016/j.jlumin.2019.116946
- K. Li, and R. Van Deun, Inorg. Chem 58, 6821–6831 (2019). doi: 10.1021/acs.inorgchem.9b00280
- K. Singh, and S. Vaidyanathan, Chemistry Select 1, 5448–5462 (2016).
- N. Zhou, P. Gao, Y. Yang, Y. Zhong, M. Xia, Y. Zhang, Y. Tian, X. Lu, and Z.J. Zhou, Taiwan Inst. Chem. Eng 104, 360–368 (2019). doi: 10.1016/j.jtice.2019.09.019
- R. Shannon, Acta Crystallogr. Sect. A 32, 751–767 (1976). doi: 10.1107/S0567739476001551
- M. Song, W. Zhou, M. Wu, and G. Wang, CrystEngComm 15, 168–174 (2013). doi: 10.1039/C2CE25671A
- K. Singh, and S. Vaidyanathan, ChemistrySelect 2, 5143–5156 (2017). doi: 10.1002/slct.201700644
- X. Wu, J. Zheng, Q. Ren, W. Bai, Y. Ren, and O. Hai, Polyhedron 164, 17–22 (2019). doi: 10.1016/j.poly.2019.02.031
- K. Thomas, D. Alexander, S. Sisira, L.A. Jacob, P.R. Biju, N.V. Unnikrishnan, M.A. Ittyachen, and C. Joseph, J. Lumin 211, 284–291 (2019). doi: 10.1016/j.jlumin.2019.03.045
- V. Rao Bandi, B.K. Grandhe, M. Jayasimhadri, K. Jang, H.-S. Lee, S.-S. Yi, and J.-H. Jeong, J. Cryst. Growth 326, 120–123 (2011). doi: 10.1016/j.jcrysgro.2011.01.075
- M. Fhoula, and M. Dammak, J. Lumin 210, 1–6 (2019). doi: 10.1016/j.jlumin.2019.01.058
- C. Tiseanu, B. Cojocaru, D. Avram, V.I. Parvulescu, A.V. Vela-Gonzalez, and M. Sanchez-Dominguez, J. Phys. D. Appl. Phys 46, 275302 (2013). doi: 10.1088/0022-3727/46/27/275302
- P. Chen, D. Yang, W. Hu, J. Zhang, and Y. Wu, Chem. Phys. Lett 689, 169–173 (2017). doi: 10.1016/j.cplett.2017.10.006
- D.L. Dexter, and J.H. Schulman, J. Chem. Phys 22, 1063–1070 (1954). doi: 10.1063/1.1740265
- Y.A. Tanko, M.R. Sahar, and S.K. Ghoshal, Results Phys 6, 7–11 (2016). doi: 10.1016/j.rinp.2015.12.001
- T.R. Raman, V.R. Prasad, A.V. Reddy, and Y.C. Ratnakaram, J. Lumin 217, 116814 (2020). doi: 10.1016/j.jlumin.2019.116814
- Y. Chen, J. Wang, C. Liu, X. Kuang, and Q. Su, Appl. Phys. Lett 98, 81917 (2011). doi: 10.1063/1.3557065
- S. Wang, Q. Sun, B. Devakumar, L. Sun, J. Liang, and X. Huang, RSC Adv 8, 30191–30200 (2018). doi: 10.1039/C8RA06134C
- J. Liang, L. Sun, G. Annadurai, B. Devakumar, S. Wang, Q. Sun, J. Qiao, H. Guo, B. Li, and X. Huang, RSC Adv 8, 32111–32118 (2018). doi: 10.1039/C8RA06129G
- J.-C. Chang, C.-T. Chen, M. Rudysh, M.G. Brik, M. Piasecki, and W.-R. Liu, J. Lumin 206, 417–425 (2019). doi: 10.1016/j.jlumin.2018.10.031
- Z. Yang, D. Xu, and J. Sun, Opt. Express 25, A391–A401 (2017). doi: 10.1364/OE.25.00A391
- Q. Guo, C. Zhao, L. Liao, S. Lis, H. Liu, L. Mei, and Z. Jiang, J. Am. Ceram. Soc 100, 2221–2231 (2017). doi: 10.1111/jace.14751
- M. Xie, X. Min, Z. Huang, Y. Liu, X. Wu, and M. Fang, Chem. Phys. Lett 710, 84–89 (2018). doi: 10.1016/j.cplett.2018.08.080
- P. Halappa, H.M. Rajashekar, and C. Shivakumara, J. Alloys Compd 785, 169–177 (2019). doi: 10.1016/j.jallcom.2019.01.155
- B. Han, Y. Dai, J. Zhang, B. Liu, and H. Shi, Ceram. Int 44, 3734–3740 (2018). doi: 10.1016/j.ceramint.2017.11.154