
 ?Mathematical formulae have been encoded as MathML and are displayed in this HTML version using MathJax in order to improve their display. Uncheck the box to turn MathJax off. This feature requires Javascript. Click on a formula to zoom.
Abstract
We report the heat diffusion on flexible active-matrix organic light-emitting diode (AMOLED) displays. Two-dimensional heat diffusion is used for the heat conduction and convection analysis, generated on the surface of a flexible AMOLED display. The heat diffusion parameters and the time constant are studied in terms of the driving conditions of a 6-inch flexible AMOLED display. The temperature distribution on the screen is obtained by applying heat diffusion using the finite difference method (FDM) with an FPGA driving board. We can predict temperature more precisely by calculating temperature changes according to the images. The proposed method improves the accuracy of predicting the temperature. The average and standard deviation of the temperature error (TER) are ∼0.5°C and ∼0.5°C for the proposed method, respectively. For the conventional method, the values are ∼4.5°C and ∼0.7°C, respectively, neglecting the increase in temperature based on the images. This method can be used in compensation technology for OLEDs and thin film transistors (TFTs) that require accurate temperature distribution on the screen.
1. Introduction
Flexible active-matrix organic light-emitting diode (AMOLED) displays offer various benefits such as pure black, fast response, wide viewing angle, rich color and flexibility [Citation1]. However, unlike liquid crystal display (LCD), it is difficult to avoid the burn-in phenomenon because of the short lifetime of AMOLED displays [Citation2]. The burn-in behavior is a key issue in AMOLED displays, especially in blue OLEDs. Note that the red and green OLEDs with phosphorescence materials have a relatively long lifetime [Citation3]. In addition, out-coupling technology has been developed to reduce current density by extracting the light dissipating inside AMOLED displays [Citation4,Citation5].
The OLED degradation can be compensated by correcting input data using the data driver IC for OLED driving [Citation6]. By sensing the TFTs and OLEDs performances periodically, OLED degradation can be compensated at a pixel level [Citation6]. In this case, the number of data lines is too many and the same number of ADC (analog to digital converter) is needed for sensing. This can be used for OLED TVs, but it is difficult to apply it to mobile products that are sensitive to electronic components and power consumption [Citation7].
Therefore, the prediction of OLED degradation without sensing the currents can be possible using accumulated data in mobile products. It is necessary to store the data for the current density and temperature that affect the OLED lifetime [Citation8]. The current density of a pixel can be decided from the data based on input images. However, the temperature of a flexible AMOLED display is affected by various factors such as environmental temperature, heat from electronic components, and driving images. These influences should be reflected in storing data. Note that the environmental temperature can be easily obtained by the sensors built into the product. Note also that the temperature increase due to heating of the component and wire resistance can be checked through preliminary evaluations. The images could be affected by the current flow through the thin film transistors (TFTs) and OLEDs. Therefore, the temperature on the surface of an AMOLED display needs to be predicted.
In this paper, the surface temperature is studied considering the images using the heat diffusion equation in a flexible AMOLED display. The two-dimensional equation for the surface temperature is obtained to determine the heat conduction and convection on the surface of a flexible AMOLED display. The heat diffusion parameters and the time constant required for utilizing the equation are extracted according to the driving conditions of the AMOLED display. The temperature distribution is predicted by applying the heat diffusion to the finite difference method (FDM) using FPGA (field programmable gate array) driving board. Note that FDM is widely used to analyze heat diffusion because it is used to solve differential equations that are included in the heat diffusion equation [Citation9,Citation10]. Compared to the conventional method that does not consider the change in temperature by images, the proposed method can predict a more accurate temperature on the display surface. This method can be used for the compensation algorithms for OLEDs and TFTs that need accurate temperature in a pixel.
2. Fabrication and equipment
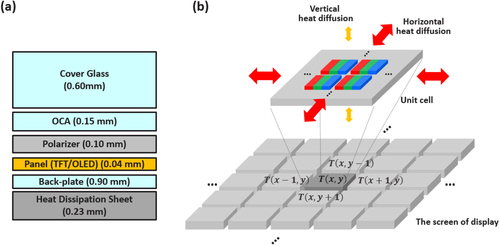
We fabricated a 6-inch flexible AMOLED display using low-temperature poly-Si oxide (LTPO) TFT on a polyimide (PI) substrate with the 7 TFTs and 1 capacitance (7T1C) pixel architecture with the conventional RGB structure [Citation11,Citation12]. The AMOLED display resolution is 1228 × 2700, and the OLED efficiencies of red, green, and blue are ∼49, ∼150, and ∼8 cd/A, and the sub-pixel currents of red, green, and blue are ∼24, ∼25, and ∼53 nA at 650 nits, respectively. The cross-sectional view is shown in Figure (a), consisting of cover glass, acrylic OCA, polarizer, AMOLED panel, back-plate, and heat dissipation sheet, a 0.23 mm thick composite material containing copper to enhance the heat diffusion. Thermal imaging camera FLIR ONE PRO was used to measure the surface temperature distribution. When monitoring the temperature at a specific location for a long time, GRAPHITEC’s midi LOGGER GL800, a contact-type thermometer, was used. The FPGA (Xilinx Kintex-7) was used to count and store input data and perform FDM calculations. Figure (b) shows a unit cell where a cluster of pixels array has TFTs and OLEDs in FDM calculation. Note that on the surface of a flexible AMOLED display, heat diffuses horizontally by conduction and vertically by convection, and the influence of convection in contact with air is much smaller than that of conduction. The accuracy of calculation can be improved by decreasing the unit cell size for calculating FDM, but the hardware burden will increase. Therefore, an appropriate unit cell area should be selected.
Figure 1. (a) Cross-sectional view of a 6-inch flexible AMOLED display. (b) Heat diffusion concept in AMOLED panel with unit cell on top. Here, T refers to temperature and x, y represent the position of the unit cell. Note that a cluster of pixel array has TFTs and OLEDs, which is used for FDM calculation. Note that on the surface of the flexible AMOLED display, heat diffuses horizontally by conduction and vertically by convection, and the influence of convection in contact with air is much smaller than that of conduction.
3. Results and discussion
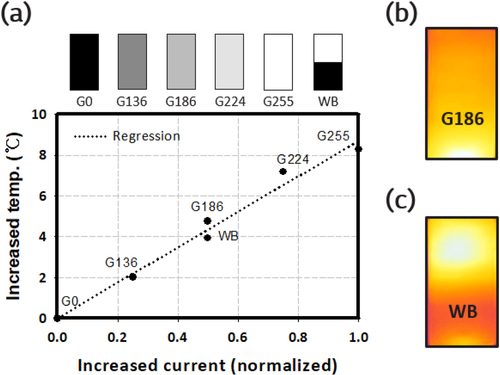
Figure (a) shows the relationship between the changes in average temperature and normalized current increase compared to black (G0) image when driving 650 nits in a 6-inch flexible AMOLED display. It is noted that the average temperature difference between G0 and white (G255) is ∼8°C. In addition, the increase in the average temperature in the case of G186 and WB images is similar since the current increase is almost the same. However, the temperature distribution is significantly different as shown in Figure (b,c): Figure (b) shows better uniformity compared to Figure (c). Note that the bright parts show high temperatures while the dark ones show relatively low temperatures. Note also that the bottom area of the display has a relatively higher temperature due to the heat from the driver IC regardless of input image. This can be ignored because all driving images have the same influence. Figure (c) shows a large temperature difference between the upper region (G255) and the lower region (G0). Unlike the input image, the interface between the upper and the lower regions shows a gradual change due to heat diffusion. Therefore, heat diffusion should be considered in predicting the temperature. The previous image can also affect the temperature. Therefore, to predict temperature accurately, heat diffusion and temperature change over time should be considered.
Figure 2. (a) Relationship between the increase in average temperature and normalized current increase compared to G0 image according to various input images in 6-inch flexible AMOLED display. Photograph of the measured temperature distribution during OLED driving with (b) G186 all over the panel and (c) top white and bottom black (WB) image. Note that in Figure (a,b), the bright parts show high temperature and the dark parts show relatively low temperature. The temperature in the bottom region of the display is relatively higher due to the impact of the driver IC.
In this paper, the heat diffusion equation is used for the diffusion over the pixels and time. Using the energy conservation law, Equation (1) can be written by subtracting the output energy () from the input energy (
) and adding the generated energy (
) equals to the storage energy (
) [Citation13]:
(1)
(1)
Assuming a two-dimensional AMOLED display, the energy conservation law is modified as follows. On the surface of the flexible AMOLED display, heat diffusion takes place horizontally by conduction and vertically by convection. In an arbitrary area with circumference
, adding an input heat for
is equal to the heat increase for the area
. The heat diffusion equation can be expressed as Equation (2) [Citation13]:
(2)
(2) where
is the temperature [°C],
is the environmental temperature [°C],
is the thermal conductivity [
],
is the convection heat transfer coefficient [
] defined in 3-dimension instead of two-dimension in order to adapt it in the flat-type display.
is the rate of energy generation per unit volume [
],
is the mass density [
],
is the specific heat [
],
is the differential area, and
is the vertical heat differential. The environmental temperature
is set to 0 to easily define the increase in temperature. The
is converged to 0, so the right term is converted into an integral form over time. Using the relationship between the rate of energy generation per unit volume and temperature, the equation can be changed as follows [Citation13,Citation14]:
(3)
(3) where x and y represent coordinates,
and
are redefined as
and
using the relationship between the rate of energy generation per unit volume and temperature. This form makes heat diffusion analysis easy because the temperature is a more convenient value for display engineering. In other words, the physical values such as weight, specific heat, mass density, etc. of each component of the AMOLED display do not need to be considered.
Temperature increase from driving images can be defined using display current, which can be calculated using the relationship between the OLED efficiencies of red, green, and blue and input data for each sub-pixel [Citation8]. The relationship between the display current and the temperature increase used in this paper is shown in Figure (a). It can be expressed by the following equation,
, where
is the average current increase compared to that of the driving G0 image.
To calculate the temperature using this equation, it is necessary to extract parameters (,
,
) suitable for the display evaluation. As described in Figure (a), a flexible AMOLED display consists of various components. The general method is to use parameters suitable for each component. However, this approach increases the inaccuracy due to the complexity of integrating the influence of each component. In this paper, we introduce a simple method to have integrated parameters suitable for a flexible AMOLED display.
To obtain horizontal and vertical diffusion parameters and
, the steady state condition was used without time dependence. Then, Equation (3) can be expressed as Equation (4) below [Citation13]:
(4)
(4)
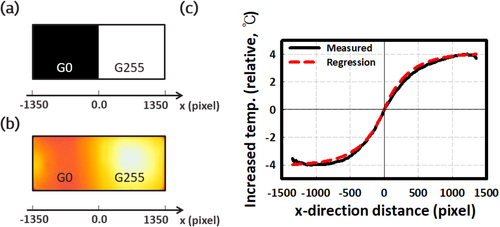
When the image shown in Figure (a) is driven in flexible AMOLED, heat diffusion takes place with no change over time. The heat diffusion takes place only in the -axis when G0 and G255 are respectively arranged on both half sides of the display. When Figure (a) image is driven in the flexible AMOLED display, Figure (b) shows the photograph of temperature distribution and Figure (c) shows the measured result and its regression of temperature distribution according to the
-axis. Note that the temperature increase is zero at
= 0. From comparing the regression curve of temperature distribution and the solution of Equation (4), we can find
and
regarding the AMOLED display. In this work,
is 1.056 and
is 120,915
, where
represents one pixel length. The
has no unit, the unit of
is
and pixel size can be achieved with pixel length
[Citation14].
Figure 3. (a) Evaluation image for extracting heat diffusion parameters (,
). (b) Photograph of measured temperature distribution when driving (a) image. (c) Measured and regression graph of temperature distribution as a function of
in the display. Note that the regression curve with exponential form comes from the measured data to extract the diffusion parameters.
The time constant, indicating the degree of change over time, can be extracted using the temperature profile observed while transitioning from G0 to G255 image, as shown in Figure (a). In this case, it is possible to simplify the heat diffusion equation using a solid image that does not cause heat diffusion. The simple form removing the diffusion parameters is as follows [Citation13]:
(5)
(5)
Figure 4. (a) Evaluation images and driving sequence for extracting the time constant. (b) Photograph of a measured temperature distribution when driving (a) images and sequence. (c) Measurement results and the regression graph of temperature distribution as a function of time.
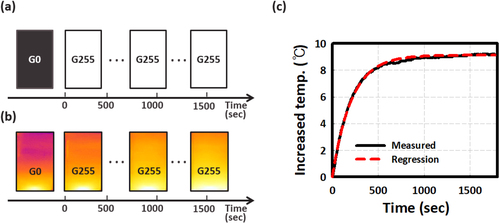
The measured temperature change over time when driving Figure (a) images and sequence is shown in Figure (b). Figure (c) shows the measured result and its regression curve of the temperature change. In the same way as the diffusion parameters, we can find that is 195 sec in this work [Citation14] from comparing the regression and the solution of Equation (5). Note that in Figure (b) the equilibrium time is relatively large. If images vary dynamically, it is difficult to properly reflect the temperature change when the images change. On the other hand, fixed images mainly used in mobile and IT applications are considered in this article to assess the temperature effect.
For FDM application, the heat diffusion equation (3) is modified using the Taylor series [Citation14]:
(6)
(6)
Here, represents the peripheral positions (up, down, left, and right) of the unit cell area when the flexible AMOLED display is divided as shown in Figure (b). The length (
) of unit cell is selected as 64 pixels to minimize the error and capacity of the FPGA used. The time interval (
) is selected as 1/100 level of the time constant to minimize the error in this work.
Figure (a–f) shows the comparison between the conventional and current method using the heat diffusion equation (6). Note that the conventional method does not take into account the changes according to driving images. The maximum brightness is 650 nits, and the evaluation is carried out at room temperature.
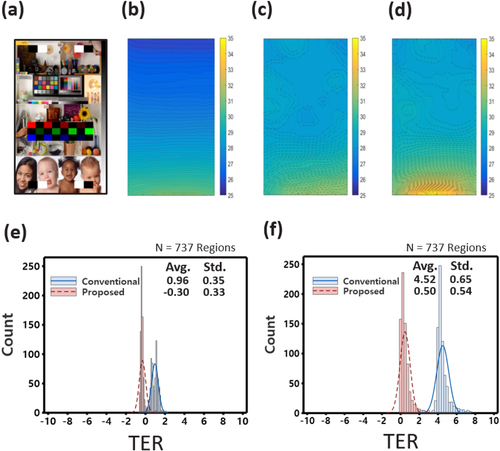
Figure 5. (a) Evaluation image. The simulated temperature profile for (b) the conventional method, (c) proposed method, and (d) the measured temperature profile, when driving 15 min after the transition from G0 to the evaluation image. Note that the scale bar shows the temperature. The temperature error, TER, is defined as the measured temperature minus the simulated temperature. The TER distribution between the conventional and the proposed method for (e) 1 min and (f) 15 min driving.
The temperature increase caused by electronic components and wire resistance is reflected in the display through pre-evaluation. In order to determine the difference in the driving time, the evaluations are conducted respectively for 1 and 15 min.
Figure (a) shows the driving image selected as a complex image so that various heat diffusions take place inside the image. Figure (b,c) shows the simulation result of the conventional method and the proposed method, respectively, while Figure (d) indicates the measured result for driving 15 min after the transition from G0 to the evaluation image. It can be seen that the simulation result in Figure (c) is consistent with the measured result in Figure (d). Note that the lower regions of Figure (b,c,d) are relatively brighter because of the driver IC at the bottom.
The simulation and measurement results are compared as follows. First, the screen of the flexible AMOLED display is equally divided into 737 regions. Note that a unit cell has 64 × 64 pixels and a whole screen has 737 regions. The difference between measurement and simulation for each region is defined as temperature error (TER, measured minus the simulated temperature).
Figure (e) shows the TER comparison between the conventional and proposed method for driving 1 min after the transition from G0 to the evaluation image. Note that 1 min driving is not enough time to reflect the temperature change. But the conventional method has an average TER of ∼1.0°C and standard deviation TER of ∼0.4°C. Since the conventional method does not consider the temperature effect of images, it can be seen that TER consists of all positive values and can be ∼2.0°C in bright areas. However, the proposed method has an average TER of ∼−0.3°C and a standard deviation TER of ∼0.3°C. It reflects the heat diffusion depending on the image. This lowers the TER average to the extent that a negative value is possible.
Figure (f) shows the TER comparison between the conventional and the proposed method when driving 15 min after the transition from G0 to the evaluation image. The conventional method has an average TER of ∼4.5°C and standard deviation TER of ∼0.7°C, but the proposed method yields average TER of ∼0.5°C and standard deviation TER of ∼0.5°C.
It can be seen that the average and standard deviation of TER increase when the driving time increases to 15 min compared to 1 min. For the conventional method, the driving time, temperature and TER also increase. The maximum TER is ∼8°C, which increases significantly compared to the average TER. In the proposed method, the time constant is reflected in the heat diffusion so that the temperature change over time can be considered, indicating that the TER is more accurate.
The proposed method can reflect the temperature change caused by heat diffusion and time variance according to the driving images. This can significantly improve the accuracy of temperature prediction. This method can be used in compensation technology for TFTs and OLEDs that require accurate temperature information.
4. Conclusion
We study the surface temperature of AMOLED displays in terms of driving images using heat diffusion. It is modified in two-dimension to reduce prediction errors caused by the complex AMOLED display structure. The heat diffusion parameters and the time constant required for utilizing the diffusion equation are extracted using the driving conditions of a 6-inch flexible AMOLED display. The parameters are extracted based on temperature for display engineering. To obtain horizontal and vertical diffusion parameters and
, the diffusion condition in the steady state is used without time dependence. In the case of time constant, no diffusion condition is used with a solid image that does not cause heat diffusion.
The temperature distribution is predicted by applying heat diffusion to FDM using the FPGA driving board. The average and standard deviation of TER are improved to ∼0.5°C and ∼0.5°C for the proposed method, while for the conventional method the values are ∼4.5°C and ∼0.7°C. The proposed method can reflect the temperature change according to driving images, which can significantly improve the temperature accuracy. This method can accurately predict the surface temperature of flexible AMOLED displays according to the images.
Disclosure statement
No potential conflict of interest was reported by the author(s).
Additional information
Funding
Notes on contributors

Chang Hoon Jeon
Chang Hoon Jeon received his B.S. and M.S. degrees in radio wave engineering at Hanyang University in South Korea in 1999 and 2001, respectively. He is now a candidate for a Ph.D. degree at the Department of Information Display of Kyung Hee University and is working as Research Fellow in LG Display Co., Ltd. His main research areas are driving and compensation technologies for AMOLED display.

Ji Woong Park
Ji Woong Park received his B.S. degree in electronic engineering from Yeungnam University in South Korea. He is currently researching the development of compensation algorithms for OLED displays in LG Display Co., Ltd.
Byung Wook Kang
Byung Wook Kang received his B.S. and M.S. degrees from the School of Electrical and Computer Engineering at the University of Seoul in South Korea in 2008 and 2011, respectively. He is currently working as Senior Engineer of display circuits in LG Display Co., Ltd. His main research areas involve compensation of AMOLED display performance degradation.

Su Hyuk Jang
Su Hyuk Jang received his B.S. and M.S. degrees in electronic engineering at Kyungbuk National University in South Korea in 2002 and 2004, respectively. His current research involves the development of compensation algorithm for OLED displays at LG Display Co., Ltd.
Kyung Joon Kwon
Kyung Joon Kwon received his B.S. degree in electrical engineering at Seoul National University (SNU) in South Korea in 1999, and his Ph.D. degree in electronic and electrical engineering in 2015 from Postech in South Korea, respectively. He is working for LG Display Co., Ltd. as Vice President.

Soon Kwang Hong
Soon Kwang Hong received his B.S. and M.S. degrees in electrical engineering from Kyungbuk National University in 1997 and 1999, and Ph.D. degree in information display engineering from Kyung Hee University in 2000. He is currently serving as Vice President at LG Display Co., Ltd. His research interests include AMOLEDs based on various TFT technologies and micro-LED displays.

Yong Min Ha
Yong Min Ha received his B.S. in EE at Seoul National University (SNU) in 1988, and M.S. and Ph.D. in EE at KAIST in 1990 and 1994, respectively. Since joining LG Display Co., Ltd. in 1994, he led the technology and product development of LTPS TFT-LCDs and AMOLEDs. Currently, he is directing various display technology developments such as for OLED TV, IT OLED, mobile OLED, micro LED, and micro OLED as the head of Precedence Technology Lab in LG Display Co., Ltd.
Jin Jang
Jin Jang (M’94) is a professor at the Department of Information Display of Kyung Hee University. His current research programs involve oxide and LTPS TFTs for displays, TFT circuits and TFT application to sensors, QLED, and flexible AMOLED. He developed the world’s first full-color TFT-LCD on plastic, flexible AMOLED, transparent AMOLED, and 3D AMLCD with wire-grid polarizers that were presented at the SID Conference. He is the author or co-author of over 1000 technical publications of which over 650 are in SCI Journals such as Nature, Advanced Materials, Advanced Functional Materials, Advanced Energy Materials, Energy Environmental Science, APL, IEEE TED, and IEEE EDL. He is currently a director of the Advanced Display Research Center (ADRC) and had served as Program Chair of SID Symposium 2007, General Chair of SID Display Week in 2009, and General Chair of IMID 2012 and 2013. He has bestowed the George Smith Award from IEEE in 2012 and Slotto Owaki Prize from SID in 2015.
References
- CH Oh, HJ Shin, WJ Nam, BC Ahn, SY Cha, and SD Yeo, Proc. SID Dig. Tech. Papers 44, 239 (2013).
- A. Laaperi, J. Soc. Info. Display 16, 1125 (2008).
- M. Hack, M. Lu, R. Kwong, J.J. Brown, A. Nichols, and T.N. Janson, J. Soc. Info. Display 11, 297 (2003).
- H.S. Kim, S.I. Moon, D.E. Hwang, K.W. Jeong, C.K. Kim, D.G. Moon, and C.S. Hong, Opt. Laser Technol. 77, 104 (2016).
- H.W. Chang, J.H. Lee, S. Hofmann, Y.H. Kim, L. Muller-Meskamp, B. Lussem, C.C. Wu, K. Leo, and M.C. Gather, J. Appl. Phys. 113, 204502 (2013).
- D. Antonio-Torres, P.F. Lister, and P. Newbury, J. Soc. Info. Display 13, 435 (2005).
- JW Kwon, CU Lee, YC Chae, and B Murmann, in Proceedings of the 2020 IEEE International Symposium on Circuits and Systems, 1 (2020).
- X. Jiang, and C. Xu, J. Soc. Inf. Display 29, 768 (2021).
- M. Raynaud, and J. Bransier, Numer. Heat Transf. 9, 27 (1986).
- G. Yan, H. Qingsong, Z. Chuanzeng, and H. Xiaoqiao, Appl. Math. Modell. 71, 316 (2019).
- UJ Chung, SC Choi, SY Noh, KT Kim, KJ Moon, JH Kim, KS Park, HC Choi, and IB Kang, SID Symp. Dig. Tech. Papers 51, 192 (2020).
- JC Kim, JS Yoo, HW Hwang, HC Choi, YM Ha, and HJ Kim, in 2021 28th International Workshop on Active-Matrix Flat Panel Displays and Devices (AM-FPD), 144 (2021).
- F.P. Incropera, D.P. Dewitt, T.L. Bergman, and A.S. Lavine, Foundation of Heat Transfer (Wiley & Sons: New Jersey, 6/E, 2012).
- W.E. Boyce, and R.C. DiPrima, Elementary Differential Equations and Boundary Value Problems (John Wiley & Sons: New York, 7/E, 2001).