
 ?Mathematical formulae have been encoded as MathML and are displayed in this HTML version using MathJax in order to improve their display. Uncheck the box to turn MathJax off. This feature requires Javascript. Click on a formula to zoom.
Abstract
A switchable privacy mode (SPM) display should not be seen by a driver during driving (privacy mode), but it needs to be seen by the driver and a co-driver when a car is stopped (share mode). In this work, a SPM display was designed using a bottom twisted-nematic (TN) liquid crystal display (LCD) and a top in-plane switching (IPS) LCD where a half-wave plate (HWP) is located between the two LCD panels. The SPM display in front of the co-driver was considered, which is seen under asymmetric viewing conditions. The orientation of the slow axis, retardation dispersion, and biaxiality of the retarder were varied to maximize the SPM’s optical performance in the driver’s and co-driver’s viewing directions. Transmittance at the driver’s viewing direction can be reduced from 4.22 to 0.03% in privacy mode by replacing the positive dispersion retarder with a negative dispersion retarder.
1. Introduction
Currently, display panels are widely used inside automobiles, and new display applications have been continuously developed [Citation1–3]. Beyond the traditional cluster display for the driver, a separate display for a co-driver has gradually been installed in more automobiles [Citation3]. The display panel for the co-driver should not be seen by the driver in the course of driving due to safety concerns. This is called privacy mode. However, the display panel needs to be viewed by the driver and the co-driver when the car is stationary, which is called share mode. Thus, a display panel that can be switched between privacy mode and share mode is required for co-driver displays (CDDs) [Citation4].
Switchable privacy mode (SPM) can be achieved using various methods [Citation5–11]. For example, the light field approach using a prism array was suggested [Citation5]. A light-absorbing dichroic dye panel stacked over the main display was also proposed to obtain SPM operation [Citation6]. However, privacy mode occurs in the normal viewing direction with a symmetric viewing angle profile in these approaches [Citation5,Citation6], while in automotive displays, privacy needs to be achieved in the driver’s oblique viewing direction. Moreover, the CDDs must have an asymmetric viewing angle profile. A polymer-dispersed liquid crystal (PDLC) panel stacked on a vertically aligned louver-like waveguide can control the propagation direction of light [Citation7–9]. Privacy mode is obtained when the PDLC is switched to the transparent state, while share mode is achieved when the PDLC is in the scattering state. In addition, a display panel staked on a vertically switchable electrophoretic display can also control the propagation direction of light [Citation10]. Privacy mode is achieved when the light-absorbing capsules are vertically aligned and act like the louver, while share mode is obtained when the electrophoretic display is off. However, these approaches commonly employ an opaque waveguide structure where the transmittance (TR) inevitably decreases.
Another active approach is stacking two liquid crystal display (LCD) panels. The upper one is the main display panel where the information is loaded, while the lower one is the sub-display panel used for controlling the angular distribution of the backlight intensity [Citation11]. The brightness reduction can be minimized in this approach, unlike other approaches mentioned above. Generally, an in-plane switching (IPS) LCD is used for the main display due to its wider viewing angle [Citation12–14]. For the sub-display panel, display panels with an asymmetric angular distribution of TR may be suitable candidates.
This paper studied SPM in CDDs, which is observed by the driver and the co-driver under asymmetric viewing angle conditions. A CDD is seen by the driver at an oblique viewing angle (θ 0o), while it is seen by the co-driver in the normal direction (θ = 0o) (Figure (a)). We investigated the effect of the optical parameters of the retarder, which is a key element in maximizing SPM display performance. To implement SPM while minimizing TR reduction, a compensation film is essential. In addition, the role of the compensation film is crucial for optimizing the optical properties at the asymmetric viewing directions. The slow axis orientation of the retarder, dispersion of retardation, and biaxiality of the retarder were varied, and the optimal conditions were examined.
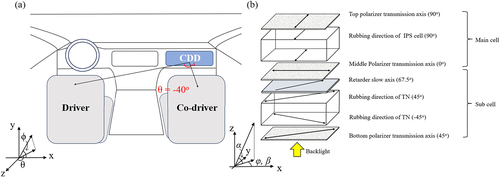
Figure 1. (a) Illustration of the driver’s and co-driver’s viewing angles for the SPM display studied in this paper. θ and ϕ are the polar and azimuthal incident angles of light. (b) is an optical structure of the SPM display panel. TP, MP, and BP indicate the top, middle, and bottom polarizers, respectively. and
are the polar and azimuthal pre-tilt angles of the liquid crystal, respectively.
is the slow axis of the retarder.
2. Theoretical background and simulation conditions
Figure (b) illustrates the dual cell structure used for the SPM in this paper. The SPM panel comprises three polarizers and two liquid crystal (LC) layers divided into a main cell and a sub-cell [Citation15,Citation16]. The upper polarizer of the main cell is the top polarizer (TP), the polarizer between the main cell and sub-cell is called the middle polarizer (MP), and the polarizer below the sub-cell is the bottom polarizer (BP). The main cell displays information, while the sub-cell controls the angular distribution of the input light intensity for the SPM. An IPS panel, which has an extensive viewing angle, was utilized as the main cell. Meanwhile, a twisted-nematic (TN) panel was used as the sub-cell to control share mode and privacy mode.
The optical parameters used in this paper are summarized in Table . The top and bottom polar pretilt angle of TN LC was 6o. The azimuthal pretilt angle
was 45 and -45o at the top and bottom TN LC layer, respectively, with a right-handed twist. The cell gap
was 5 µm. The
and
values of TN LC were 1.61 and 1.49, respectively. Additionally,
and
of TN LC were 8.6 and 3.3.
,
, and
were 11.7, 5.5, and 14 pN, respectively. The transmission axes of TP, MP, and BP were 90, 0, and 45o, respectively. Thus, the LC molecules at the bottom of the TN sub-cell were orthogonally oriented to the transmission axis of BP (i.e. they adopted the O-mode configuration) [Citation17]. SPM operation can also be achieved by the E-mode of TN, with the optical parameters modified. The corresponding parameters of the IPS LCD are also synthesized in Table .
Table 1. Simulation parameters used in the study.
Because the horizontal viewing angle characteristics of the IPS panel are better when the MP transmission axis is horizontal, the transmission axis of MP was set to 0o. In this structure, to maximize the intensity of light incident on the IPS main cell, a half-wave-plate (HWP) was required between TN LC and MD; this converts the polarization after the TN layer to be parallel to the MP transmission axis. For this purpose, the orientation of the slow axis of HWP was set to 67.5o as a default (Figure (b)).
The question remains whether it is impossible to achieve asymmetric TR distribution by setting the transmission axis of BP to 90o without HWP and = 0o. With the transmission axis of BP set to 90o without HWP, the darkest and brightest viewing angles were shown when the azimuthal viewing angle ϕ is 225 or 45 o, respectively, and not along the horizontal viewing directions ϕ = 0 and 180o in privacy mode. Hence, this is not preferable for the automotive display, which is mainly seen along the horizontal direction [Supplementary material S1]. On the other hand, when the transmission axis of BP was set to 45o and HWP was used, the darkest and brightest zones were shown along the horizontal viewing direction in privacy mode. Thus, HWP is essential in optimizing the SPM technology [Citation18–21].
In addition, the SPM panel for CDD is viewed at the driver’s and the co-driver’s positions, so the optical parameters of HWP need to be simultaneously optimized for both oblique and normal viewing directions. Because the phase retardation of the retarder depends on the angle of incidence, the optimal value of the retarder parameter differs in oblique and normal viewing directions [Citation19, Citation22]. Here,
is defined as.
(1)
(1) where θ and ϕ are the polar and azimuthal incident angles of light, which are identical to the definition of the polar and azimuthal viewing angles in this paper.
This paper studied the conditions of HWP that maximize the SPM’s performance by varying three retarder parameters: , dispersion of retardation dRin/dλ, and the NZ coefficient in the asymmetric viewing conditions [Citation23–25]. The NZ coefficient is defined as
, which is generally used to evaluate the optical biaxiality of a retarder. CDD is positioned in the co-driver’s normal viewing direction; hence, the in-plane retardation
was fixed at 275 nm throughout this paper.
was varied from 58o to 67.5o, and dRin/dλ was varied from 0.2 to 0.7. Additionally, the NZ coefficient was changed from -0.7 to 1.7. The effect of each parameter was investigated, and the optimal values were found. The simulation was conducted using the optical simulators of the Sanayi System. The spatial profile of the LC directors was generated using TechWiz 1D and the contour plots of transmittance were generated using TechWiz 2D. The Poincaré sphere notation of the polarization state change was calculated and visualized using TechWiz Polar. The demonstration images viewed from the driver and the co-driver positions were generated using TechWiz 2D. The extended Jones matrix method was commonly used for optical simulations.
3. Results and discussion
3.1 Dual cell operation
CDD should exhibit an asymmetric TR profile vs. the polar incident angle θ in privacy mode, but it should show a symmetric TR profile in share mode. In Figure (a), CDD is positioned at the front view of the co-driver; hence, the viewing angle for the co-driver was θ = 0o, and the viewing angle for the driver was assumed to be θ = −40o. No electric field was applied across TN LC to achieve high TR for both the driver (θ = −40o) and the co-driver (θ = 0o) in share mode. Meanwhile, the applied voltage was adjusted to achieve a minimum TR for the driver (θ = −40o) in share mode.
Figure (a) shows TR vs. θ along the horizontal direction with a voltage change across the TN layer. For this simulation, the transmission axis of MP was 0o, and = 67.5o. A positive dispersion (PD) retarder was used, whose Rin values were 316 , 275 , and 247 nm at wavelengths 450 , 550 , and 650 nm, respectively, and the NZ coefficient was 1.0 [Citation26]. A PD retarder is a retarder with a negative sign of dRin/dλ, whereas a negative dispersion (ND) retarder is one with a positive sign of dRin/dλ.
Figure 2. (a) TR vs. polar viewing angle of the O-mode TN display panel with PD HWP. This TR profile was obtained along the horizontal viewing direction. (b) specifies the polarization state change of incident light after passing through BP, TN, and HWP on the Poincaré sphere at 0 V state. Techwiz 2D was used for the calculation in (a), while Techwiz Polar was used for the Poincaré notation of the polarization state evolution.
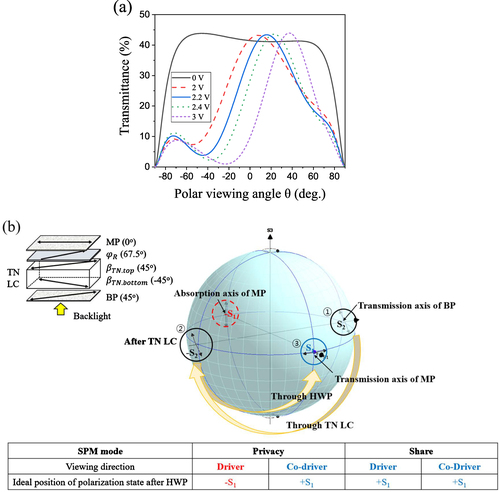
The panel exhibited symmetric and high TR at the 0 V state (black line). The TR values at the driver’s (θ = −40o) and co-driver’s (θ = 0o) directions were 43.74 and 41.46%, respectively. This condition corresponds to share mode. As the voltage increases, TR decreases in the θ < 0 region, while a high TR is retained in the θ > 0 region. At the 2.2 V applied state, TR at the driver’s (θ = −40o) and the co-driver’s (θ = 0o) directions were 4.22 and 36.55%, respectively. This condition corresponds to privacy mode. Thus, to maximize the performance of SPM, it is necessary to decrease TR in the driver direction and retain high TR in the co-driver direction during privacy mode. Moreover, TR needs to be high for both the driver and co-driver directions during share mode. To optimize the SPM performance, the optical parameters of the retarder were investigated to achieve better SPM performance.
To determine the optimal parameters, we quantified the optimal polarization state of light based on the distance between the final polarization state and the target polarization state on the Poincaré sphere. For example, the polarization state at the driver’s viewing direction should be close to the – S1 axis in privacy mode. On the other hand, the polarization state at the co-driver’s viewing direction should be close to the + S1 axis (Figure (b)). In share mode, the polarization state in the driver’s and the co-driver’s viewing directions should be close to the + S1 axis after passing through the TN LC layer (Figure (b)).
3.2. Dual mode operation with PD HWP vs. ND HWP
Figure (a and b) represent the contour plots of TR vs. viewing angle in privacy mode, while Figure (c and d) indicate the corresponding data in share mode. In this simulation, the effect of dRin/dλ was investigated. PD HWP was used in Figure (a and c), while ND HWP was used in Figure (b and d). For this simulation, was 67.5o, and the Rin values of a commercial ND retarder were used [Citation27]: Rin values were 236.5, 275, and 286 nm at wavelengths of 450 , 550 , and 650 nm, respectively, and the NZ coefficient was 1.0. The Rin values of the PD retarder is same with the conditions in .
Figure 3. Contour plots of TR in privacy mode when (a) PD and (b) ND HWP were used. (c) and (d) correspond to TR profiles in share mode. Techwiz 2D was used for this calculation.
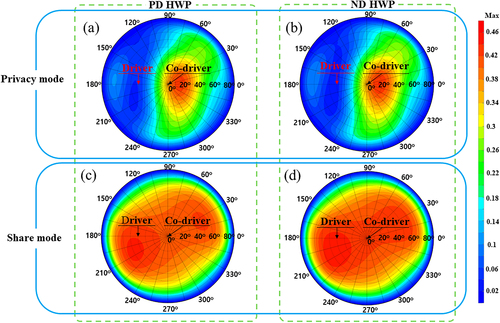
In privacy mode (Figure (a and b)), the TR values at the driver’s direction (θ = 40o, ϕ = 180o) were 4.22% and 3.18% when PD and ND HWPs were used, respectively. TR at the driver’s direction was lower when ND HWP was used. The light leakage around the driver’s direction was also lower when ND HWP was used. The TR values at the co-driver’s direction (θ = 40o, ϕ = 0o) were 36.55 and 36.37% when PD and ND HWPs were applied, respectively. Hence, TR at the co-driver’s direction is similar in both cases.
In share mode (Figure (c and d)), the TR values at the driver’s direction (θ = 40o, ϕ = 180o) were 43.74% and 44.71% when PD and ND HWPs were used, respectively. The TR values at the co-driver’s direction (θ = 40o, ϕ = 0o) were 41.46% and 42.73% when PD and ND HWPs were utilized, respectively. Thus, the TR values at the driver’s and co-driver’s directions were slightly higher when ND HWP was used in share mode.
The following question may be raised: Which optical property is most important in the SPM display? As described previously, to address the safety concerns, it is critical to minimize TR at the driver’s viewing direction in privacy mode while retaining the smallest decrease of TR in share mode. For the qualitative analysis of the SPM performance, we used the extinction ratio (ER), which is the TR value at the driver’s direction divided by the TR value at the co-driver’s direction. ER values with the PD and ND HWP were 8.7:1 and 11.4:1 in privacy mode, respectively, implying that the ND retarder can improve the SPM performance. The wavelength dependence of the TR profile is related to dRin/dλ, while the viewing angle dependence is related to the NZ coefficient. Therefore, the retarder parameters and dRin/dλ and the NZ coefficient need to be optimized for better SPM performance.
3.3. Effect of 
Figure (a and b) exemplify the polarized state at the driver’s and co-driver’s viewing directions on the Poincaré sphere, respectively, when was 60o in privacy mode. Rin (550 nm), dRin/dλ, and the NZ coefficient were fixed at 275 nm, 0.5, and 1.0, respectively. Figure (c) demonstrates the distance l-S1 and average distance l-S1. Average between the -S1 axis and the polarization state at the driver viewing direction vs.
in privacy mode. Here, l-S1 and l-S1. Average are defined as.
(2)
(2)
(3)
(3) where s1, s2, and s3 are Stokes parameters of the polarized state after passing through HWP on the Poincaré sphere. s1, s2, and s3 of the -S1 axis are (−1, 0, 0). l-S1 was calculated for each wavelength of 450 , 550 , and 650 nm. The distances between the -S1 axis and the polarization state at wavelengths of 450, 550, and 650 nm are l-S1. R, l-S1. G, and l-S1. B, respectively. l-S1. Average is the average distance of l-S1. R, l-S1. G, and l-S1. B. Because the -S1 axis is perpendicular to the transmission axis of MP, TR decreases as l-S1. Average decreases. When the car is driven, the light in the driver’s viewing direction is blocked better with a smaller l-S1. Average, which is essential for maximizing SPM performance. In privacy mode, l-S1. Average at the driver viewing direction is minimal when
was 60o, resulting in TR = 0.2% (Figure (c)).
Figure 4. Poincaré plot of the polarization state after passing through ND HWP at the (a) driver’s and (b) co-driver’s viewing directions in privacy mode with 2.2 V applied. is 60o in this example. (c) shows the distance
from the polarization state to the – S1 axis vs.
at the driver’s viewing direction in privacy mode, and (d) reflects the distance
from the polarization state to the + S1 axis vs.
at the co-driver viewing direction in privacy mode. (e–f) correspond to the distance
from the final polarization state to the + S1 axis in share mode with 0 V applied. The numbers in the graphs correspond to the averaged TR value for RGB light. Techwiz Polar was used for this calculation.
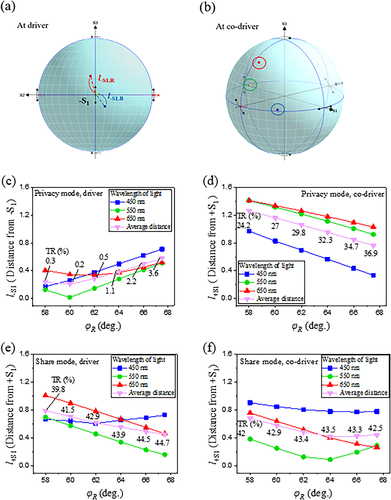
Figure (d) describes the distance (l + S1) and average distance (l + S1. Average) between the + S1 axis and the polarization state at the co-driver’s viewing direction vs. in privacy mode.
(4)
(4)
(5)
(5) Here s1, s2, and s3 of the + S1 axis are (1,0,0). The distances between the + S1 axis and the polarization state at wavelengths of 450 , 550 , and 650 nm are l + S1. R, l + S1. G, and l + S1. B. l + S1. Average is the average distance of l + S1. R, l + S1. G, and l + S1. B. Because the + S1 axis is parallel to the transmission axis of MP, TR increases as l + S1. Average decreases. The light at the co-driver’s viewing direction is transmitted better when l + S1. Average is smaller, which is suitable for SPM. In privacy mode, TR at the co-driver’s viewing direction was 27.03% when
was 60o (Figure (d)). l + S1. R, l + S1. G, l + S1. B, and l + S1. Average continuously decreased and TR increased when
increased from 58o to 67.5o. When
became 77o, l + S1. Average reached the minimum value and TR at the co-driver’s viewing direction became 42.68%. However, as described above, it is more important to minimize TR at the driver’s viewing direction in privacy mode; hence,
should not be large. When
was 77o, TR at the driver’s viewing direction was 13.16%, which is too large for the SPM (compared to the TR value of 0.2% at
= 60o).
Figure (e and f) details l + S1. R, l + S1. G, l + S1. B, and l + S1. Average at the driver’s and co-driver’s viewing directions vs. in share mode. In share mode, TR at the driver viewing direction was 41.5% when
was 60o. As
increased from 58 to 67.5o, l + S1. R, l + S1. G, and l + S1. Average continued to decrease, except for the fact that l + S1. B. l + S1. R, l + S1. G, and l + S1. B had minima at different
(Figure (e)). When
= 70o, l + S1. Average at the driver’s viewing direction reaches its minimum value in share mode. When
was 70o, TR at the co-driver’s viewing direction in share mode was 44.63%. However, TR at the driver’s viewing direction in privacy mode was 5.25%, which is too large to be applied for SPM.
Meanwhile, TR at the co-driver’s viewing direction (Figure (f)) in share mode was 42.89% when was 60o. l + S1. Average, l + S1. G, and l + S1. B (but not l + S1. R) exhibited a minimum value when
was 64.5o. When
was 64.5o, TR at the co-driver’s viewing direction in share mode was 43.49%. Under this condition, TR in the driver’s viewing direction in privacy mode was 1.36%, which is still larger than the 0.2% TR at
= 60o.
3.4. Effect of dRin/dλ
As abovementioned, TR in the driver’s viewing direction was minimized when was 60o. Hence, l ± S1 and l ± S1. Average vs. dRin/dλ was evaluated with fixed values of
= 60o and NZ coefficient = 1.0.
Figure (a and b) represents the polarized state at the driver’s and co-driver’s viewing directions, respectively, on the Poincaré sphere when dRin/dλ was 0.5 in privacy mode. Figure (c) specifies l-S1. R, l-S1. G, l-S1. B, and l-S1. Average at the driver’s viewing direction vs. dRin/dλ in privacy mode. l-S1. R, l-S1. B, and l-S1. Average expressed minimum values when dRin/dλ was 0.5 (Figure (c)). When dRin/dλ is 0.5, TR at the driver’s viewing direction in privacy mode was 0.04%, which is much reduced compared with the result of 0.2% after adjusting only the (Figure ). Figure (d) points out l + S1. R, l + S1. G, l + S1. B, and l + S1. Average at the co-driver’s viewing direction vs. dRin/dλ in privacy mode. TR at the co-driver’s viewing direction was 26.37% when dRin/dλ is 0.5. l + S1. R and l + S1. Average increased while l + S1. B slightly decreased as dRin/dλ increased from 0.2 to 0.6 (Figure (d)). l + S1. Average continued to increase without showing a local minimum when dRin/dλ increased from 0 to 0.6.
Figure 5. Poincaré plot of the polarization state after ND HWP at the (a) driver’s and (b) co-driver’s viewing directions in privacy mode with 2.2 V applied. (c) represents vs. dRin/dλ of HWP at the driver’s viewing direction in privacy mode, and (d) displays
vs. dRin/dλ of HWP at the co-driver’s viewing direction in privacy mode. (e–f) correspond to
in share mode with 0 V applied. The numbers in the graphs correspond to the averaged TR value for RGB light. Techwiz Polar was used for this calculation.
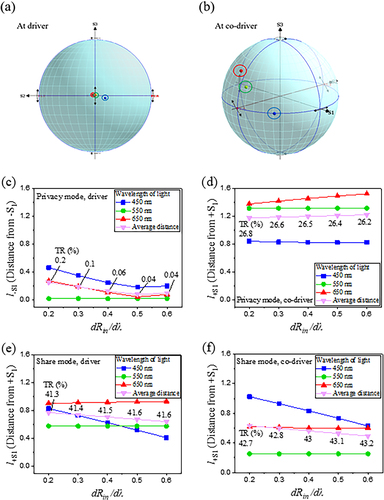
Figure (e and f) features l + S1. R, l + S1. G, l + S1. B, and l + S1. Average at the driver’s and co-driver’s viewing directions, respectively, vs. dRin/dλ in share mode. In share mode, TR at the driver’s viewing direction was 41.56% when dRin/dλ was 0.5. As dRin/dλ increased from 0.2 to 0.7, l + S1. B and l + S1. Average decreased while l + S1. R increased (Figure (e)). Even when dRin/dλ increased to 1, l + S1. Average continued to decrease without a local minimum. Meanwhile, TR at the co-driver’s viewing direction in share mode was 43.07% when dRin/dλ is 0.5. As dRin/dλ increased from 0.2 to 0.6, l + S1. B and l + S1. Average decreased, and l + S1. R increased (Figure (f)). l + S1. Average decreased without a minimum, even when dRin/dλ increased to 1.
For the co-driver’s viewing directions in privacy mode and the driver’s and co-driver viewing directions in share mode, l + S1. Average did not have a minimum in the range of dRin/dλ from 0 to 0.7. The l + S1. Average trend in Figure is similar to the result in Figure , which means that TR at the co-driver’s viewing direction in privacy mode and TR at the driver’s and co-driver’s viewing directions in share mode still cannot be maximized by adjusting dRin/dλ. However, TR at the driver’s viewing direction in privacy mode was much improved from 0.2 to 0.04%, which benefits the SPM operation.
3.5. Effect of the NZ coefficient
As aforementioned, TR at the driver’s viewing direction is a minimum value when = 60o and dRin/dλ = 0.5. l ± S1 and l ± S1. Average vs. NZ coefficient were investigated with fixed values of
= 60o and dRin/dλ = 0.5.
Figure (a and b) illustrate the polarized state at the driver’s and co-driver’s viewing directions, respectively, on the Poincaré sphere when the NZ coefficient was 0.9 in privacy mode. Figure (c) shows l-S1. R, l-S1. G, l-S1. B, and l-S1. Average at the driver’s viewing direction vs. NZ coefficient in privacy mode. l-S1. Average was minimized when the NZ coefficient was 0.9. When the NZ coefficient was 0.9, TR at the driver’s viewing direction in privacy mode was 0.034%. Figure (d) shows l + S1. R, l + S1. G, l + S1. B, and l + S1. Average at the co-driver’s viewing direction vs. the NZ coefficient in privacy mode. When the NZ coefficient was 0.9 in privacy mode, TR at the co-driver’s viewing direction was 26.37%, which is the same value as before optimization. l + S1. R, l + S1. G, l + S1. B, and l + S1. Average remained constant as the NZ coefficient increased from – 0.4 to 1.7 (Figure (d)). This is because the CDD is observed in the normal direction by the co-driver; hence, the optical property is not affected by changing the refractive index .
Figure 6. Poincaré plot of the polarization state after ND HWP at the (a) driver’s and (b) co-driver’s viewing directions in privacy mode with 2.2 V applied. (c) presents vs. NZ coefficient of HWP at the driver’s viewing direction in privacy mode, and (d) portrays
vs. NZ coefficient of HWP at the co-driver’s viewing direction in privacy mode. (e–f) correspond to
in share mode with 0 V applied. The numbers in the graphs correspond to the averaged TR value for RGB light. Techwiz Polar was used for this calculation.
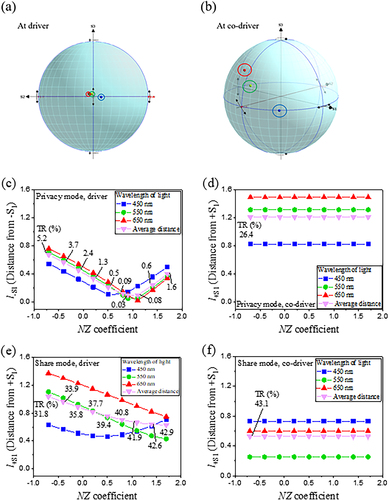
Figure (e and f) graph show l + S1. R, l + S1. G, l + S1. B, and l + S1. Average at the driver’s and co-driver’s viewing directions, respectively, vs. the NZ coefficient in share mode. When the NZ coefficient was 0.9, the TR at the driver’s viewing direction in share mode was 41.19%, which is 0.37% less than the TR before optimization. l + S1. Average was minimized when the NZ coefficient was 1.7 (Figure (e)). When the NZ coefficient was 1.7, TR at the co-driver’s viewing direction in share mode was 42.93%. However, TR at the driver’s viewing direction was 1.6% in privacy mode, a significant increase compared to the result of 0.04% in Figure . Because minimizing TR at the driver’s viewing direction is important for SPM optimization, it is desirable to set the NZ coefficient to 0.9. Meanwhile, TR at the co-driver’s viewing direction in share mode was 43.07%, which was not affected by the NZ coefficient (Figure (f)). Consequently, it is appropriate to set the NZ coefficient to 0.9, which has the minimum TR at the driver’s viewing direction in privacy mode.
3.6. Dual mode operation with ND HWP after optimization
Based on the results of Figures , the optimized , dRin/dλ and NZ coefficient of ND HWP were finally applied to SPM, as depicted in Figure . The optimal conditions were finalized through fine tuning of each parameters and the results were given as
and dRin/dλ of HWP were 60.5o and 0.5, respectively, while the optimal NZ coefficients were 0.6, 0.93, and 0.99 at wavelengths of 450, 550, and 650 nm, respectively. Figure (a) shows the TR vs. polar viewing angle in privacy mode and share mode. In privacy mode, TR at the driver’s viewing direction was 0.029%, which was much reduced than the TR value of 4.22% before optimization (Figure ). TR at the co-driver’s viewing direction was 27.03%, which was decreased compared to the TR value of 36.55% in Figure . Although TR at the co-driver’s viewing direction was not improved in privacy mode after optimization, TR at the driver’s viewing direction was minimized. The value of ER after optimization was 901:1, which was significantly greater than it was before optimization (8.7:1, as shown in Figure ). In share mode, TR at the driver’s viewing direction was 41.73%, which was slightly decreased compared to the TR result of 43.74% in Figure . Additionally, TR at the co-driver’s viewing direction was 43.23%, which was slightly increased compared to TR in Figure (41.46%).
Figure 7. TR vs. polar viewing angle of a display panel along the horizontal viewing direction when the optimized HWP was used and the contour plots of TR in the (b) privacy mode and the (c) share mode when the optimized HWP was used. Techwiz 2D was used for this calculation.
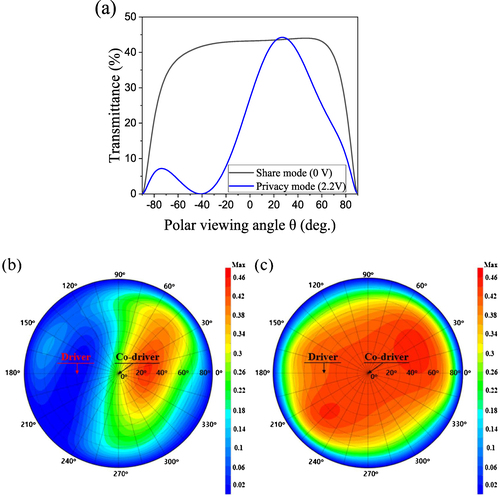
Figure (b and c) are contour plots indicating TR vs. viewing angle in privacy mode and share mode, respectively when the optimized HWP was used. Compared with the results before optimization (in Figure ), TR around the driver’s viewing direction was reduced in privacy mode (Figure (b)). In share mode, TR at the driver’s viewing direction slightly decreased, while TR at the co-driver’s viewing direction slightly increased (Figure (c)).
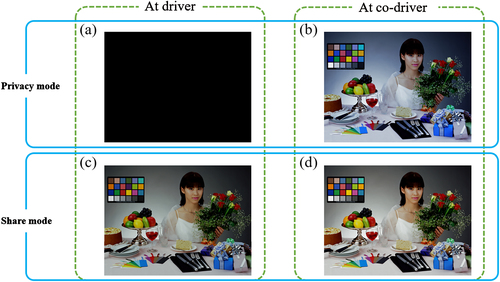
Figure shows the demonstration simulation images at the driver’s and the co-driver’s viewing directions in privacy mode (Figure (a–b)) and share mode (Figure (c–d)). The display panel becomes dark for the driver when in privacy mode (Figure (a)), while the bright state is retained for the co-driver without significant image distortion Figure (b). It is also confirmed that the display panel shows a clear image to both the driver ((c)) and the co-driver in share mode ((d)).
Figure 8. Demonstration simulation images observed at the (a) driver’s and (b) co-driver’s viewing directions in privacy mode. (c) and (d) are the corresponding images in share mode. The simulation parameters for the TN-LCD panel and the compensation film are identical to Figure . Techwiz 2D was used for this calculation.
4. Conclusion
This study investigated the dependence of the SPM performance on HWP parameters, such as , dRin/dλ, and the NZ coefficient. The SPM performance was improved when ND HWP was used. The optimized values of
, dRin/dλ, and the NZ coefficient were 60.5o, 0.5, and 0.6 (λ =450 nm), 0.93 (λ=550 nm), and 0.99 (λ=650 nm), respectively. TR at the driver’s viewing direction in privacy mode was reduced from 4.22% to 0.03%, and ER was significantly increased from 8.7:1 to 901:1 after optimization. This work studied CDD (seen in the asymmetric viewing condition). The optimization of the retarder for the SPM display, observed in symmetric viewing angles, was also examined. These results will be announced elsewhere.
Disclosure statement
No potential conflict of interest was reported by the author(s).
Additional information
Funding
Notes on contributors

Minseo Kang
Minseo Kang received a B.E. degree from the Division of Electronics Engineering at Jeonbuk National University in 2024. He is currently a graduate student in the Division of Electronics and Information Engineering at Jeonbuk National University. His research interests are optical design for automotive displays and directional growth of nanowires.

Hoon-Sub Shin
Hoon-Sub Shin received an M.S. at Hanyang University in 2005 and a Ph.D. at Jeonbuk National University in 2021. Since 2004, he has worked as a research engineer at LG Display. His research area focuses on developing new materials and structures for display devices.
Jong-Min Baek
Jong-Min Baek received his B.S. and M.S. in electronics engineering from Pusan National University in 2015 and 2017, respectively. He is currently a research engineer at Sanayi System, South Korea.

Ji-Hoon Lee
Ji-Hoon Lee received B.S., M.S., and Ph. D. degrees at Korea University in 2003, 2005, and 2007, respectively. Since 2013, he has worked as a professor in the Division of Electronics Engineering, at Jeonbuk National University. His research focuses on optics and electro-optical materials for display engineering applications.
References
- D.S. Hermann, 2018 25th International Workshop on Active-Matrix Flatpanel Displays and Devices (AM-FPD). IEEE, 1–6.
- B. Straub, and A.G. Daimler, 2018 25th International Workshop on Active-Matrix Flatpanel Displays and Devices (AM-FPD). IEEE, 1–4.
- S. Wu, 2022 29th International Workshop on Active-Matrix Flatpanel Displays and Devices (AM-FPD). IEEE, 45–47.
- X. Dong, J. Yu, R. Han, Q. Ma, D.K. Yoon, S. Cai, Z. Zhang, C. Wang, and C. Zhu, SID Symp. Dig. Tech. Pap. 54, 980–981 (2023). doi:10.1002/sdtp.16471
- S. Lei, Y. Sun, Y. Geng, Z. Zhang, S. Chen, J. Sha, Y. Deng, Y. Wang, and L. Xin, SID Symp. Dig. Tech. Pap. 53 (1), 1272–1275 (2022). doi:10.1002/sdtp.15739
- H.-J. Choi, H. Lee, S. Lim, S. Park, S. Baek, and J.-H. Lee, Appl. Opt. 58 (22), 6105 (2019). doi:10.1364/AO.58.006105
- D.-J. Lee, J. Kwak, K.S. Ha, J. Jung, C.H. Lee, G.T. Kim, W.G. Youn, and J.-K. Park, SID Symp. Dig. Tech. Pap. 53 (1), 243–246 (2022). doi:10.1002/sdtp.15464
- S.-H. Baek, J. Jung, S.-I. Kim, D.-J. Lee, G.T. Kim, and J.-K. Park, SID Symp. Dig. Tech. Pap. 53 (1), 1426–1429 (2022). doi:10.1002/sdtp.15782
- L. Zhou, and S. Liu, Crystals 12 (10), 1347 (2022). doi:10.3390/cryst12101347
- K. Shiota, M. Okamoto, and H. Tanabe, J. Soc, Inf, Disp. 25 (2), 76–82 (2017). doi:10.1002/jsid.528
- W. Liu, L. Mu, A. Xu, Y. Zhang, and M. Qiao, SID Symp. Dig. Tech. Pap. 51 (1), 243–245 (2020). doi:10.1002/sdtp.13849
- P. Yeh, and C. Gu, Optics of Liquid Crystal Displays, 67 vols (John Wiley and Sons, Hoboken, NJ, 2009).
- T.-H. Choi, Y. Choi, J.-H. Woo, S.-W. Oh, and T.-H. Yoon, Opt Express 24 (14), 15987–15996 (2016). doi:10.1364/OE.24.015987
- T.-H. Choi, J.-H. Woo, Y. Choi, S.-W. Oh, and T.-H. Yoon, SID Symp. Dig. Tech. Pap. 48 (1), 385–388 (2017). doi:10.1002/sdtp.11640
- L. Guo, X. Shao, Y. Liao, H. Liu, K. Dai, S. Lee, Z. Wang, H. Zhan, R. Zhang, Y. Du, J. Liu, Z. Li, and L. Jiang, SID Symp. Dig. Tech. Pap 51 (1), 119–121 (2020). doi:10.1002/sdtp.13819
- H. Huang, X. GU, G. Wang, H. Li, J. Han, S. Li, Y. Ma, Z. Kang, D. Li, C. Zhao, K. Guo, Z. Liu, G. Yuan, and X. Dong, SID Symp. Dig. Tech. Pap 52 (1), 618–619 (2021). doi:10.1002/sdtp.14758
- T. Toyooka, E. Yoda, T. Yamanashi, and Y. Kobori, Displays 20 (5), 221–229 (1999). doi:10.1016/S0141-9382(99)00026-8
- J. Kim, D.-H. Lee, J.-H. Lee, and J.-H. Lee, J. Inf. Disp 23 (1), 87–95 (2022). doi:10.1080/15980316.2021.1999338
- S. Ahn, and J.-H. Lee, Curr. Opt. Photonics 5 (1), 45–51 (2021).
- S.-W. Oh, B.-W. Park, J.-H. Lee, and T.-H. Yoon, Appl. Opt. 52 (32), 7785–7790 (2013). doi:10.1364/AO.52.007785
- S.-W. Oh, A.-K. Kim, B.W. Park, and T.-H. Yoon, J. Inf. Disp. 16 (1), 1–10 (2015). doi:10.1080/15980316.2014.1003252
- H.-J. Choi, K.-U. Jeong, and J.H. Lee, Opt. Mater. 99, 109531 (2020). doi:10.1016/j.optmat.2019.109531
- M.-T. Tran, J. Koo, M. Kim, K.-U. Jeong, and J.-H. Lee, Opt. Mater. 142, 114089 (2023). doi:10.1016/j.optmat.2023.114089
- J. Kim, and J.-H. Lee, IEEE Trans. Instrum. Meas. 69 (12), 9805–9812 (2020). doi:10.1109/TIM.2020.3005275
- J. Im, J.W. Kim, Y.Y. Kang, Y. Nam, W.-G. Koh, J.-W. Ka, and J.-H. Lee, Mol. Syst. Des. Eng. 7, 1467 (2022). doi:10.1039/D2ME00089J
- S. Yang, H. Lee, and J.-H. Lee, Opt. Eng. 55 (2), 0027106 (2016). doi:10.1117/1.OE.55.2.027106
- O. Parri, G. Smith, R. Harding, H.-J. Yoon, I. Gardiner, J. Sargent, and K. Skjonnemand, Adv. Disp. Technol. E-pap. Flex. Disp. 7956, 208–218 (2011).