Abstract
In this study, we assessed the large-scale circulation anomalies leading to wintertime air pollution episodes in Bergen, Norway. Bergen is an example of a city, where a strong interplay between large-scale and local circulation features is relevant. Certain large-scale circulation regimes that are different from the usually assumed large-scale stagnation, lead to local air pollution episodes. We assessed these circulation regimes and their predictability. For this, we modified and applied a previously developed atmospheric circulation proxy for the identification of air pollution episodes. Use of this proxy on data from a high-resolution atmospheric general circulation model showed a good reproduction of the total number of potentially polluted days per month and their inter-monthly variability. We also found a link between the persistence of the flow above the Bergen valley and the occurrence and severity of the local air pollution episodes. Analysis of the large-scale circulation over the North Atlantic-European region, with respect to air pollution in Bergen, revealed that the persistence in the meteorological conditions connected to the air pollution episodes is not necessarily caused by large-scale anomalies of the atmospheric circulation over the Norwegian west coast. It is rather connected to anomalies further upstream as far away as Greenland.
1. Introduction
Air quality hazards are a challenge for both the urban population and city administrations. The effect of air pollution from NO2 and particulate matter on mortality rates in the urban population has been shown both for long-term exposure (Naess et al., Citation2007) and exposure to short-term peak-pollution levels (Madsen et al., Citation2012). Therefore, legislative thresholds exist for both the short-term maximum air pollution and the long-term mean values. City administrations implement action plans that should reduce the number and severity of air pollution episodes, where concentrations exceed the short-term peak thresholds. This includes both ad hoc mitigation measures for single air pollution episodes but also long-term planning in order to reduce the necessity of the acute mitigation measures in the first place, and to solve the problem with the high long-term exposure. Since the latter often needs large investments in the development of the local infrastructure, decision-makers need information on the long-term variability and potential future occurrence of air pollution episodes. Assessment and prediction of such episodes are, however, inherently difficult tasks. As of today, measurement networks often suffer from too short time-series to draw conclusions on the long-term variability of the occurrence of air pollution episodes. This makes it necessary to extrapolate the existing observations both into the past, in order to assess the current frequency of the air pollution episodes, and into the future, in order to assess the potential effect of climate change.
Air quality assessments over long temporal and on large spatial scales are often formulated in terms of the effect of certain large-scale circulation features on air pollution (e.g. Tai et al., Citation2012; Pausata et al., Citation2013). While long-range transport of air pollutants can play a significant role in urban air pollution episodes, in many cities pollution levels are tightly connected to local emissions and hence local stagnation events over the urban area (e.g. Kukkonen et al., Citation2005; Streets et al., Citation2007). This local stagnation can be connected to larger-scale stagnation events, whose future occurrence can be assessed with universal circulation or stagnation indices based on global climate models (Horton et al., Citation2012, Citation2014). The local circulation, however, can also be influenced or even dominated by local features such as mountain valley or seashore circulations that are not fully resolved in such models (Holmer et al., Citation1999; Lareau et al., Citation2013; Wolf-Grosse et al., Citation2017). Moreover, models tend to predict too deep atmospheric boundary layers, (Davy and Esau, Citation2014; Zilitinkevich et al., Citation2013).
Bergen, Norway is an example of a city, where local effects are relevant. Local emissions cause sporadic air pollution episodes. In the past, such situations occurred frequently in some winters, whereas other winters showed only a few or no pollution episodes. Peak air pollutant concentrations exceeding legislative thresholds mostly occur because of the reduced ventilation under ground-based radiative temperature inversions in the urbanized Bergen valley. These inversions are typically connected to a distinct circulation above the valley, characterized by clear sky conditions, south-easterly winds and cold temperatures (Wolf et al., Citation2014). In a previous study, we therefore designed a simple atmospheric circulation proxy (hereafter referred to as the proxy) for meteorological conditions above Bergen that are favourable for high air pollution (Wolf and Esau, Citation2014; hereafter referred to as WE14). The proxy was based on daily mean meteorological fields above the valley from the ERA-Interim reanalysis (Dee et al., Citation2011). It allowed us to give a quantitative estimate of the past occurrence of months with an unusually large number of air pollution episodes.
The air pollution episodes in complex urbanized areas are usually perceived as local phenomena. Due to their locality and assumed influences of myriad small-scale processes and features, those episodes were largely considered as objects to empirically constrained statistical description. This is a reasonable description for day-to-day air quality variations. However, experience with observations, both ours and taken from the literature review, suggests that the significant and persistent anomalies in air quality could be more strongly determined by the large-scale atmospheric circulation. One may understand it, as the pollutant accumulation requires longer continuous episodes of calm weather than everyday fluctuations of concentrations do. Usually it takes 1–2 days of persistent weather conditions, which allow for the temperature inversions in the valley, before a high pollution episode occurs. In addition, the most severe pollution episodes last for several days. The red spectrum of the atmospheric motions then relates the longer time scales to larger spatial scales and larger magnitudes of the circulation anomalies. In this way, the persistent local weather is related to the large-scale atmospheric dynamics. Although the cyclone or anti-cyclone dynamics could be just coarsely captured in climate models, larger scale atmospheric dynamics such as planetary waves are believed to be captured rather well. This connection provides an opportunity to omit the complexity of urban-scale atmospheric effects and forcing, which are so influential in shaping those ordinary variations of the local concentrations, and focus on a study of relationships between the large-scale atmospheric dynamics and the air pollution episodes. The weather proxy, we have introduced in WE14 and utilized with some modifications in this study, represents in a simple way the resulting mesoscale circulation. On the one side, it could be easily calculated from both observational and model data. On the other side, it is insensitive to the local effects, which overlay the data with insignificant fluctuations. We would like to emphasize that there was no purpose to introduce an optimal proxy index. We were rather seeking for its dynamical relevance with respect to the large-scale circulation.
In WE14, we therefore also applied the proxy to data from the Norwegian Earth System Model (NorESM). NorESM (Bentsen et al., Citation2013; Iversen et al., Citation2013) is a typical example of the global climate models used in the Coupled Model Intercomparison Project Phase 5 (CMIP-5) (World Climate Research Program, Citation2016). However, the numbers of observed air pollution episodes per winter month were strongly underestimated in NorESM as compared to ERA-Interim. There may be two explanations for this. The first explanation questions the direct physical link between the large and the local scales. It is possible that the highly local stagnation inside the valley is only connected through an intermediate step to the large-scale circulation that is resolved by the coarse-resolution global climate models (Outten and Esau, Citation2013; Wolf-Grosse et al., Citation2017). This could be a circulation steered by the topography or land-sea differences on the scale of tens of kilometres (Barstad et al., Citation2008). The large-scale circulation is believed to be captured by ERA-Interim but not by NorESM. In this case, the resolution of NorESM would be too coarse to resolve the intermediate step, and hence the circulation above the Bergen valley connected to the local stagnation in the city.
The other explanation questions the hypothesis of climate models to be able to resolve the correct large-scale circulation features that are relevant in this situation. For example, many of the CMIP-5 models do not correctly reproduce the statistics of circulation blockings over Europe (Anstey et al., Citation2013; Kreienkamp et al., Citation2010) or the location of the North Atlantic storm track (Shaw et al., Citation2016). Both are highly relevant for the correct treatment of especially persistent circulation features in Northern Europe.
It is therefore necessary to identify models that are able to reproduce the statistics of the problem at hand. The Atmospheric General Circulation Model (AGCM) of the Japanese Meteorological Research Institute (MRI-AGCM) has a very high resolution of 20 km. In addition it has been shown to better reproduce the European blockings than other models due to its higher resolution (Matsueda et al., Citation2009). As an AGCM, MRI-AGCM should also better represent the meridional position of the North Atlantic storm track than the fully coupled ESMs (Keeley et al., Citation2012).
Here, we present our study of the large-scale circulation connected to air pollution episodes in Bergen, Norway, and the role of persistence for the observed air pollution episodes. We test if a condition of persistence in the proxy for air pollution episodes can improve its predictive skill and assess the relation between the duration of air pollution episodes and their severity. In addition, we identify the flow above the Bergen valley and the large-scale flow features connected to air pollution episodes, and test if MRI-AGCM is able to represent these flows. In the second section, we will present the applied methodology. The results will be presented in the third, and summarized and discussed in the last section.
2. Materials and methods
2.1. Area of interest and local air quality measurements
The central part of Bergen is located in a narrow, curved valley on the Western coast of Norway, at about 60°N and 5°E. Around the city centre the valley is oriented in a south-east, north-west direction and opens towards a large sea inlet called Bergen fjord. The valley floor is minimum around 1 km wide and the surrounding mountain tops are between 344 m and 642 m high.
While the valley shelters the city from extreme wind events from most directions (Jonassen et al., Citation2013), it also favours the existence of persistent ground-based temperature inversions during wintertime (Wolf et al., Citation2014). In such conditions, the prolonged accumulation of NO2 from road traffic as the largest source causes exceedances of legally regulated air quality thresholds. The most severe documented and reported air pollution event so far occurred in January 2010, giving Bergen unfortunate national and international media attention. Persistent temperature inversions led to hourly mean NO2 concentrations above 400 μg m−3 and exceedances of the national target for air quality of hourly mean concentrations of 150 μg m−3 at least once per day during 19 days in January 2010. Also for November and December 2010, and January 2013 the hourly mean concentration of 150 μg m−3 was exceeded at least once per day during 11 or 12 days. Although never reaching the severe conditions of January 2010 again, those episodes always trigger broad media attention from the local up to the national level.
The air quality in Bergen has been routinely monitored at two measurement stations since 2003. One station is located next to Danmarksplass square (DP). It serves as a high pollution reference station, located at one of the busiest traffic junctions in the city. The air in this area is seen as representative for the highest level of pollution that the city population might be exposed to in direct proximity of heavy traffic. The area directly surrounding the HP station is also densely populated. The second station is located next to the town hall (Rådhuset, RHT) and can be characterized as an urban background station, representative for the pollutant concentrations that a large fraction of the urban population will be exposed to. For our analysis, we downloaded and used NO2 concentration data from both stations, available from NILU (Citation2017), for the period between 2003 and 2013. As in WE14, we define high pollution days as days where at least one hourly mean measurement (01:00–24:00 UTC) at the DP reference station reached NO2 concentrations of more than 150 μg m−3.
For the interpretation of the data, it is worth mentioning that the traffic pattern around both stations has changed considerably over time. This is mainly caused by a change of the public transportation infrastructure close to the stations, e.g. the distinct reduction of bus traffic with the opening of a light rail line in 2010, and by the reduction of the amount of cars passing through the city centre. The relation between the NO2 concentrations elsewhere in the city and at the two measurement stations might therefore not be constant over time. For lack of reliable background data, no homogenization was applied to the data from either station.
2.2. Circulation index
For this study, we modified and applied the basic proxy developed in WE14. For details, we refer to this publication and will here only give a short summary, mainly highlighting the modifications applied. The proxy is based on the daily mean deviation of the 2 m temperature from its climatological seasonal mean cycle and the 10 m wind speed and direction. The corresponding information is taken from ERA-Interim at 0.25° output resolution (ECMWF Citation2016) as mean over the two grid-boxes centred at 5.5°E, 60.25°N and 5.5°E, 60.5°N. The ERA-Interim resolution is lower than this and not sufficient to resolve the Bergen valley (model spectral resolution T255). We therefore assume the ERA-Interim fields to be representative of the larger-scale circulation above the Bergen valley, only representing the effects of features beyond the scale of several tens of kilometres, such as the transition from the sea to the western Norwegian mountains. The proxy is binary and by default set to 0. If the above named variables over Bergen are within a given range or exceeding predefined thresholds, the proxy is set to 1 for the respective day, marking it as favourable for the occurrence of high air pollution.
In order to account for the persistence of the meteorological conditions that are necessary to reach high pollution levels, we added constraints on temperature and wind for the day prior to potential pollution events. We determined our thresholds for separating between high and low pollution events from a comparison of the distribution of the variables during high pollution days and during all weather conditions. The tuning criterion was to reach the highest predictive scores. The averaging of the wind vectors was done by an averaging and re-normalization of the normalized x- and y- components of the wind vectors and a separate averaging of the wind speeds, instead of a simple averaging of the non-normalized x-and y-components of the wind vectors as in WE14. This avoids misidentification of situations with relatively high wind speeds and strong variability in wind direction over the averaging period (1 day) as cases with relatively low wind speeds. The final set of thresholds from this procedure, defining the new modified proxy, is given in Table .
Table 1. The empirically identified thresholds for the atmospheric circulation proxy.Table Footnote*
We also applied the proxy to MRI-AGCM data (MRI-AGCM version 3.2). The 2 m temperatures and 10 m wind fields from the MRI-AGCM (Mizuta et al., Citation2012; Murakami et al., Citation2012) for the Northern hemisphere between 30°W, 50°N and 30°E, 70°N at a 0.1875° grid resolution (model spectral resolution T959) were provided to us by Ryo Mizuta from the Japanese Meteorological Research Institute. We used the mean over the 2 × 2 grid-points between 5.44°E, 60.25°N and 5.63°E, 60.44°N. Those points had the best overlap with the representative area of the ERA-Interim grid-points that we used for the development of the proxy. We assumed a grid-point to be representative for the box defined by the centre lines between the actual grid-point and its neighbouring points. The reason for the change from 1000 hPa wind fields in WE14 to the 10 m wind fields here was that for the MRI-AGCM we only had the 10 m wind fields available. This has the disadvantage that the wind speeds might be more dependent on the selection of PBL schemes in the model, but has on the other hand the advantage to avoid the variable vertical distance between the ground and the 1000 hPa level due to changes in sea-level pressure and should therefore be more consistent. However, the differences between the results we achieved using either wind field, were small.
In WE14, we removed potential high pollution cases during Sundays and public holidays. It has turned out that with the new, extended proxy this additional filtering led to reduced skill scores. Even though pollution events typically do not occur during low emission periods, the Sunday rush-hour traffic has led to sufficiently high emissions in order to exceed the 150 μg m−3 threshold for the NO2 concentrations in a few occasions. The new procedure without the removal of potential pollution episodes during Sundays and public holidays was also necessary in order to enable the analysis of the persistence of high pollution events. Admittedly, a specific treatment of the effect of variable emissions would have been desirable but was not possible with the chosen approach of a binary proxy index.
2.3. Spatial analysis
For the spatial analysis of the large-scale circulation pattern during high pollution events we used the ERA-Interim 500 hPa geopotential height (Zg) at a 1° resolution between 90°W, 30°N and 30°E, 89°N. We identified the dominant correlation pattern between the area weighted wintertime 500 hPa geopotential height anomaly (Za) and the NO2 concentrations (P) at the two air quality stations in Bergen with a maximum correlation analysis. For this we used the method of Singular Value Decomposition (SVD) of the correlation matrix between both fields (Bretherton et al., Citation1992; Wallace et al., Citation1992).
First, we calculated the matrix Za in the same way as we calculated the deviation of the 2 m temperature from its climatological seasonal mean cycle in WE14. We then rearranged Za to have the dimensions , and combined the time vectors for both NO2 concentration datasets to the matrix P with dimensions
. The variables Nφ and
are the number of grid-points in the meridional and zonal direction, while Nt indicates the number of time-steps. The matrixes
and P are normalized by the standard deviation of their values and their mean is subtracted. We then calculated the correlation matrix between both fields
with P′ denoting the transpose of the matrix P.
The singular values σk and the left and right eigenvectors za,k and pk of the covariance matrix C then satisfy the two equations
(1)
(2)
Equations (Equation1(1) ) and (Equation2
(2) ) describe the expansion coefficients or Principal Components (PC) of the arrays P and
, respectively. The SVD decomposition is given by
(3)
with the two matrices p and za consisting of the eigenvectors p = [p1, p2] and za = [za,1, za,2] and being the diagonal matrix of the singular values σk. Maximum correlation analysis based on the SVD method is usually used in order to identify the fields with the highest correlation between two variables with large spatial extents (e.g. Leibowicz et al., Citation2012). The first n modes, described by the first n eigenvectors, are the patterns with the maximum of the explained covariance between both fields. The patterns that do not contribute significantly to the explained covariance are usually neglected. In our case, however, P contains measurements at only two stations. Therefore, C only has two singular values and consequently only two patterns can be identified for both P and
. Due to the normality of the eigenvectors, the patterns for P are the best-fit regression line between concentrations at both stations and the line normal to it.
For the visualization of the two resulting patterns in Za that have the strongest correlation with the NO2 concentrations in the city, we used heterogeneous correlation maps (Wallace et al., Citation1992) between Za and the expansion coefficients of P. An area with high correlation means that the geopotential height anomalies at that area have a similar temporal variability as the NO2 concentrations in the city.
For comparison between the NAO index and the NO2 concentrations in the city, we also calculated an indicator for the daily NAO index, defined as the first eigenvector of the new autocorrelation matrix . Instead of the dominant pattern of correlation between two fields like before, applying the SVD to the new autocorrelation matrix Cn returns the most dominant pattern in a single field. The matrix Cn is squared and the left and right eigenvectors defined in Equations (Equation1
(1) )–(3) are identical. Since the autocorrelation matrix using the full Za would be very large, we only used every other grid-point in both the zonal (
) and the meridional (ϕ) directions.
For a comparison of the occurrence of blockings and pollution days we used a simplified version of the blocking index from Masato et al. (Citation2013), based on the ERA-Interim 500 hPa geopotential height field (Zg) at a 2.5° horizontal resolution, here written in summation-notation to be consistent with the discrete model data:
with the resolution of 2.5°, the value of Zg at the discrete grid- and time-points
, and the index
corresponding to a span of 5° around the central latitude that is in this definition located between the latitude indices
and
. In order to follow the storm tracks, the central blocking latitude for this index should be the meridional maximum of the high-pass-filtered transient eddy kinetic energy at each longitude (Pelly and Hoskins, Citation2003). As a simplification, we instead used two different zonally constant values for
. One corresponds to a central latitude of 48.75°N, the latitude closest to the original central latitude of 50°N from Tibaldi and Molteni (Citation1990). The other corresponds to a central latitude of 56.25°N, approximately the central latitude over Bergen from Pelly and Hoskins (Citation2003). We then assumed a grid-cell to be blocked if maxi(Bi) > 0 over a longitudinal belt longer than 15° and for at least 5 consecutive days.
3. Results
3.1. The relevance of persistence
In the process of re-designing the proxy, we were particularly careful not to reduce the detection rate, since we see it as important to capture the majority of observed air pollution episodes. Figure shows the monthly and seasonal number of observed high pollution days and days that are favourable for high air pollution. A large inter-monthly and -annual variability in the occurrence of high pollution days is visible with clustering of winter-months with a large number of polluted days in some years and complete absence of such in others. The pollution concentrations strongly depend on wind speed and correspondingly on the absence of storminess. The North Atlantic storminess varies on decadal time scales as it was found in several recent studies e.g. by Wang et al. (Citation2013). The studies revealed that the stormy and calm years clustered in time with approximately decadal alternation cycles.
Fig. 1. Monthly sum of observed and predicted days with high NO2 air pollution based on the proxy applied to ERA-Interim for the extended winter seasons 1979–2013. The horizontal lines show the seasonal means of the monthly sums.
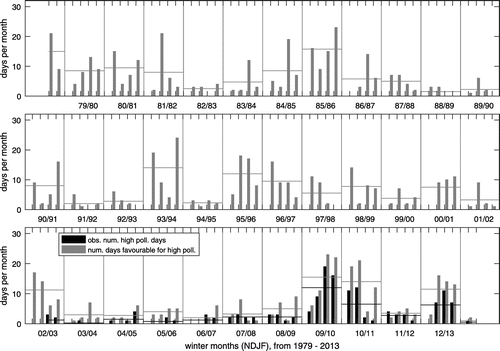
The proxy has been developed to reflect the inter-monthly and inter-seasonal variability of the occurrence of high air pollution days and should therefore not be viewed as a prediction tool for single air pollution events. In order to understand the applicability and usefulness of the proxy, its predictive skills have to be characterized. Similar to WE14, the new proxy is able to reproduce the monthly and seasonal variability of the occurrence of high pollution events to a large degree. Figure also shows a similar long-term variability of the occurrence of days with meteorological conditions favourable for high air pollution through the entire ERA-Interim data-set, which is 24 years longer than the observational air pollution record. Table shows quantitatively the relevant skill scores for the old (WE14) and the revised proxy. In this context, a separation of training and validation periods would have been desirable, but could not be achieved due to the short observational record.
Table 2. Detection and false alarm rate (Ryan et al., Citation2000) of the proxy and correlations between the monthly and seasonal sum of observed and predicted polluted days.Table Footnote*
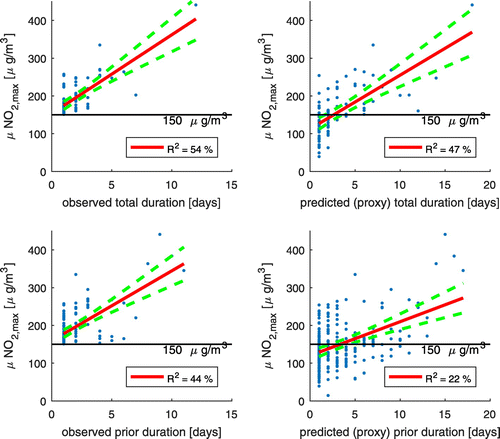
All skills improved or at least remained constant. The largest improvement is visible in the false alarm rate that is decreasing from 0.62 to 0.55. This suggests that even the weak constraint on the proxy for the meteorological variables the day prior to pollution events had a positive impact, indicating the importance of a build-up phase of stagnant conditions. The relevance of this build-up is also confirmed by a comparison of the observed maximum daily NO2 concentration at DP with the duration of high pollution events in Fig. . There is a weak positive correlation between the duration of observed high pollution events and the daily maximum hourly mean NO2 concentrations. The same applies to the concentrations at RHT (not shown). In a test, where we excluded the one value exceeding 400 μg m−3 at DP in the top panels of Fig. , the linear regression coefficients of determination were reduced from 54 and 47% to 33 and 36% for the observed and predicted total duration of pollution episodes, respectively. This means that there is still a relevant connection between the duration of pollution events and the maximum NO2 concentration in Bergen, even without this one extreme case. The coefficients of determination for the observed NO2 concentration at DP against the total duration of the pollution episodes are higher than the coefficients of determination for the observed NO2 concentration against the prior duration of air pollution episodes. This is caused by the multitude of factors that are influencing the absolute concentration. Traffic emissions, which are the main contributor to the NO2 concentrations in Bergen, are higher during the week than during the weekends. The daily maximum concentrations will therefore temporarily decrease whenever a pollution episode extends over a weekend. Persistent pollution episodes, as indicated with the proxy, will not always mean continuously stagnant synoptic scale meteorological conditions. Different synoptic scale features can be coupled to the mesoscale circulation associated with local high pollution events and several of those features can be identified as one long-lasting pollution event. The possibility for this increases with increasing false alarm rate of the proxy. Furthermore, the last day of each pollution episode might already show decaying NO2 concentrations. This day is excluded in the lower panels of Fig. from all pollution episodes lasting longer than one day. Because of these different reasons, it can be assumed that the absolute maximum NO2 concentration during high pollution episodes is a better approximation of the maximum balance between the emission and removal processes than the daily maximum concentration in association with the prior duration of the same episodes. Long lasting pollution events predicted by the proxy are strongly associated with exceedances of the 150 μg m−3 threshold. Only 2 out of 9 and 1 out of 4 cases existed with absolute maximum concentrations below this threshold for predicted pollution episodes lasting 3 and 4 days, respectively (Fig. ). A maximum NO2 concentration of more than 150 μg m−3 was measured at least once during all cases with predicted duration of at least 5 days.
Fig. 2. Relationship between the total duration of observed (left panels) and predicted (right panels) pollution events vs. the absolute maximum hourly mean NO2 concentration at DP (top panels). Relationship between the prior duration of pollution events vs. the daily maximum hourly mean NO2 concentration at DP (bottom panels). The red lines are the best estimates for linear regressions of the scatter plots; the green lines show the 95% confidence intervals for the regression lines based on the Matlab regression_line_ci function. R2 is the adjusted coefficient of determination. All R2 are significant at the 99% level.
3.2. The long-term perspective
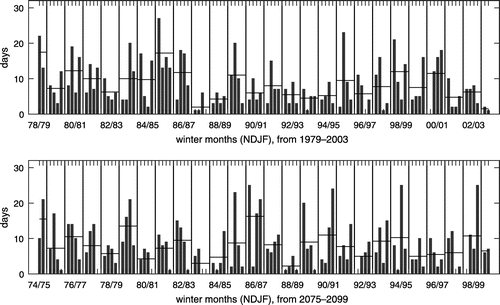
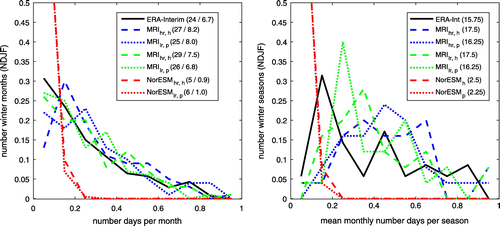
The number of days with meteorological conditions favourable for air pollution episodes in Bergen, as predicted from the proxy based on MRI-AGCM data, is shown in Fig. for both the current climate and the climate at the end of the twenty-first century. A large inter-monthly and annual variability in the occurrence of days with meteorological conditions favourable for high air pollution is visible both now and in the future. Their maximum monthly number is slightly higher than that predicted with the proxy based on ERA-Interim data (Fig. ). The much higher resemblance of the histogram from ERA-Interim for MRI-AGCM compared to that from NorESM in WE14 suggests that MRI-AGCM much better represents the circulation conditions over Bergen with respect to the observed air pollution episodes. There appears to be no systematic difference between the historic and the future time intervals.
Fig. 3. Monthly sum of predicted days with high NO2 air pollution based on the proxy applied to MRI-AGCM for the extended winter seasons 1979–2003 and 2075–2099. The horizontal lines show the seasonal means of the monthly sums.
We also included similar conditions for the day prior to potentially polluted days to the proxy used in WE14, based on the 1000 hPa wind fields. When applying this proxy to ERA-Interim, it also caused an improvement of the skill scores compared to the proxy without the conditions on persistence. However, when applying this modified proxy to NorESM, almost no days fulfilled the criteria for a potentially polluted day any longer. This means that the few days that NorESM predicted as potentially polluted could have occurred by occasional coincidence. These cases were most likely not part of a persistent circulation pattern above the Bergen valley that typically leads to the high air pollution inside the valley.
In order to investigate if the substantial differences between MRI-AGCM and NorESM are caused by the different resolutions of both models, it would be necessary to run both models with a comparable resolution, which is not an option here. In addition to the 20 km version of MRI-AGCM, we were also provided with data from a 60 km resolution version of the model. The predicted numbers of high pollution days in this version are similar to the results presented in Fig. and are, therefore, not shown. Even the lower resolution version of MRI-AGCM has a higher resolution than ERA-Interim (model spectral resolution T319 vs. T255). Both versions of MRI-AGCM should therefore be able to resolve the relevant circulation above Bergen, whereas they do not resolve any of the local features of the Bergen valley similar to ERA-Interim. A distinct difference between both versions of MRI-AGCM would therefore indicate that the relevant large-scale circulation is dependent on the resolution. This is, however, not the case here. In order to test the relevance of the output resolution on the representation of the statistics of air pollution events, we also tested the proxy on the mean over the grid-cells that cover the area representative of the grid-cells in NorESM. For ERA-Interim, the maximum predicted number of monthly high pollution events was reduced from 24 to 11 using the mean over 10 × 8 grid cells, whereas the number for MRI-AGCM was reduced from 27 to 14 using an average over 14 × 11 grid cells. This is still considerably higher than the maximum number of predicted high pollution days per month in NorESM. The correlation between the monthly and seasonal numbers of observed and predicted high pollution days in ERA-Interim changed from 0.89 and 0.93 to 0.69 and 0.70, respectively. This is a strong indication that the output resolution is not the main reason for the low numbers of days to be predicted as potentially polluted when applying the proxy to NorESM.
To analyse the temporal behaviour of the different data-sets in more detail, we compared the distribution of the monthly and seasonal number of predicted pollution events in MRI-AGCM and NorESM to the distribution based on ERA-Interim (Fig. ). The distribution of the number of potentially polluted days from ERA-Interim and MRI-AGCM overlap well on a monthly basis, while the correspondence on a seasonal basis is significantly weaker. The main reason for this behaviour is that months with a large number of potentially polluted days are not clustered in the MRI-AGCM data, in clear contrast to ERA-Interim. This might indicate a weakness of MRI-AGCM not being able to reproduce appropriately the inter-seasonal variability of the North Atlantic storm track. Either way, there is again no clear change visible in the predicted occurrence of high pollution events from the climate change throughout the twenty-first century. For comparison, we also included into Fig. the distribution for the number of days predicted to be potentially polluted for the lower resolution of MRI-AGCM and the one using the proxy from WE14 on NorESM data. While the distribution on a monthly basis for the lower resolution version of MRI-AGCM looks similar, the distribution on a seasonal basis is more skewed and therefore resembles more that of ERA-Interim. With the chosen normalization, the distribution from NorESM does not resemble the distributions in ERA-Interim due to the very low maximum number of predicted high pollution days.
Fig. 4. Probability distribution functions of the monthly and seasonal sums of predicted days with the potential for high air pollution in ERA-Interim, MRI-AGCM and NorESM. The indices h and p refer to the historic (1979–2003/1950–2000) and predicted (2075–2099/2050–2100) time-ranges for MRI-AGCM/NorESM, respectively. The x-axes are normalized by the maximum number of days of all records (given in parenthesis in the legend). For the distribution on a monthly basis, also the mean number of predicted days with the potential for high air pollution is shown after the slash. The y-axes are normalized by the record length in years. The NorESM curves extend beyond the limit of the y-axis.
3.3. The large-scale perspective
We used a maximum correlation analysis to reveal the dominant synoptic scale circulation patterns connected to the largest variability in the pollution concentrations in Bergen. The dominating mode of the maximum correlation analysis over the North Atlantic-European region (Fig. ) showed a clear resemblance to the dominating mode of Za (see Appendix 1). We see the dominating mode of Za as an indicator resembling the NAO index. A direct correlation of Za and the NO2 concentration at DP also showed a negative NAO like pattern with correlations above south-eastern Greenland as high as 0.49 and negative correlations of minimum −0.48 over the south-western North Atlantic. The correlation between the Za above Bergen and the NO2 concentration at DP on the other hand was very low at −0.04. Only the second and much weaker mode from the maximum correlation analysis corresponds to the previously expected anticyclonic high-pressure systems located over southern Scandinavia. This explains the comparatively low correlation between the Scandinavian index and the number of observed high pollution days and why Zg and sea level pressure directly over Bergen were not useful for the proxy in WE14.
Fig. 5. First (left panels) and second (right panels) modes of co-variability between daily Za and the maximum hourly mean NO2 concentrations at DP and RHT during wintertime. The top panels show the heterogeneous correlation maps (Wallace et al., Citation1992) between Za and the expansion coefficients of the pollution measurements. The middle and bottom panels show the normalized expansion coefficients for Za and the pollution measurements. Both fields were smoothed with a 7-day running mean filter prior to the SVD analysis. The explained correlation fractions and coefficients of determination between the principal components are given in the titles of the contour-plots. All correlations are significant above the 99% level. Blue circles and crosses in the time-series of the principal components (PCs) denote days with daily maximum NO2 concentrations of more than 150 μg m−3 at DP and RHT, respectively. Regard the different y-axis limits for the bottom right panel.
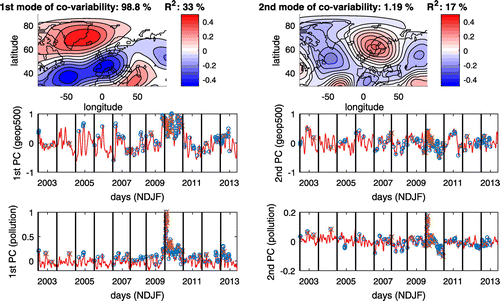
Especially for low NO2 concentrations, the day-to-day variability acts as noise in the pollution data-set. The total coefficient of determination R2 between the sum of the PC’s from the NO2 concentration in Bergen and Za, with each PC weighted by their respective singular values, was only 16.9%. The application of a simple 7 day running mean filter removed parts of this noise and increased the total R2 to 32%, while keeping the spatial pattern unchanged. This value for R2 corresponds well to the correlation of -0.6 between the monthly number of high pollution events and the monthly mean NAO index in WE14. The unusually strong and persistent negative NAO index, together with the record high and persistent pollution measured in Bergen during winter 2009/2010, might, however, be dominating the correlation over a time-series of only 13 years. A test removing all days between November 2009 and December 2010, in order to remove the peak in both the negative NAO pattern and the number of high pollution days, resulted in a lower R2 of 23% but again similar spatial patterns, meaning that there is still some predictive skill for high pollution events, even for less extreme conditions.
Using the daily mean instead of maximum NO2 concentrations, results in slightly higher R2 values of 39 and 24% for the first and second mode of co-variability, respectively. The same applied to the relationship between the duration of pollution episodes and the observed daily mean concentration with adjusted coefficients of determination of 53 and 24% for the total duration and the prior duration of predicted high pollution events, respectively. The reason for this might be the dependence of the total maximum daily NO2 concentration on temperature inversions in the valley that is dependent on the exact time of sunset and sunrise (Wolf et al., Citation2014), and the peak emissions during rush hour that normally happens twice a day around 09:00 and 16:00 UTC. This introduces another condition on the maximum daily concentrations that might be less strict for the mean concentrations.
3.3. Atmospheric blockings as a predictor for high air pollution episodes
Blocking anticyclones over central Europe are usually not connected to air pollution events over Bergen (Fig. ). The prediction rate of blockings with a central latitude around 48.75°N for the same longitude as Bergen (5°E) is only 0.26 with almost zero correlation in the number of polluted and blocked days on a monthly basis. When using the higher central blocking latitude, the prediction rate increases to 0.39 and the correlation to 0.48. This is in agreement with the low correlation of Za over Bergen and the NO2 concentration at DP. Interestingly, the correlation increases considerably when we look at the relationship between the observed high pollution events and the lower central blocking latitude in the area westward of 20°W, although the prediction rates remain relatively low. The prediction rate of the lower central blocking latitude is highest for blockings centred around 50°W, even though the difference is small. Simultaneously, the number of blockings centred at this longitude was less than half of that centred at 5°E, consistent with the results in Fig. . The positive Za over Southern Greenland can cause an inversion of the meridional gradient in Zg, the condition for the identification of a blocking. For the blockings detected above Bergen, both spatial patterns for Za in Fig. might appear as blockings.
Fig. 6. Comparison between the observed high pollution events and the blocking indices over longitude. Blockings north and south are the blockings based on the central latitudes 56.25°N and 48.75°N, respectively. Significant correlations above the 99% level are marked with dots.
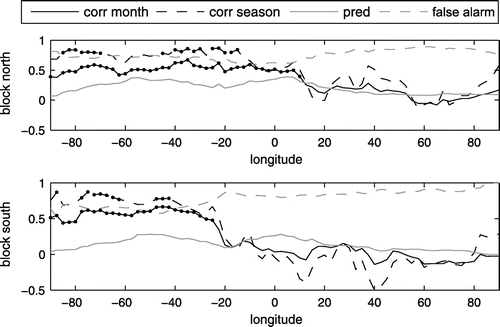
The number of short lasting observed air pollution events is greater than the number of the longer lasting ones. In order to test if those longer lasting events show a better overlap with blockings, we calculated the prediction rates for pollution events lasting for at least 3 days. The corresponding maximum prediction rates from blockings increased only moderately to 0.56 and 0.4 for the higher and lower central blocking latitudes at 10°W and 50°W, respectively. The prediction rate at 5°E also increased moderately to 0.46 for the higher central latitude, whereas the prediction rate for the lower central latitude even decreased to 0.22.
Considering all blockings west of 10°E, results in a prediction rate of 0.81 and 0.62, and false alarm rates of 0.86 and 0.89, for all air pollution episodes and the higher and lower central blocking latitudes, respectively. This means that most high pollution events are observed while atmospheric blockings occur somewhere upstream of Bergen. It also means that blockings cannot be used to predict single pollution events, or their statistics, due to the very high false alarm rates.
3.4. Dependence between concentration and predictability
We have found a weak, but significant link between the NAO index and the observed high pollution cases. This is in line with the idea that the NAO index is a good measure of cyclone activity in the North-Atlantic sector. Large cyclone activity suppresses the local stagnation events and leads to strong mixing of the atmospheric boundary layer in the valley. Furthermore, the proxy was designed for the 150 μg m−3 threshold at the high traffic reference station Danmarksplass (DP). A so-called response operator curve (ROC, Fig. ) helps to understand the predictive skills of the NAO index for air pollution events, and the dependence between the predictive skill of the proxy and the used concentration thresholds.
Fig. 7. Response Operator Curves (ROCs) for high pollution events. The two lines marked with DP and RHT show the ROC of the proxy when modifying the threshold for the NO2 concentrations at the two measurement stations. The + marks the location of the minimum distance from the optimum point with false alarm rate 0 and detection rate 1 for the ROC curve of the proxy. The o and * mark NO2 concentration thresholds of 150 μg m−3 (high pollution) and 200 μg m−3 (very high pollution), respectively. The line marked with NAO shows the ROC for the first PC of Cn. The different false alarm and prediction rates are achieved by setting varying thresholds for the minimum in the expansion coefficient with frozen threshold for the NO2 concentration at DP of 150 μg m−3.
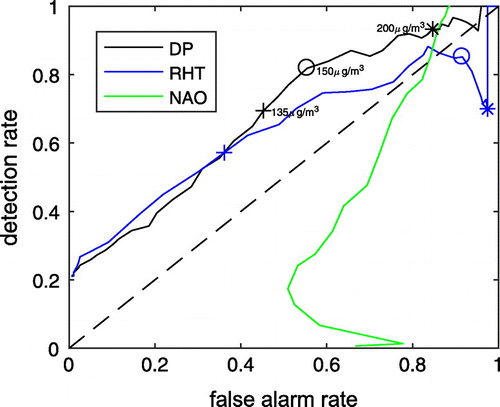
One measure for the skill is the distance from the optimum point with false alarm rate 0 and detection rate 1 (Bódai, Citation2015). In that case, the proxy has the best skill for concentrations of 135 and 85 μg m−3 for DP and RHT, respectively. Another measure is defined by the maximum distance from the no skill curve (the dashed line in Fig. ). In that case, the proxy has the largest skill for the 150 μg m−3 threshold at DP –the originally anticipated threshold and a threshold of 50 μg m−3 at RHT. In any case, the skill of the proxy falls off beyond 160 μg m−3.
The problem of sporadically occurring high air pollution in urban areas is comparable to outliers over a noise baseline. As the proxy is not meant as a case-to-case prediction tool, outliers are not connected with a high economic cost. Furthermore, the aim of the proxy is to characterize the dynamical features with the potential of leading to air pollution events. A high prediction rate at DP is therefore of higher importance for us than a low false alarm rate. This makes the second measure, i.e. the distance from the no skill curve, the more relevant one. For the RHT station, however, the overall skill for the prediction of high pollution events is rather low. Both measures for the best predictive skill are connected to low detection rates of less than 0.6. The RHT station is downstream of the area with the highest local emissions. The exact local transport pathway along the valley axis plays an important role here in addition to local stagnation events (Wolf-Grosse et al., Citation2017).
The NAO has been reported to be a useful indicator of the role of interannual atmospheric variability for large-scale pollution-health impacts (Pausata et al., Citation2013). Despite that, the ROC for the leading mode’s expansion coefficient of Za is mostly below the no skill curve in Fig. . As this is an indicator of the NAO index, it means that the predictive skills of the NAO index for air pollution episodes in Bergen are generally low, independent of the threshold concentrations used to define air pollution episodes. One explanation for this is the circulation connected to such a pattern. In a very strong NAO-like pattern in Fig. , the gradient of Za could be very high over Bergen. A resulting south-easterly flow might lead to high wind speeds above the Bergen valley. Inversions could therefore be eroded away due to mechanical mixing under such high wind speeds. In contrast, the proxy guarantees low enough wind-speeds for the inversions to persist over a longer time. This allows for extended accumulation of air pollution. Using a normalization of the NAO index for a standard deviation of 1 over the observation period and wintertime, the NAO index should be at least 0.3 in order to assure an acceptable prediction rate of 0.8. This is in contrast to the negative correlation between the number of high pollution events and the monthly mean NAO index in WE14. The threshold in the NAO index for a detection rate of more than 0.6 is –0.3. This in turn also leads to a false alarm rate higher than 0.75. A simple analysis of the NAO index is therefore not sufficient for the detection or the statistical analysis of high pollution events. The strong correlation rather suggests that both, a negative NAO and the circulation above the Bergen valley leading to the local high air pollution events, are dependent on a similar background flow on monthly to seasonal scales. This makes the NAO useful for the assessment of some properties of the large-scale circulation leading to these high pollution events.
4. Summary and discussion
The occurrence of air pollution episodes in urban areas is a challenge. Assessments of the long-term variability in their occurrence are necessary to guide politicians and administration in decision-making on large infrastructure investments that can reduce the risk of air quality hazards. If there is long-term variability in the meteorological conditions leading to such risks, this can be difficult, since the measurement record of urban air quality for many cities is short. One possibility to extend the measurement record is to characterize the meteorological conditions leading to such episodes and then to analyse their long-term variability.
The city centre of Bergen is located in a coastal valley on the Norwegian west coast. Despite comparatively low emissions, wintertime temperature inversions have led to recurrent air pollution episodes. Such events typically occur under specific circulation regimes above the valley characterized by persistent cold temperatures and medium to weak south-easterly winds. There is large long-term variability in the frequency of air pollution episodes in winter. In this study, we modified and applied a previously developed proxy for days with air pollution events in Bergen (WE14) defined as days, where the NO2 concentration at a high traffic reference station exceeds 150 μg m−3. We also assessed the relevance of large-scale circulation anomalies and persistence for the occurrence of such air pollution events.
The proxy is based on thresholds of the ERA-Interim 2 m temperature deviation from its climatological seasonal mean cycle, and the 10 m wind. If the daily mean fields above Bergen are within certain thresholds, the proxy is set to 1. To account for persistence of the meteorological conditions, the proxy also includes thresholds for the mean fields the day prior to each air pollution episode. Our results show that even mild constraints on the mean ERA-Interim fields above Bergen during the day prior to air pollution episodes moderately improved the prediction skills of the proxy. In addition, we found a dependency of the severity of air pollution episodes on their duration, where longer lasting episodes often reach higher NO2 levels.
When applying the proxy to the same fields of the very high-resolution MRI-AGCM, it reproduced the maximum numbers of days with potential air pollution episodes per winter month from the ERA-Interim fields. When we applied the proxy to NorESM data, it severely underestimated the number of potentially polluted days. Here, we showed that the model output resolution is not the main reason for this. NorESM has a coarser resolution than both ERA-Interim and MRI-AGCM. An averaging of the ERA-Interim and MRI-AGCM fields over the spatial scale resolved by NorESM, however, showed only moderately reduced numbers of potentially polluted days. NorESM does not reproduce some relevant parts of the large-scale flow defined by the proxy. A more detailed analysis of the large-scale flow in NorESM would be necessary in order to gain more information on this problem. In addition, a more detailed analysis of the large-scale flow in MRI-AGCM for days predicted as potentially polluted, could answer the question if MRI-AGCM is actually reproducing conditions that could lead to air pollution episodes over Bergen.
While the proxy applied to MRI-AGCM data is reproducing well the maximum number of potentially polluted days per winter month and their inter-monthly distribution, the inter-seasonal distribution of potentially polluted days is less well represented. The distribution has a lower skewness compared to the inter-seasonal distribution of potentially polluted days from ERA-Interim. There seems to be an unusually long persistence for cold/warm temperatures in Northern Europe, especially during January and February (Kolstad et al., Citation2015). There is a high likelihood for a cold winter month to be followed by another cold winter month. Such persistently cold winters should be correlated to the occurrence of high pollution events. This persistence, however, seems not to be represented in MRI-AGCM. The inter-seasonal variability in the context of our study means the variability from one winter to another. As it is understood now for the North Atlantic region, such a variability is determined by oceanic heat anomalies and their propagation in the Atlantic (Årthun et al., Citation2017). It is unknown, as to why MRI-AGCM seems not to capture this variability, despite being driven by observation-based sea surface temperature data (HadISST1, see Mizuta et al., Citation2012).
Persistent weather conditions in Europe are usually thought of in connection with anticyclonic systems or even blockings of the westerly circulation. We found, however, in this study that blockings centred over western Norway have low predictive skills for the air pollution events over Bergen. Furthermore, in WE14, we found that atmospheric pressure behaves inconsistently during high air pollution events. Anticyclonic blockings centred over western Norway might cause increased air pollution levels but they are not a necessary condition. Instead, blockings over the North Atlantic and Greenland had much higher predictive skills. This is in line with the results from Madonna et al., (Citation2017). They argue for a southerly location of the North Atlantic jet stream and found a strong overlap with this condition and blockings over Greenland. As an example for this setting they use the winter 2009/2010, when there were also record-many occurrences of air pollution in Bergen. The predictive skills of Greenland blockings were, however, still lower than the predictive skills of the simple atmospheric circulation proxy based on ERA-Interim data directly over Bergen. Thus, the question remains what may be the link between the large-scale circulation/blockings and the persistent local air pollution episodes.
Air pollution episodes over the city usually occur under cold conditions with clear skies. The cooling of wintertime atmospheric blockings has been associated with cold air advection, rather than radiative cooling within the blocked region (Pfahl and Wernli, Citation2012). The importance of the 2 m temperature deviation from its climatological seasonal mean cycle in ERA-Interim could therefore rather be interpreted as a proxy for the persistent advection of relatively cold and dry arctic or high latitude continental air masses during wintertime, compared to air advected from the North Atlantic region. Such an air mass can cause the cloud-free conditions that result in the temperature inversions in the Bergen valley. This interpretation is in agreement with the findings of Pfahl (Citation2014) who suggested the steering of cold temperature extremes over different parts of central Europe due to the advection of cold air from blocking events north-east of the area showing the cold extreme. The advection time scale for the cold air already serves as a filter for more persistent conditions. This filtering is visible also in the report by Buehler et al. (Citation2011) who found that cold spells occurred with a delay in comparison to the onset of blocking events. Yet another possibility in addition to radiative cooling on the large scale and advection of cold and dry air could be a circulation that leads to radiative cooling restricted to the Norwegian west coast. During south-easterly flow regimes, the Norwegian topography can orographically block the flow sufficiently and thereby cause relative stagnation at the west coast and cloud-free conditions, while east of the Norwegian mountains cloudiness and wind speeds could be distinctly higher.
It is, however, not necessary to have a large-scale circulation anomaly steering the circulation in the direct proximity to the area of persistent meteorological conditions. We propose an indirect link between the large-scale circulation and the local stagnation leading to the high air pollution events. The large-scale circulation is modified by the Norwegian topographic features on the scale of a few tens of kilometres. This then results in a mesoscale circulation above the Bergen valley favouring locally stagnant conditions and, therefore, deteriorating air quality. The anomalies in the large-scale circulation leading to the persistence in the advection of cold and dry air masses does not necessarily have to be located in direct proximity to Western Norway, as suggested by Buehler et al. (Citation2011), but can also be placed in some other region upstream from Bergen. This is indicated by the higher correlation between the blocking index with the more northern central latitude west of 15°W, corresponding to Greenland blockings. This high correlation with the Greenland blockings also fits well with the significant negative correlation of our pollution events with the NAO pattern due to the link between both large-scale circulation patterns (Croci-Maspoli et al., Citation2007; Madonna et al., Citation2017; Woollings et al., Citation2008, Citation2010, Citation2014). The high correlation as function of longitude at simultaneously low prediction rates might then be an indicator of propagating blocking centres, as confirmed by the overall high prediction rate over a larger segment in the zonal direction. This points towards the relevance of large planetary wave amplitude at some given point upstream of Bergen at simultaneously still existing positive phase speed. The monthly and seasonal correlation indicates the general state of the atmosphere over the North Atlantic with respect to the occurrence of blockings. A state of the atmosphere prone to blockings is also connected to persistent conditions over the Bergen valley, favouring local air pollution episodes. Individual blockings on the other hand only exist at single locations. Greenland blockings with their high latitude location, for example, often only steer the downstream westerly flow but are unable to block it completely. This steering can then cause a persistent circulation downstream of Greenland.
The above described links, however, could change due to climate change, e.g. through shifting blocking centre latitudes or planetary wave properties (Overland et al., Citation2016). The proxy may be expected to be less sensitive to this, keeping reasonable skill scores even in a different climate. The link between the mesoscale circulation and stagnant conditions in the Bergen valley leading to high pollution events is most likely caused by the interplay between the specific topography surrounding Bergen and the water bodies in the city. In this sense, the proxy enables the analysis of the future occurrence of the circulation features leading to stagnant conditions in the Bergen valley and their duration with the help of climate models. An even better identification of the flow patterns relevant for the occurrence of air pollution episodes in Bergen would improve this analysis further. It is, however, necessary that the climate model used for the future prediction is able to simulate appropriately the circulation above the Bergen valley that leads to high pollution events. Obviously, an initialized climate model that would give us the possibility to retune the proxy would be preferable, but such models do currently not exist.
Funding
This work was supported by the GC Rieber Foundation.
Disclosure statement
No potential conflict of interest was reported by the authors.
Acknowledgements
We thank the European Centre for Medium-Range Weather Forecasts for the ERA-Interim data and the Norwegian Institute for Air Research for the air quality measurement data. The MRI-AGCM data were produced under the KAKUSHIN Program of the Ministry of Education, Culture, Sports, Science, and Technology (MEXT) of Japan carried out by the Meteorological Research Institute (MRI) of the Japan Meteorological Agency (JMA). We thank Ryo Mizuta from MRI for kindly providing the data. NorESM data were downloaded from the Earth System Grid Federation (ESGF).
Related Research Data
References
- Anstey, J. A., Davini, P., Gray, L. J., Woollings, T. J. and Butchart, N.C. 2013. Multi-model analysis of Northern Hemisphere winter blocking: model biases and the role of resolution. J. Geophys. Res. Atmos. 118(10), 3956–3971. DOI:10.1002/jgrd.50231.
- Årthun, M., Eldevik, T., Viste, E., Drange, H., Furevik, T. and co-authors. 2017. Skillful prediction of northern climate provided by the ocean. Nat. Commun. 8(May), 15875. DOI:10.1038/ncomms15875.
- Barstad, I., Sorteberg, A., Flatøy, F. and Déqué, M. 2008. Precipitation, temperature and wind in Norway: dynamical downscaling of ERA40. Clim. Dyn. 33(6), 769–776. DOI:10.1007/s00382-008-0476-5.
- Bentsen, M., Bethke, I., Debernard, J. B., Iversen, T., Kirkevåg, A. and co-authors: The Norwegian Earth System Model, NorESM1-M – Part 1: description and basic evaluation of the physical climate, Geosci. Model Dev., 6(3), 687–720, doi:10.5194/gmd-6-687-2013, 2013.
- Bódai, T. 2015. Predictability of threshold exceedances in dynamical systems. Phys. D Nonlinear Phenom. 313, 37–50. DOI:10.1016/j.physd.2015.08.007.
- Bretherton, C. S., Smith, C. and Wallace, J. M. 1992. An intercomparison of methods for finding coupled patterns in climate data. J. Clim. 5(6), 541–560. DOI:10.1175/1520-0442(1992) 005<0541:AIOMFF>2.0.CO;2.
- Buehler, T., Raible, C. C. and Stocker, T. F. 2011. The relationship of winter season North Atlantic blocking frequencies to extreme cold or dry spells in the ERA-40, Tellus. Ser. A Dyn. Meteorol. Oceanogr. 63(2), 212–222. DOI:10.1111/j.1600-0870.2010.00492.x.
- Croci-Maspoli, M., Schwierz, C. and Davies, H. C. 2007. Atmospheric blocking: space-time links to the NAO and PNA. Clim. Dyn. 29(7–8), 713–725. DOI:10.1007/s00382-007-0259-4.
- Davy, R. and Esau, I. 2014. Global climate models’ bias in surface temperature trends and variability. Environ. Res. Lett. 9(114024), 1–8. DOI:10.1088/1748-9326/9/11/114024.
- Dee, D. P., Uppala, S. M., Simmons, A. J., Berrisford, P., Poli, P. and co-authors 2011. The ERA-interim reanalysis: configuration and performance of the data assimilation system. Q. J. R. Meteorol. Soc. 137(656), 553–597. DOI:10.1002/qj.828.
- ECMWF. 2016. MARS, the ECMWF archive. Online at: https://software.ecmwf.int/wiki/display/UDOC/MARS+user+documentation (accessed 30 September 2016).
- Holmer, B., Haeger-eugensson, M., Holmer, B. and Haeger-eugensson, M. 1999. Winter land breeze in a high latitude complex coastal area. Phys. Geogr. 20(2), 152–172. DOI:10.1080/02723646.1999.10642674.
- Horton, D. E., Harshvardhan and Diffenbaugh, N. S. 2012. Response of air stagnation frequency to anthropogenically enhanced radiative forcing. Environ. Res. Lett. 7(4), 44034. DOI:10.1088/1748-9326/7/4/044034.
- Horton, D. E., Skinner, C. B., Singh, D. and Diffenbaugh, N. S. 2014. Occurrence and persistence of future atmospheric stagnation events. Nat. Clim. Chang. 4(8), 698–703. DOI:10.1038/nclimate2272.
- Iversen, T., Bentsen, M., Bethke, I., Debernard, J. B., Kirkevåg, A. and co-authors: The Norwegian Earth System Model, NorESM1-M – Part 2: climate response and scenario projections, Geosci. Model Dev., 6(2), 389–415, doi:10.5194/gmd-6-389-2013, 2013.
- Jonassen, M. O., Olafsson, H., Valved, A. S., Reuder, J. and Olseth, J. A. 2013. Simulations of the Bergen orographic wind shelter. Tellus A 65, 19206. DOI:10.3402/tellusa.v65i0.19206.
- Keeley, S. P. E., Sutton, R. T. and Shaffrey, L. C. 2012. The impact of North Atlantic sea surface temperature errors on the simulation of North Atlantic European region climate. Q. J. R. Meteorol. Soc. 138(668), 1774–1783. DOI:10.1002/qj.1912.
- Kolstad, E. W., Sobolowski, S. P. and Scaife, A. A. 2015. Intraseasonal persistence of European surface temperatures. J. Clim. 28(13), 5365–5374. DOI:10.1175/JCLI-D-15-0053.1.
- Kreienkamp, F., Spekat, A. and Enke, W. 2010. Stationarity of atmospheric waves and blocking over Europe—based on a reanalysis dataset and two climate scenarios. Theor. Appl. Climatol. 102(1–2), 205–212. DOI:10.1007/s00704-010-0261-3.
- Kukkonen, J., Pohjola, M., Sokhi, R. S., Luhana, L., Kitwiroon, N. and co-authors. 2005. Analysis and evaluation of selected local-scale PM air pollution episodes in four European cities: Helsinki, London, Milan and Oslo. Atmos. Environ. 39(15), 2759–2773. DOI:10.1016/j.atmosenv.2004.09.090.
- Lareau, N. P., Crosman, E., Whiteman, C. D., Horel, J. D., Hoch, S. W and co-authors. 2013. The persistent cold-air pool study. Bull. Am. Meteorol. Soc. 94(1), 51–63. DOI:10.1175/BAMS-D-11-00255.1.
- Leibowicz, B. D., Abbot, D. S., Emanue, K. and Tziperman, E. 2012. Correlation between present-day model simulation of Arctic cloud radiative forcing and sea ice consistent with positive winter convective cloud feedback. J. Adv. Model. Earth Syst. 4(7), 1–10. DOI:10.1029/2012MS000153.
- Madonna, E., Li, C., Grams, C. M. and Woollings, T. 2017. The link between eddy-driven jet variability and weather regimes in the North Atlantic-European sector. Q. J. R. Meteorol. Soc. 143(708), 2960–2972. October 2017 Part A. DOI:10.1002/qj.3155.
- Madsen, C., Rosland, P., Hoff, D. A., Nystad, W., Nafstad, P. and co-authors. 2012. The short-term effect of 24-h average and peak air pollution on mortality in Oslo, Norway. Eur. J. Epidemiol. 27(9), 717–727. DOI:10.1007/s10654-012-9719-1.
- Masato, G., Hoskins, B. J. and Woollings, T. 2013. Winter and Summer Northern Hemisphere blocking in CMIP5 models. J. Clim. 26(18), 7044–7059. DOI:10.1175/JCLI-D-12-00466.1.
- Matsueda, M., Mizuta, R. and Kusunoki, S. 2009. Future change in wintertime atmospheric blocking simulated using a 20-km-mesh atmospheric global circulation model. J. Geophys. Res. 114(D12), D12114. DOI:10.1029/2009JD011919.
- Mizuta, R., Yoshimura, H., Murakami, H., Matsueda, M., Endo, H. and co-authors. 2012. Climate simulations using MRI-AGCM3.2 with 20-km grid. J. Meteorol. Soc. Jpn. 90A, 233–258. DOI:10.2151/jmsj.2012-A12.
- Murakami, H., Wang, Y., Yoshimura, H., Mizuta, R., Sugi, M. and co-authors. 2012. Future changes in tropical cyclone activity projected by the new high-resolution MRI-AGCM*. J. Clim. 25(9), 3237–3260. DOI:10.1175/JCLI-D-11-00415.1.
- Naess, Ø., Nafstad, P., Aamodt, G., Claussen, B. and Rosland, P. 2007. Relation between concentration of air pollution and cause-specific mortality: four-year exposures to nitrogen dioxide and particulate matter pollutants in 470 neighborhoods in Oslo, Norway. Am. J. Epidemiol. 165(4), 435–443. DOI:10.1093/aje/kwk016.
- NILU. 2017. Luftkvalitet i Norge. Online at: http://www.luftkvalitet.info/home.aspx (accessed 22 May 2017).
- Outten, S. D. and Esau, I. 2013. Extreme winds over Europe in the ENSEMBLES regional climate models. Atmos. Chem. Phys. 13(10), 5163–5172. DOI:10.5194/acp-13-5163-2013.
- Overland, J. E., Dethloff, K., Francis, J. A., Hall, R. J., Hanna, E. and co-authors. 2016. Nonlinear response of mid-latitude weather to the changing Arctic. Nat. Clim. Chang. 6(11), 992–999. DOI:10.1038/nclimate3121.
- Pausata, F. S. R., Pozzoli, L., Dingenen, R. V., Vignati, E. and co-authors. 2013. Impacts of changes in North Atlantic atmospheric circulation on particulate matter and human health in Europe. Geophys. Res. Lett. 40(15), 4074–4080. DOI:10.1002/grl.50720.
- Pelly, J. L. and Hoskins, B. J. 2003. A new perspective on blocking. J. Atmos. Sci. 60(5), 743–755. DOI:10.1175/1520-0469(2003)060<0743:ANPOB>2.0.CO;2.
- Pfahl, S. 2014. Characterising the relationship between weather extremes in Europe and synoptic circulation features. Nat. Hazards Earth Syst. Sci. 14(6), 1461–1475. DOI:10.5194/nhess-14-1461-2014.
- Pfahl, S. and Wernli, H. 2012. Quantifying the relevance of atmospheric blocking for co-located temperature extremes in the Northern Hemisphere on (sub-)daily time scales. Geophys. Res. Lett. 39(12), 1–6. DOI:10.1029/2012GL052261.
- Ryan, W. F., Piety, C. A. and Luebehusen, E. D. 2000. Air quality forecasts in the mid-Atlantic Region: current practice and benchmark skill. Weather Forecast. 15(1), 46–60. DOI:10.1175/1520-0434(2000) 015<0046:AQFITM>2.0.CO;2.
- Shaw, T. A., Baldwin, M., Barnes, E. A., Caballero, R., Garfinkel, C. I. and co-authors. 2016. Storm track processes and the opposing influences of climate change. Nat. Geosci. 9(9), 656–664. DOI:10.1038/ngeo2783.
- Streets, D. G., Fu, J. S., Jang, C. J., Hao, J., He, K. and co-authors. 2007. Air quality during the 2008 Beijing Olympic Games. Atmos. Environ. 41(3), 480–492. DOI:10.1016/j.atmosenv.2006.08.046.
- Tai, a. P. K., Mickley, L. J. and Jacob, D. J. 2012. Impact of 2000–2050 climate change on fine particulate matter (PM2.5) air quality inferred from a multi-model analysis of meteorological modes. Atmos. Chem. Phys. 12(23), 11329–11337. DOI:10.5194/acp-12-11329-2012.
- Tibaldi, S. and Molteni, F. 1990. On the operational predictability of blocking. Tellus A 42(3), 343–365. DOI:10.1034/j.1600-0870.1990.t01-2-00003.x.
- Wallace, J. M., Smith, C. and Bretherton, C. S. 1992. Singular value decomposition of wintertime sea surface temperature and 500-mb height anomalies. J. Clim. 5(6), 561–576. DOI:10.1175/1520-0442(1992) 005<0561:SVDOWS>2.0.CO;2.
- Wang, X. L., Feng, Y., Compo, G. P., Zwiers, F. W., Allan, R. J., Swail, V. R., and Sardeshmukh, P. D. 2013. Is the storminess in the twentieth century reanalysis really inconsistent with observations? A reply to the comment by Krueger et al. (2013b). Clim. Dyn. 42(3–4), 1113–1125. DOI:10.1007/s00382-013-1828-3.
- Wolf-Grosse, T., Esau, I. and Reuder, J. 2017. Sensitivity of local air quality to the interplay between small- and large-scale circulations: a large-eddy simulation study. Atmos. Chem. Phys. 17(11), 7261–7276. DOI:10.5194/acp-17-7261-2017.
- Wolf, T. and Esau, I. 2014. A proxy for air quality hazards under present and future climate conditions in Bergen, Norway. Urban Clim. 10, 801–814. DOI:10.1016/j.uclim.2014.10.006.
- Wolf, T., Esau, I. and Reuder, J. 2014. Analysis of the vertical temperature structure in the Bergen valley, Norway, and its connection to pollution episodes. J. Geophys. Res. Atmos. 119(18), 10645–10662. DOI:10.1002/2014JD022085.
- Woollings, T., Hoskins, B., Blackburn, M. and Berrisford, P. 2008. A new rossby wave-breaking interpretation of the North Atlantic oscillation. J. Atmos. Sci. 65(2), 609–626. DOI:10.1175/2007JAS2347.1.
- Woollings, T., Hannachi, A., Hoskins, B. and Turner, A. 2010. A regime view of the North Atlantic oscillation and its response to anthropogenic forcing. J. Clim. 23(6), 1291–1307. DOI:10.1175/2009JCLI3087.1.
- Woollings, T., Harvey, B. and Masato, G. 2014. Arctic warming, atmospheric blocking and cold European winters in CMIP5 models. Environ. Res. Lett. 9(1), 14002. DOI:10.1088/1748-9326/9/1/014002.
- World Climate Research Program. 2016. CMIP5 – Coupled Model intercomparison project phase 5 – overview. Online at: http://cmip-pcmdi.llnl.gov/cmip5/ (accessed 24 September 2016).
- Zilitinkevich, S. S., Elperin, T., Kleeorin, N., Rogachevskii, I. and Esau, I. 2013. A hierarchy of energy- and flux-budget (EFB) Turbulence Closure Models for Stably-Stratified Geophysical Flows. Boundary-Layer Meteorol. 146(3), 341–373. DOI:10.1007/s10546-012-9768-8.
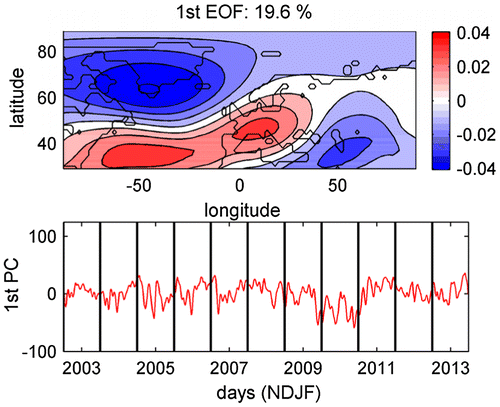
Appendix 1
Fig. A1. The dominating mode of variability of Za over the North Atlantic-European region. The top panel shows the first eigenvector of Cn (the first EOF). The bottom panel shows the time series of the expansion coefficient of the eigenvector (the first PC).