
 ?Mathematical formulae have been encoded as MathML and are displayed in this HTML version using MathJax in order to improve their display. Uncheck the box to turn MathJax off. This feature requires Javascript. Click on a formula to zoom.
Abstract
We investigate a reduced point vortex model for statistical and dynamical analyses of atmospheric blocking phenomena. Thereby, we consider High-over-low and Omega blocking as relative equilibria of two and three point vortices. Under certain conditions, such point vortex systems move westward opposing the mean westerly flow and hence can become stationary. Based on the kinematic vorticity number, two novel, independent methods, the contour and the trapezoid method, are introduced in order to identify the vortices that form the blocking pattern, their local positions and circulation magnitudes. While the contour method takes into account the observed stationarity of blocking, the trapezoid method minimizes the total circulation of the vortex system following point vortex theory. Using an instantaneous blocking index, a total number of 347 blocking periods were identified in NCEP-NCAR Reanalysis data for the Euro-Atlantic region during the time period 1990–2012. This procedure provides the basis to corroborate the applicability of the point vortex model to atmospheric blocking in a statistical framework. The calculated translation speed of point vortex systems associated with the atmospheric blocking appears to match the zonal mean velocity reasonably well. This model explains the stationary behaviour of blocking patterns. A comparison between the theoretical and a statistical model further reveals that the circulation of the blocking high follows the principles of the point vortex model to a large extent. However, the low-pressure systems behave more variable. Moreover, the stability of point vortex equilibria is analysed regarding the relative distances by considering linear stability analysis and simulations. This reveals that the point vortex blocking model corresponds to an unstable saddle point. Furthermore, we take viscosity and a Brownian motion into account to simulate the influence of the smaller, subgrid-scale disturbances. As a result, a clustering near the equilibrium state emerges indicating the persistence of the atmospheric blocking pattern.
1. Introduction
Blocking events are large-scale, quasi-stationary phenomena that persist from several days to weeks and block the jet stream and thus the westerly flow. In general, a blocked atmospheric flow field is characterized by a mid-tropospheric high-pressure system that lies polewards of one or two lows. The pattern is called High-over-low in case of two vortices and Omega blocking in case of three vortices due to the -shaped geopotential height isolines. Rex (Citation1950) was one of the first who defined and studied blocking. Since then many theories have been developed to describe blocking: Charney and DeVore (Citation1979) for example suggested that a metastable equilibrium state can be associated with blocking situations and Shutts (Citation1983) proposed an eddy straining mechanism for the reinforcement and maintenance of blocking. Also many indices have evolved to detect blocked situations mostly in gridded model data. Well-known examples include those from Tibaldi and Molteni (Citation1990) based on geopotential height gradients and from Pelly and Hoskins (Citation2003) who introduced the PV-
(Potential Vorticity - potential temperature) approach.
The persistent behaviour of blocking often causes extreme weather situations. An example of considerable impact is the Russian heatwave in summer 2010 which was accompanied by extreme rainfall in Pakistan (Galarneau et al., Citation2012). Despite their large and manifold impact on our society, numerical weather prediction models as well as climate models still need to be improved to produce adequate behaviour and appearance of blocking: blocking onsets frequently coincide with low forecast skill of numerical weather prediction models (Rodwell et al., Citation2013; Ferranti et al., Citation2015) and climate models often underestimate their frequency (Mitchell et al., Citation2017). These deficiencies are often ascribed to the still not sufficiently understood underlying dynamical mechanisms (e.g. Barnes et al., Citation2011; Yamazaki and Itoh, Citation2013; Luo et al., Citation2014; Pfahl et al., Citation2015; Kennedy et al., Citation2016).
Obukhov et al. (Citation1984) were the first who considered blocking as a constellation of point vortices that on its own translates westward and becomes stationary within a counteracting zonal westerly flow. Kuhlbrodt and Névir (Citation2000) further considered a latitudinal-dependent zonal mean flow resulting in a stable oscillation for dipole vortex constellations whose time scale corresponds to the oscillation of an exemplary High-over-low case. Further comparisons between case studies and point vortex systems also showed the transition from High-over-low to Omega blocking as well as the involvement of two neighbouring troughs in a four-vortex framework (Kuhlbrodt and Névir, Citation2000). More recently, Müller et al. (Citation2015) demonstrated for two exemplary blocked weather situations that the magnitude of the translation velocity matches that of the zonal mean flow and thereby confirmed the stationary weather pattern. A similar view is presented by Altenhoff et al. (Citation2008) regarding the blocking vortices as Potential Vorticity (PV) anomalies (instead of point vortices). These PV anomalies also counteract the ambient westerly flow leading to stationary conditions. This vortex perspective of blocking is complementary to other blocking theories, e.g. the development mechanism of blocking is often ascribed to Rossby wave breaking (Tyrlis and Hoskins, Citation2008). This mechanism enforces a transition from waves to vortices, supporting our vortex view.
Focusing on the stability of blocking, Faranda et al. (Citation2016) proposed that blocking can be attributed to an unstable saddle point of the atmospheric dynamics. In the vicinity of this unstable saddle point, clustering can occur manifesting in the persistence of blocking. This is fortified by Schubert and Lucarini (Citation2016) showing that the atmospheric circulation is more unstable during blocking in comparison to unblocked flow.
In this study, we will focus on the following research questions:
| (i) | Can the applicability of the point vortex model to atmospheric blocking (Müller et al., Citation2015) be statistically corroborated, i.e. do atmospheric blocking behave similar to the point vortex model in general? | ||||
| (ii) | Which dynamical characteristics of blocking can be represented with the point vortex model? | ||||
| (iii) | How sensitive is the point vortex model to perturbations and what implications can be derived for its stability? | ||||
Finally, a summary and discussion will be given in Section 7.
2. The dynamical point vortex blocking model
The theory of point vortices is characterized by the interaction of discrete vortices under the idealized conditions of a two-dimensional, incompressible, inviscid flow. Mathematically, it is represented by a system of coupled non-linear ordinary differential equations. Each point vortex is determined by its circulation , i.e. its strength and its location
. The circulation is determined by the integral of the vertical vorticity
over the vortex area element A in the horizontal plane:
(1)
(1)
The circulation can either be positive or negative corresponding to cyclonic or anticyclonic rotation. While the circulation is constant for each point vortex, the vorticity field is infinite at the point vortex locations and zero elsewhere. The equations of motion for n point vortices are given by Helmholtz (Citation1858):(2)
(2)
where denotes the distance between two point vortices i and j. Thereby, each point vortex i induces a velocity field that decreases with
. The superposition of the velocity fields induced by each point vortex then determines the motion of each vortex. Such point vortex systems conserve the horizontal Kelvin momenta, the angular momentum as well as the kinetic energy and therefore satisfy important physical characteristicsof many fluid dynamical systems (see e.g. Müller et al., Citation2015). In general, point vortex systems rotate around their centre of circulation
(3)
(3)
which is conserved due to the conservation of the Kelvin momenta. For systems with vanishing total circulation the centre of circulation moves to infinity. As a result, the system translates uniformly. An example of the motion of
point vortices with
arranged on an equilateral triangle is illustrated in Fig. .
Figure 1. Schematic illustration of the interaction of three point vortices arranged according to the atmospheric Omega pattern, where the circles indicate the direction and relative strength of rotation. The dotted arrows represent the influence of the other two vortices on the velocity of the corresponding point vortex. Their vector addition given by the solid lines represents the resulting velocity vector for the corresponding vortex. The anti-cyclonic vortex (red) is assumed to be twice as strong as the cyclonic vortices (blue); therefore the induced velocity field is stronger. This interaction can also be derived from Equations Equation2(2)
(2) .
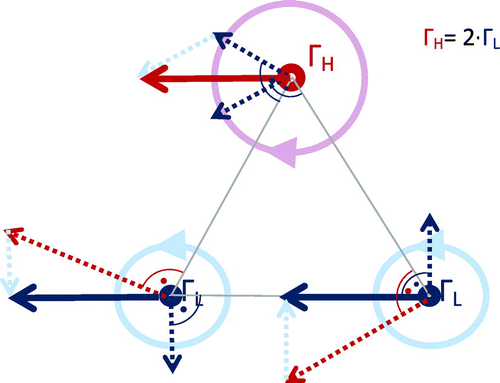
Figure 2. (Left) Two exemplary blocking events, one resembling an Omega (top) and the other a High-over-low (bottom). Shown are the vorticity (coloured) and the geopotential height isolines (grey isolines in 8 dm intervals, bold line represents the 552 dm line) at 500 hPa. (Right) Illustration how the corresponding blocking can be realized in the point vortex model. Upper right figure by courtesy of Müller et al. (Citation2015).
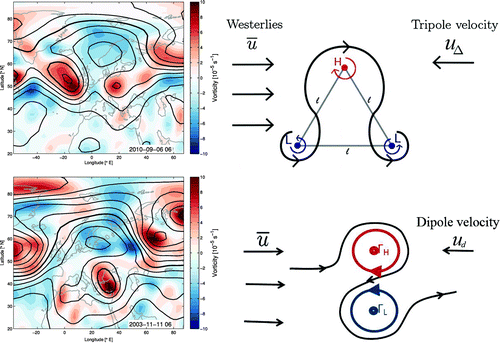
Figure 3. Schematic diagram and comparison of the set-ups of the two different approaches of the contour method and the trapezoid method to determine the vortex properties. Grey-shaded boxes indicate the temporally averaged fields over one blocking period.
Alternatively, point vortex systems can be described by their intervortical distances as state variables, denoted as equations of relative motion (Gröbli, Citation1877; Aref, Citation1979; Newton, Citation2001):
(4)
(4)
where describes the area and
the orientation of the triangle composed of three vortices i, j and k. Thereby,
is defined as
for a counter-clockwise order of i, j, k and
for a clockwise order. Point vortex constellations that translate or rotate uniformly by preserving their relative constellation are called relative equilibria and correspond to fixed points in the framework of the relative motion, i.e. the distances remain constant. The point vortex constellation given in Fig. corresponds to a relative equilibrium due to the equilateral arrangement. Moreover, assuming
, the point vortex system translates uniformly. In case of
, the point vortex constellation rotates around its centre of circulation (Equation3
(3)
(3) ) but, as in the first case, the intervortical distances remain constant. Both states are relative equilibria. For a more detailed overview on the theory of point vortices, we refer to Newton (Citation2001), Aref (Citation2007) and Müller et al. (Citation2015).
The quasi-two-dimensional behaviour of atmospheric blocking allows for the representation of large-scale vortices by point vortices as suggested by Obukhov et al. (Citation1984). This reduces the atmospheric flow field to a dynamical system described by ordinary differential equations.
Figure 4. Composites of (a, b) High-over-low blockings and (c, d) all Omega blockings that were identified by the (a, c) contour and (b, d) trapezoid method from 347 blockings during 1990–2012. The mean positions and circulations (in ) of the identified blocking vortices are marked (circles, rectangles and triangle). The
field is shown for the contour method and the
field for the trapezoid method. Also, the geopotential height field is shown as grey isolines in 8 dm intervals at 500 hPa, where the bold line represents the 552 dm line.
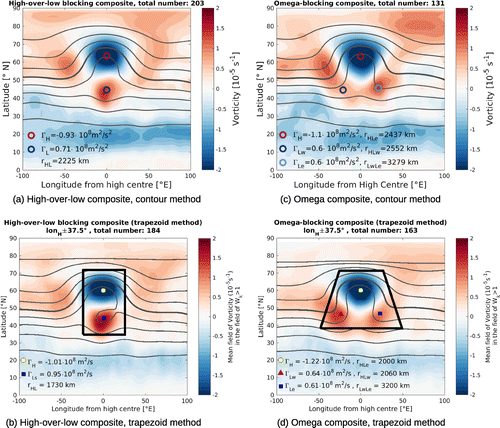
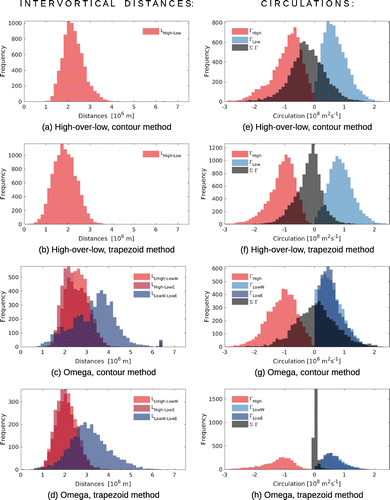
Figure 5. Histogram of the distances l between the vortices (a-d) and the circulations (e-h) of the single-time steps for High-over-low and Omega blocking as analysed with the (a,c,e,g) contour method and (b,d,f,h) trapezoid method. Due to overlapping distributions, the colours accordingly appear darker.
Thereby, we identify the high-pressure system as anticyclonic point vortex and the low-pressure systems as cyclonic point vortices. The point vortex systems representing the High-over-low and Omega blocking, respectively, are illustrated in Fig. . In the High-over-low case, the circulations of the two vortices have the same absolute value with opposite signs (
), whereas for the Omega case the absolute value of the circulation of the anticyclonic vortex (
) is equal to the sum of the circulation of the two cyclonic vortices (
, see also Fig. for the Omega case). Both cases are characterized by their vanishing total circulation
which provoke the translation of the systems (see (Equation3
(3)
(3) )). For uniform westward translation, the vortices are located on an equilateral triangle for the Omega case and on the same longitude for the High-over-low case. Under these conditions (
, equilateral triangle), such point vortex constellations correspond to relative equilibria and translate westwards with dipole velocity
for the High-over-low model and tripole velocity
for the Omega case (Newton, Citation2001):
(5)
(5)
(6)
(6)
where and
is the unit vector pointing to the east. For atmospheric blocking, the zonal mean westerly flow
counteracts this westward translation of the point vortex system. As a result, the system can become stationary, if the two velocities are of same magnitude:
(7)
(7)
It is emphasized that the translation velocities and
correspond to the theoretical translation of a corresponding point vortex dipole/tripole. The actual, observable translation of a non-stationary blocking system will be denoted as
.
3. Data and methods
3.1. Data and zonal mean flow
To analyse blocking systems, the NCEP-NCAR Reanalysis (Kalnay et al., Citation1996) is used with a horizontal grid spacing of and a temporal resolution of 6 h. We restricted the analysis to blocking patterns centred within
(approximately the Euro-Atlantic sector) occurring in the years 1990–2012. For the analysis, we used the geopotential height and horizontal wind fields at the 500 hPa-level. The zonal mean flow
is determined as the zonal average of the global, zonal wind component within
.
3.2. Identification of blocking periods
At first, the time periods of blocked atmospheric flows are identified using the Instantaneous Blocking Index (IBL) which is implemented on the Freie Universität Berlin Evaluation System (see Freva, Citation2017; Richling et al., Citation2015, for more details). The blocking index is based on the 500 hPa geopotential height gradient, similar to the detection method from Tibaldi and Molteni (Citation1990) combined with the approach of a seasonal and longitudinal varying reference latitude which represents the position of the weather system activity (Pelly and Hoskins, Citation2003; Barriopedro et al., Citation2010; Barnes et al., Citation2011). Only those IBLs are considered as blocking periods that extend over at least longitudes with one (or more) longitudes blocked for a minimum of five days. Moreover, we determine an
as the longitude that is blocked most frequently during one blocking period. This
gives an approximate longitudinal location of the blocking.Footnote1
3.3. Identification of rotational flow using the kinematic vorticity number
In a next step, we searched for prevalent rotational flow (i.e. vortices) in the identified blocking periods. The search procedure is based on the dimensionless kinematic vorticity number which was introduced by Truesdell (Citation1953) as(8)
(8)
for three dimensions. Here, and
are the symmetric and antisymmetric tensors of the velocity gradient tensor
. Recently, the kinematic vorticity number was successfully applied to atmospheric data-sets of different resolutions in order to identify vortices on two-dimensional surfaces by Schielicke et al. (Citation2016) and Schielicke (Citation2017). Explicitly, it reads:
(9)
(9)
which can be evaluated at every point in the field and is used in this analysis. Here, is the vertical vorticity,
denotes the horizontal divergence,
defines the stretching deformation and
denotes the shearing deformation. Hence,
as well as
characterize the relation between rotation, deformation and shearing of a flow (see Schielicke et al., Citation2016; Schielicke, Citation2017, for more details). We differentiate three cases:
Table
As a result, rotational flow is identified as simply connected region of which is used to define a vortex. For further analysis, we will only consider the vorticity field
where
, and the other vorticity values are set to zero. This field will be called
. It represents a field of vortices that were cut out from the continuous flow field.
Figure 6. Scatter plot of the circulations (averaged for each blocking period) for comparing the two methods. Only situations have been considered, where both methods classify the period either as High-over-low or as Omega blocking. The dashed line shows the ideal case, the bisecting line. The correlation coefficients are displayed in corresponding colours.
![Figure 6. Scatter plot of the circulations [m2s-1] (averaged for each blocking period) for comparing the two methods. Only situations have been considered, where both methods classify the period either as High-over-low or as Omega blocking. The dashed line shows the ideal case, the bisecting line. The correlation coefficients are displayed in corresponding colours.](/cms/asset/6c967533-0d02-4365-85c1-719f5dac1558/zela_a_1458565_f0006_oc.gif)
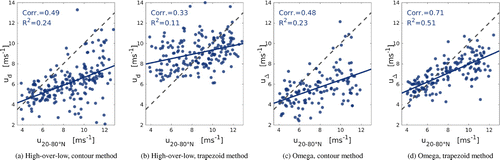
Figure 7. Scatter plot of the velocities and
with the zonal mean zonal velocity
averaged over
. The grey-dashed line indicates the bisecting line, the blue line shows the linear regression.
3.4. Block properties: vortex centres, circulations and intervortical distances
Under the assumption that we know the exact size of a vortex, we can determine vortex properties such as the circulation and the vortex centre in the following way: The circulation of vortex i is computed as the area weighted sum of vorticity as approximation to (Equation1
(1)
(1) ):
(10)
(10)
where we sum over all n grid boxes that form vortex i.
corresponds to the circulation of each grid box k, that is approximated as the product of the vorticity
and the area
of this grid box. For each vortex i the location of its vortex centre
is calculated likewise to the centre of circulation of a point vortex system (Equation3
(3)
(3) ) as the circulation centre of all n grid boxes belonging to the area of the vortex i:
(11)
(11)
where k represents the grid box index of all grid boxes n belonging to the area of vortex i. Although, this definition is similar to the definition of the circulation centre of a point vortex systems, the latter is defined as centre of all n point vortices, while the vortex centre is the circulation centre of a single-extended vortex.
The intervortical distances between two vortices i and j are calculated as secants through the vortex centres.
3.5. Two methods for the identification and extraction of High-over-low and Omega blocking
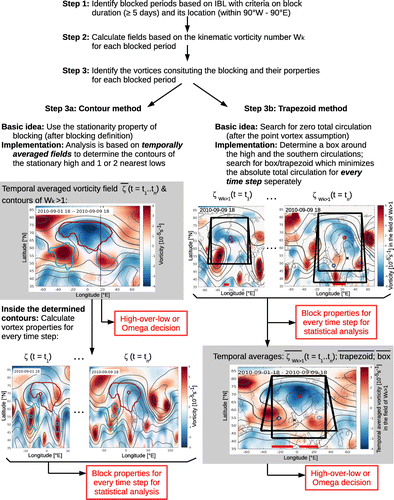
The most challenging part is to determine the properties – especially the areas – of the vortices that constitute the blocking in an automated and objective way. Since the vortex circulations and locations depend on the area of a vortex this is an essential, but non-trivial step. A definition of a vortex and its intensity is still lacking and the research in this field is still ongoing (Jeong and Hussain, Citation1995; Neu et al., Citation2013). The circulation is a possible measure of vortex intensity. Despite its advantage as global measure of rotation, it is only rarely used in the study of atmospheric vortices. One of the rare publications using the circulation is the cyclone identification method of Sinclair (Citation1997). The method introduced in Schielicke et al. (Citation2016) and Schielicke (Citation2017) presents another way to identify vortex circulations successfully and in a consistent manner throughout the atmosphere. Since this topic is a current field of research, we will introduce two novel methods in the following, the contour method and the trapezoid method, that have different approaches to determine the vortex properties and distinguish between High-over-low and Omega blocking. We chose to use two methods because of two reasons. First, the methods are independent and based on two different aspects of blocking: The contour method is mainly based on the observation that blocking patterns are stationary and the trapezoid method searches for vanishing total circulation of the vortex system which is in accordance with the theoretical point vortex model. Hence, the contour method rather mirrors the observation, while the trapezoid method is rather connected to the theoretical point vortex model assumption. Second, both methods have advantages as well as flaws. For example due to stationary vortex areas the contour method, in contrast to the trapezoid method, does not allow for translating blocking systems. Comparing the results of the two different methods allows us to better estimate the reliability of our analysis. A schematic diagram illustrating the different approaches of the two methods is shown in Fig. . In the following, we will refer to a maximum (minimum) of geopotential height or an area of negative (positive) vorticity as high (low).
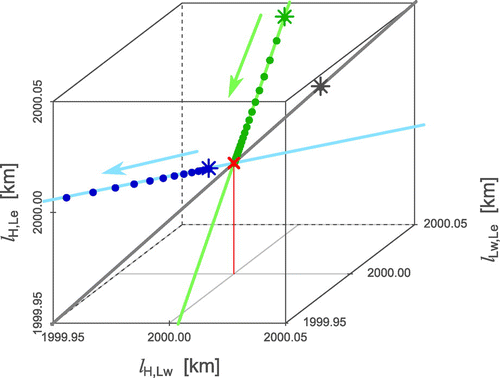
Figure 8. Phase space of relative distances . The fixed point is marked as red cross and the three eigenvectors are displayed as green (stable), blue (unstable) and grey (neutral) lines. Three exemplary trajectories are displayed as points. The elapsed time between two consecutive points corresponds to 8 h. The initial condition is marked as star in corresponding colour. Note that the grey trajectory lies on the neutral eigenvector at the initial position and is therefore stationary.
3.5.1. Contour method
The contour method is based on the vorticity and deformation fields temporally averaged over each blocking period separately. The criterion is applied to these averaged fields. Coherent areas of
ideally represent isolated, persistent and stationary highs (abbreviated as H) or lows (abbreviated as L). As these areas are identified by their enclosing outline, we refer to them as contours. See Fig. for an example (Step 3a). Based on the averaged fields, we obtain a mask of averaged vortices for each blocking period (Fig. , Step 3a middle). Vortex centres
, circulations
and distances
with
of these vortices are calculated for the following identification of the vortices constituting the blocking.
| (1) | Determining the high of the block: The high is determined by the contour with the smallest (negative) circulation that contains the | ||||||||||||||||||||||
| (2) | Determining the low(s): The following criteria (i)–(iii) are applied for selecting the cyclonic vortices:
| ||||||||||||||||||||||
| (3) | High-over-low vs. Omega blocking decision: If only one vortex is left at this point and | ||||||||||||||||||||||
| (4) | Calculating the block properties for 6-hourly time steps: For the statistical analysis, we will calculate the block properties, i.e. the vortex centres, circulations and intervortical distances, on a 6-hourly basis. Therefore, the mask of stationary vortex contours of each blocking period will be reduced to the areas of the identified vortices which constitute the blocking. Then the block properties are derived by evaluating the 6-hourly vorticity fields inside this mask (Step 3a, bottom, in Fig. ). For cyclonic (anticyclonic) vortices, only positive (negative) vorticity values are considered within the corresponding contour. | ||||||||||||||||||||||
3.5.2. Trapezoid method
In contrast to the previous discussed method, the basic concept of the trapezoid method is to determine the area of the blocking by a box/trapezoid that minimizes the total absolute circulation within the shape following the method of Müller et al. (Citation2015). The name of the method stems from appearance of the shape around the vortices as either box or trapezoid in a regular latitude–longitude grid or mercator projection. The upper part of the box/trapezoid corresponds to the high, while the lower part of the box in case of a High-over-low blocking pattern and the lower left and right parts of the trapezoid in case of an Omega blocking correspond to the one, and two lows, respectively.
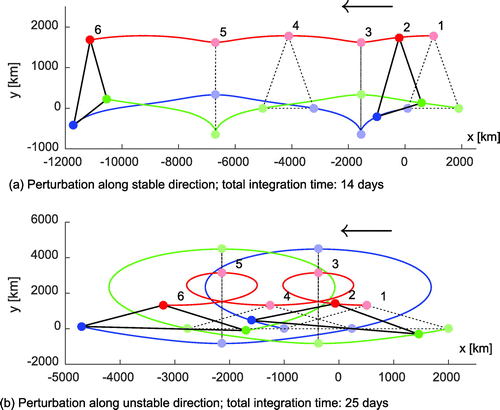
Figure 9. Simulations of two point vortex systems applying realistic atmospheric conditions. The initial triangles (1) are disturbed from the relative equilibrium of the equilateral triangle of side length
km. The distance between the two lows is (a) decreased with
km, (b) increased with
km. The coloured lines mark the trajectories of the corresponding point vortices. Some exemplary triangle constellations 1–6 as realized in the simulations are added for the following times: (a)
days; (b) for
days. When they appear after the equilateral triangle constellation (constellation 1 and 4) and before the trilinear constellation (constellations 3 and 5), the triangles are changed according to the unstable direction, as e.g. constellation 2. Triangles, changed in the stable direction exist after the trilinear constellation and before the equilateral triangle constellation, as e.g. constellation 6.
For each single time step of a blocking period, we determine both shapes (box/trapezoid) on basis of the fields and the corresponding circulation fields which are calculated by Equation (Equation10
(10)
(10) ) for every single grid point. The procedure is calculated twice (round 1 and 2) over each blocking period in the following manner (see Fig. , Step 3b).
| (1) | Determining the high of the block: First, we determine a box around the high. This is done by iteratively searching for the circulation centre of negative circulations in a certain region. As a starting point, we search for the circulation centre in a region (round 1) around the IBL | ||||
| (2) | Determining the lows: In the second step, we determine two shapes: a box for a possible High-over-low blocking and a trapezoid for a possible Omega blocking for each time step (Fig. , Step 3b middle). The decision between these two blocking patterns follows later in the last step. The box and the trapezoid are independently derived in the following manner. For the box, we allow the southern border of the box around the high derived in (1) to change stepwise in 2.5 | ||||
| (3) | Calculating the block properties for 6-hourly time steps: For each time step of each period, the box and the trapezoid minimizing the absolute total circulation are stored and the block properties are calculated (Fig., Step 3b middle) for later statistical analysis. | ||||
| (4) | High-over-low vs. Omega blocking decision: The decision if the blocking is either a High-over-low or an Omega blocking pattern is derived on basis of the temporally averaged fields for each blocking period (Fig., Step 3b bottom). We calculated the positive circulation as a function of the longitude in a specific range | ||||
Figure 10. Intervortical distances of the point vortex system of an exemplary simulation with friction as in Zhu and Cheng (Citation2010). Initial set-up of the distances was
km. Random numbers were drawn from a normal Gaussian distribution of zero mean and standard deviation
km using R function set.seed(12345) in order to estimate the Brownian motion. The other initial conditions are described in the text.
3.6. Translation velocities
The translation velocity of the point vortex equilibria is computed according to (Equation5(5)
(5) ) and (Equation6
(6)
(6) ). In case of the High-over-low blocking, (Equation5
(5)
(5) ) presumes both circulations to have the same absolute value. To account for deviations from this assumption, we will use the averaged absolute value of the circulations of the two vortices in the identified High-over-low cases. In case of the Omega blocking, point vortex theory assumes that the vortices are arranged on an equilateral triangle of side length l. For the identified Omega blocking, we will use the average of the three intervortical distances for l in (Equation6
(6)
(6) ).
4. Statistical analysis of the constituting blocking parameters based on NCEP data
In this section, we will present a climatology of the averaged and 6-hourly block properties (composites, circulations and intervortical distance) of High-over-low and Omega blocking in the Euro-Atlantic sector for the years 1990–2012. The statistical analysis is based on the NCEP reanalysis data and the constituting vortices were identified with the methods described in Section 3.5.1. We compare the results between the two methods to estimate their reliability. Furthermore, we will calculate the translation velocities and compare these to the zonal mean flow. Finally, we will shortly discuss the results and the methods.
4.1. Results
4.1.1. Composites and averaged blocking properties
The identification method (Section 3.2) found a total of 347 blocking periods during the time period 1990–2012 in the chosen area. With help of the contour method (Section 3.5.1), we identified 203 of these blocking periods as High-over-low and 131 as Omega blocking periods (see Table ). For the remaining 13 blocking periods, the method was not able to classify the pattern and these periods were disregarded. The trapezoid method classified a little less High-over-low (184) and more Omega (163) periods. About two thirds of all blocking periods were identified identically by both methods as either High-over-low or Omega blocking. However, a significant number of periods (118) were assigned differently by the two methods.
Table 1. Overview of the number of blocking periods as classified by the two methods. The last column gives the number of blocking periods, that were identified as either High-over-low or Omega by both methods.
The composites for all Omega blocking and all High-over-lows are displayed in Fig. . Thereby the average high centre of each blocking period is relocated to to enable a comparison between periods located at different longitudes. The flow in Fig. a (contour method) is dominated by a High-over-low structure, the average strength of the high is slightly stronger than the low. For the trapezoid method (see Fig. b) a similar field is visible. The vortex circulations are, however, slightly stronger than for the contour method and the vortex strengths are more similar between the high and the low. The average vortex centres lie sufficiently well near the regions of the vorticity extrema. The average box of the trapezoid method adequately contains the two vortex structures of the blocking. A distinct pattern of enclosed vortices representing the Omega blocking in Fig. c and d (contour and trapezoid method) is less pronounced. Instead, a band of positive vorticity from south-west to south-east of the blocking anticyclone is visible. A relative minimum of vorticity is, however, visible in this band directly south of the anticyclone. The average locations of the high centres are approximately centred in the vorticity minimum. For the contour method, the eastern low centre also fits well with the eastern vorticity maximum. The western vorticity maximum is more elongated and lies further northward, and is not captured by the western low centre. Similar structures are visible in the composite for the trapezoid method. The western vorticity maximum, however, fits well with the western vortex centre. The average trapezoid also captures most of the vortex structures. In case of the Omega blocks, the condition of vanishing total circulation is approximately satisfied for the contour method (
) and for the trapezoid method (
).
4.1.2. Intervortical distances (6-hourly time steps)
The distances between the two vortices of the High-over-low blocking peak around 2200 km and 2000 km for the contour and the trapezoid method (see Fig. a and b). While this distribution is approximately retained for the distances between the high and the lows of the Omega blocking, the distances between the two lows are significantly larger and more broadly distributed for both methods (see Fig. c and d).
4.1.3. Circulations (6-hourly time steps)
For the High-over-low configurations from the contour method (Fig. e), the maximum of the total circulation lies approximately centred at , suggesting that the High-over-low anticyclone is slightly stronger than the cyclonic vortex. For the trapezoid method (Fig. f), the total circulation peaks at zero indicating that both vortices have similar strength. For the Omega blocking (Fig. g,h), the distributions of the two low-pressure systems are similar and the distributions of the total circulations
are centred around zero. For the contour method, the distribution is relatively broad, whereas the trapezoid method yields a very thin distribution. Because the minimized total circulation was chosen as constraint for the trapezoid selection, this is expected.
4.1.4. Comparison of the two methods
A comparison of the circulations averaged over each blocking period from the two methods is displayed in Fig. , as well as the correlations. For the high-pressure systems, both methods yield similar results and are also relatively strongly (0.68) correlated. Nonetheless, the circulations are far from identical between the two methods, as strong deviations from the bisecting line are visible. The circulations of the low-pressure systems for the Omega cases have similar magnitudes, but are only weakly correlated. For the High-over-low periods, the correlation is slightly larger (0.48) and a strong variability is still visible. This analysis also shows that the contour method yields generally smaller absolute values for the circulations, especially for the high and the High-over-low lows. The composites (Fig. ) and the histograms (Fig. a-d) also exhibit generally larger intervortical distances for the contour method compared to the trapezoid method.
4.1.5. Comparing translation velocity and zonal mean flow
A central meteorological focus is the examination of the steady state of the blocked vortex configuration. Therefore, we compare the translation velocity magnitudes and
with the zonal mean flow
. Under the assumption of stationary blocking conditions, ideally, the absolute values of the translation velocity and zonal mean flow should be equal, i.e. the values of the corresponding scatter plots in Fig. should lie on the bisecting line for stationary blocking systems. We see, that the magnitudes of
and
match those of
. For Omega situations identified by the trapezoid methods, the velocity values lie near the bisecting line (see Fig. c). A significantly positive slope follows from a linear regression estimate with a correlation of 0.71. However, the linear regression differs considerably from the bisecting line: especially for large zonal mean velocities,
is smaller than
. For the High-over-low cases (for both methods) and the Omega situations from the contour method (Fig. a-c), also positive regression lines and correlations are visible. Although the contour method shows a slightly larger correlation in the High-over-low cases than the trapezoid method, the relationships between the two velocities are not as strong. We also considered different latitudinal regions for the determination of the
. While decreasing the band of latitudes generally increases
, the overall relations to
were only slightly modified.
So far the blocking systems have been assumed to be stationary. Yet many blocking translate slowly east- or westward, and it is interesting to study the relation between this observed translation and the difference
between the theoretical translation
/
and the zonal mean flow
. This difference is also visible in Fig. a, c, d, which shows that the
/
is generally smaller than
. This suggests the possibility of more eastward propagating blocking systems. Examples (Omega blocking analysed with the trapezoid method) confirmed, that positive/negative
correspond to observed east-/westward translation
of the actual blocking system. Yet due to high variability of the blocking positions as analysed with the trapezoid method and the thereby arising difficulty in determining the translation
, no statistically significant results could be obtained.
4.2. Discussion of the statistical results and methods
We determined the areas of the blocking vortices with the contour and the trapezoid methods, i.e. two methods with different approaches. The contour method takes stationary persistent vortex structures over the whole blocking periods into account. Hence, it is rather related to the assumption that the blocking is formed by (the same) stationary vortices. In contrast, the trapezoid method selects the actual vortex areas at each time step with the constraint of minimum total circulation inside the trapezoidal pattern. This can lead to intersected lows in some cases. As a result, the composite of Omega blocking also seems to bisect the western low. Due to the scale-dependent structure of vortices this is not necessarily inappropriate. Furthermore, the blocking pattern can be formed by different individual vortices. Since both methods are based on assumptions, that are not necessarily valid (e.g. stationary vortex structures), each have their flaws and benefits. Using two different methods has the advantage that we are able to evaluate the robustness of our results by comparing the outcomes of the two methods. We observed that the circulations of the highs are well-correlated between both methods, but significant variability exists. Therefore, the circulations of the high contain a significant uncertainty but are somewhat robust. The circulations of the lows (especially for Omega situations) show a lower correlation (Fig. ) which suggests that the lows are more difficult to capture and their assigned circulations are less certain. A possible explanation concerning the dynamics of this behaviour could be a larger variability of the locations of the lows in the Omega blocking cases. The difficulty in capturing the areas of the low-pressure systems also causes higher uncertainties in the position of the vortices. This higher variability is also congruent with the observed band of positive vorticity south of the high for the Omega cases with only a weak gap in between the two lows. Possibly, there are more than 3 vortices involved or the real triangular arrangement of the vortices forming the Omega blocking could be a rotated Omega state such that the arrangement resembles a High-over-low with an additional second low located west or east of the High-over-low. It also indicates a possible transition between High-over-low and Omega configurations.
Furthermore, this transition might obscure the blocking classification by the two methods since its definition is quite strict: a blocking period is either identified as High-over-low or Omega blocking, but not both. Consequently, the two methods do not agree on the blocking type for a large number of periods. Further ambiguous periods involve more than two cyclonic vortices or two small vortex structures that can be interpreted as one. This emphasizes the difficulty in discerning the blocking types which manifests in the large number of opposing classification by the two methods. Nonetheless, the composites show a clear High-over-low structure and a discernible Omega structure. We infer that the periods, with many ambiguous ones, have been sufficiently well classified by both methods. Further research regarding the High-over-low vs. Omega blocking decision is a topic of future work.
Both methods are subject to setting some more or less arbitrary thresholds. We have chosen these thresholds as a result of subjective considerations. While small modifications to these thresholds alter single blocking periods, the composites are not strongly sensitive (not shown). An ideal point vortex Omega blocking requires an equilateral triangle. However, using reanalysis data-sets, we find that this is only approximately realized in the Omega blocking because the distance between the two lows is considerably larger than the distance between the high and the lows. We will further investigate such modifications of the point vortex equilibrium in Section 6. The condition of vanishing total circulation is approximately satisfied, although the variability especially for the contour method is quite large. Given the above described uncertainties underlying the methods, the relation between the calculated translation velocity /
and the mean zonal flow
is a strong confirmation that the point vortex model is a limited, but reasonable description of atmospheric blocking. To further corroborate the applicability of the point vortex systems to blocking, a statistical model of the blocking vortex system is considered and compared to the theoretical model in the following section.
5. Comparison of the theoretical and a statistical model of Omega blocking
The results derived in the previous section allows for a statistical model that can be compared to the analytic solution of the point vortex equation in a relative equilibrium. The tripole/dipole translation velocity /
of the theoretical point vortex model given in (Equation6
(6)
(6) )/(Equation5
(5)
(5) ) depends on the circulations and the intervortical distances. Thus, the questions arise if one of these parameters contribute more to the relationship between the zonal mean flow
and
than others and how well the theoretical relationship of (Equation6
(6)
(6) )/(Equation5
(5)
(5) ) fits to the observed one. We dealt with these questions with a multiple linear regression model (Wilks, Citation2005). At first, we will apply this to the Omega situations, then to the High-over-low periods.
5.1. Set-up of the theoretical and statistical models
By considering only the behaviour near a reference point , (Equation6
(6)
(6) ) can be approximated by a Taylor series expansion. As reference point we choose:
, where the bar above the variables denotes the average of the corresponding variable calculated from the methods. The indices stand for H: the high, Lw: the westerly low, Le: the easterly low, and
is the average of the three intervortical distances
,
,
. Then, the first-order Taylor series for the tripole translation velocity reads:
(13)
(13)
where with
are the corresponding derivatives at the reference point
. For example,
is given by:
Using the averaged values at the reference point, the become constants. In a next step, we assume
to have the same absolute value as
. Then the above linearized theoretical Equation (Equation13
(13)
(13) ) can be compared to the following model for a multiple linear regression:
The values denote the corresponding regression estimates. In the case that the observed blocking, i.e. the determined values obtained from the contour and trapezoid methods, behave accordingly to the theoretical model, the
values should coincide with the
values. Note, that we assumed that the blocking is stationary and consists of an equilateral constellation with the average intervortical distance as lateral length.
For the trapezoid method, the total circulation is close to zero for most periods. This means, that one of the three vortex circulations can be expressed by the other two, i.e. the three circulations are not independent. Therefore, we eliminated in (Equation6
(6)
(6) ), by substituting
and correspondingly adapt the computation of
. Then, we use
as regression model. Note that it would also be possible to eliminate instead one of the other two circulations. For the contour method, we did not apply this reduction, since the criterion of vanishing total circulation is not fulfilled as strongly.
For the High-over-low situations, this can be applied in an analogous way based on from (Equation5
(5)
(5) ). However, since the theory assumes
, we consider
as the average of the absolute values of
and
.
for example is then determined as
. Consequently, our regression model reads
.
5.2. Results and discussion
The values are summarized in Tables and . For Omega situations from the contour method, all regression estimates fit well with the theoretical
values aside from l. The p-values of
and
(0.01 and 0.02) signify that their regression estimates are also statistically significant. The p-value of
implies only a weakly statistically significant regression estimate. For the distance l, we cannot confirm a statistical relationship between l and
due to a large p-value. The trapezoid method yields merely a statistically significant, concurring relationship for
of Omega periods. We note that due to the distributions of the circulations and distances (Fig. ) also the
’s contain some uncertainty. Thus, it is also interesting that the intercept and distance l show an
of the same order of magnitude as the corresponding, statistically significant regression estimate. For
, the relationship is statistically not significant. For High-over-low situations, the trapezoid method gives a congruent regression estimate with high significance for
which we computed as the average of the absolute circulations of the two High-over-low vortices. Although
from the contour method does not lie within the error interval, it is of same order of magnitude as its statistically significant regression estimate. So assuming some degree of uncertainty in
, we infer that
and
approximately coincide. While the intercepts of both methods from High-over-low situations are also statistically significant (p-values of 0.02 and 0.04),
is clearly larger, but still within the approximate order of magnitude. The
and
values for the distance from the contour method do, however, not coincide despite statistically significant regression estimates. Its equivalent from the trapezoid method is not statistically significant.
Table 2. Results of the multiple linear regression for Omega blocking. The values show the coefficients of the linearized point vortex equations and the
values denote the estimates from the linear regression. Small p-values indicate more significant regression estimates. For the contour/trapezoid method, the regression models yield an adjusted
of 0.28/0.50.
Table 3. As Table , but for High-over-low situations. The adjusted of the regression model are 0.39 and 0.48 for the contour and trapezoid method respectively.
So we can confirm the relationship between and
with statistical significance for all situations. For the circulations of the lows, significant relations are revealed for High-over-low situations and also for Omega situations as identified by the contour method. The distances could not be proved to relate to
according to our model. We note, that some of the inconclusive results possibly emanate from several assumptions and uncertainties that underlie this regression analysis: We assumed an equilateral triangle constellation although this condition is not fulfilled (see Fig. c,d). In Section 4, we also found indications for a high variability and uncertainty in the low-pressure systems (weak consensus between the two methods) and therefore also in the intervortical distances. This possibly causes the insignificant regression estimates for the distances. We further assume that the blocking systems are stationary. Examples showed, however, that this has only limited validity. This possibly manifests in the inconsistent intercepts. Another restriction is embedded in the Taylor series of first order. This means, that only linear relations are taken into account.
We also note, that the of the different regression analyses lie within 0.28 to 0.50. This value gives the amount of variability, that is explained by the model. It suggests, that only up to half of the variability of
is explained by our model. Also the residuals show non-random patterns (not shown), indicating additional deterministic behaviour of
. This means that the chosen predictors (
) are not sufficient to predict
. However, while for usual applications of regression models, the aim is to predict the predictand (
here) in the best possible way, we instead target the relationship between
and the selected predictors for a comparison to the theoretical point vortex model. Consequently, we did not expect to yield an optimal prediction of the zonal mean flow anyway.
In summary, we confirm with statistical significance that the circulation of the high and to some extent also the circulations of the lows relate to according to the point vortex model. Given the uncertainties and limitations of the model, this is a remarkable result that validates the applicability of the point vortex model to atmospheric blocking.
6. A stability analysis approach of blocked systems
A remaining challenge in the context of large-scale atmospheric dynamics is the analysis of the stability of the blocking phenomenon. For example, Rodwell et al. (Citation2013) state that weather prediction models often fail to capture the onset and decay of blockings. So we will now examine (i) the stability of blockings in terms of the Lyapunov stability of point vortex equilibria and by perturbing the side lengths of the equilateral triangle in accordance with the climatological results of Section 4 and (ii) the clustering behaviour close to the relative equilibrium state by modelling the influence of smaller, subgrid-scale disturbances as Brownian motion.
6.1. Stability considerations
In Section 4, we found that the distances between the three blocking vortices as computed with the contour and trapezoid method do not show an equilateral triangle. We will now analyse how such deviations from the equilateral triangle affect the point vortex system. In the following, the equations of motion for the relative distances (Equation4(4)
(4) ) are applied to represent the equilateral triangle constellation as a fixed point in the phase space spanned by the three relative (intervortical) distances
with
. An analysis considering the Lyapunov stability (see e.g. Strogatz, Citation2015) can then give information on the stability properties of the fixed point. A detailed derivation of this stability analysis can be found in the supplementary material (Section 2). A similar study has already been conducted by Synge (Citation1949) (using trilinear coordinates) resulting in the following condition for stability:
For the relations of the circulations according to the atmospheric blocking model, i.e. ,
, the above stability criterion is not satisfied resulting in an unstable fixed point with
. Thus, within the vicinity of the fixed point, deviations from the fixed point increase exponentially in time. More precisely, the fixed point corresponds to a saddle pointFootnote3 with one neutral, one unstable and one stable direction. This is illustrated in Fig. , where three simulated trajectories are displayed in the vicinity of a fixed point (red cross). Each simulation is initialized at a perturbed state lying on the direction of an eigenvector. For the unstable case, the trajectory departs from the equilibrium constellation, whereas the stable trajectory converges towards the equilibrium. The neutral case corresponds to the uniform expansion of the equilateral triangle, which results again in a fixed point. However, trajectories, that do not start directly on the stable or neutral direction, are unstable. Therefore, the fixed point is unstable. See the supplementary material (Section 2), Synge (Citation1949) or Tavantzis and Ting (Citation1988) for further information.
6.1.1. Model set-up
To illustrate the non-linear behaviour of the initially unstable motion in the configuration space the positions of the point vortices have been simulated with perturbed equilateral triangles. In accordance with the results obtained from the NCEP statistics (Section 4, Fig. c,e), the circulations of the vortices were set to
/s and the side length of the equilateral triangle was set to 2000 km. The integration is carried out by a Runge–Kutta method of fourth order as implemented in Matlab (MATLAB, Citation2013). We used two different perturbed set-ups shown in Fig. a,b denoted as constellation 1. In the first simulation (Fig. a), we decreased the initial distance between the two lows to 1800 km. In the second set-up (Fig. b), we increased the distance between the two lows to 3000 km (in accordance to Fig. c). In both cases, the initial triangle constellation is still isosceles and the distances between the high and the two lows remain
km roughly corresponding to their mean distance observed in Fig. .
6.1.2. Results
Reducing the distance between the two lows leads to the following observations: The point vortices oscillate between the isosceles triangle constellations 1 and 4 and two other, collinear constellations 3 and 5 (Fig. a). It can be seen that the order of the vortices changes after the collinear constellations as the two lows switch their positions. This causes unstable eigenvectors to switch to stable ones (and reverse) leading to the attraction to the perturbed equilateral triangle, i.e. the isosceles triangle. As Constellation 2 moves away from the isosceles constellation towards the collinear constellation (i.e. the deviation from the equilateral constellation increases with time), it corresponds to an unstable point vortex constellation. Constellation 6, however, converts to the isosceles constellation (i.e. the deviation from the equilibrium decreases) and thus represents a stable one. This behaviour can be viewed similar to the behaviour of real blocking events, where often a transition from High-over-low to Omega and reverse takes place. Moreover, variable locations of the lows can be explained, whereas the high-pressure system is stationary over a longer time period.
An increase of the distance of the two lows in accordance with our statistics leads to an oscillating anticyclonic point vortex (see Fig. b), i.e. in the collinear state the high is located between both lows. Thereby, the distance between the high and the southern (northern) low increases (decreases). Ignoring the northern low, such a collinear state resembles a High-over-low configuration. In our case, the time between the isosceles triangle constellation 1 and the collinear state 2 is about 6.2 days and a whole convulsion takes 12.4 days. The triangle configurations stay close to the isosceles pattern for about 3 days: e.g. constellation 2 in Fig. b is reached 1 day after the initialization (and a mirror constellation would be reached 1 day before configuration 1). Overall, the translation speed of the three point vortex system is smaller compared to set-up 1.
6.1.3. Discussion
Although persistent weather patterns are often denoted as stable weather situations in meteorological terms, the stability analysis of the corresponding point vortex system yields an unstable saddle point. This is also confirmed by Faranda et al. (Citation2016) who indicate that blocking events correspond to an unstable saddle point (in the high dimensional phase space of the atmosphere) without considering any vortex models. Schubert and Lucarini (Citation2016), using covariant Lyapunov vectors, also show that the atmospheric circulation is more unstable when the flow is blocked compared to non-blocked flow. This highlights that the concept of ‘stable’ (i.e. persistent) weather patterns does not necessarily correspond to stability in a dynamical systems view.
6.2. Clustering behaviour
Faranda et al. (Citation2016) showed that clustering, i.e. an extraordinary long persistence near a point in phase space, can occur in the vicinity of unstable fixed points within chaotic attractors causing the persistence of blocking. These results motivated us to search for a clustering near the unstable fixed point of the point vortex blocking model to demonstrate the similarities of the point vortex blocking model with atmospheric blocking events.
6.2.1. Model set-up
To eliminate the conservative character of our point vortex model friction was introduced according to Zhu and Cheng (Citation2010) as Brownian motion. Thereby, (Equation4(4)
(4) ) is complemented by a viscous and a noise term:
(14)
(14)
where represents the viscosity coefficient and
the 1D Brownian motion for each
.
denotes the temporal derivative of
. Similar to Hasselmann (Citation1976), who regarded weather as Brownian motion influencing the climate system, this noise can be considered as the impact of smaller scale phenomena on the positions of the larger scale blocking vortices. The modified point vortex system is regarded according to the Itô integral of stochastic differential equations as in Zhu and Cheng (Citation2010) and numerical solutions are obtained using the Euler–Maruyama method. Thereby,
where
denotes a normal distribution of zero mean and standard deviation sd (Higham, Citation2001).
We tested several (3721) initialisations (km and
km in 1 km steps) with different initial intervortical distances in the vicinity of the mean isosceles triangle
km that followed from the NCEP statistics. Accordingly, the circulations were set to
/s. And the initial orientation of the triangle is
. The simulations were calculated with R (R Core Team, Citation2015) for time steps of 10 min over a total integration time of 4000 h (
days). The Brownian motion is modelled as normal distribution of zero mean and with standard deviation set to
km. This sd-value seems to be reasonable in comparison to the initial configuration based on the coarsely resolved NCEP data (2.5
). For the viscosity, we used the standard atmosphere kinematic viscosity at a height of 5500 m (
hPa):
m
/s. We tested for clustering near an equilateral triangle constellation. Thereby, clustering was defined as being close to an equilateral triangle constellation for at least 10 days over the whole integration time. The closeness was determined with help of the dimensionless distance
(15)
(15)
in phase space. We required for at least 10 days.
6.2.2. Results and discussion
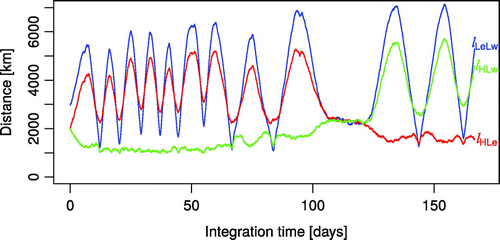
Although only for a fraction () of the tested set-ups, it was indeed possible to observe a clustering of the point vortex model near the equilateral triangle configuration during the integration times. An example is given in Fig. , where the system remains near the fixed point (
km) for about 15 days starting approximately at 105 days after the integration is initiated. Moreover, we notice that in the first period up to about 100 days the distance between one of the two lows and the high remains constant at about 1500 km and after the clustering the distance between the other low and the high is similarly stable while the other vortex moves more freely. This reminds of the High-over-low dipole patterns with an additional vortex. However, the dipole might also rotate; hence, the high and low might change their positions. Nonetheless, it is an impressive result that even though we started far away from the equilateral triangle configuration the
point vortex system clusters close to the equilibrium state for such a long time period, especially, since we used realistic atmospheric conditions of the mid-troposphere for slightly viscous flow. This is a promising outcome that further confirms the applicability of the point vortex model to atmospheric blockings. However, further analyses (longer integration times, different set-ups, test for High-over-low resembling behaviour) might be needed to give a more substantiated view of the point vortex clustering behaviour and its relation to atmospheric blocking.
7. Conclusions
The focus of this paper is the corroboration of the applicability of the point vortex model to atmospheric blocking events. Two methods to identify and characterize blocking vortices in an automated way were proposed. The contour method selects the areas of the blocking vortices as contours of stationary vorticity. The trapezoid method after Müller et al. (Citation2015) on the other hand adapts a box/trapezoid to fit the blocking vortices at each time step. Each method has different uncertainties and benefits. By considering two independent methods, we are able to evaluate the robustness of their results. Both methods evaluate a rather novel atmospheric field: the vorticity determined in the field of the dimensionless kinematic vorticity number larger than 1 where the
criterion extracts the vortex structures embedded in the continuous flow field (see also Schielicke et al., Citation2016). From 347 blocking periods in total during 1990–2012, both methods classified each period either as High-over-low or as Omega blocking. A comparison of the two methods revealed that the high-pressure systems were appropriately captured while the identification of the more variable lows is less reliable. The magnitudes of the circulations, distances and velocities are in accordance with the case studies of Müller et al. (Citation2015). The condition of the vanishing total circulation is acceptably well satisfied, whereas clear deviations from the equilateral triangle are observed. The magnitude of the translation velocities
and
of the point vortex tripole/dipole fits well with the zonal mean flow but the zonal mean flow is slightly stronger. Such differences could lead to non-stationary blocking systems, and it was indeed observed that many blocking translate slowly. Thus, the approximate consensus between
and
is a first justification of applying point vortices to atmospheric blocking. Moreover, we compared the linearized analytic solution of the point vortex equilibrium with a statistical model. As a result of the multiple linear regression, we found that the circulation of the high- and – to a lesser extent – low-pressure systems behave in relation to the zonal mean flow according to the point vortex model with statistical significance. This regression analysis, however, could not confirm a corresponding relationship for the intervortical distances. We assign this to the higher variability of the locations of the low-pressure systems and the invalid assumption of the equilateral triangle. It is commonly known that the persistent high-pressure system is a major characteristic of blockings. Our analysis confirms that the high-pressure system as anticyclonic vortex is dynamically relevant for the blocking phenomenon.
Another central point of this study was the analysis of the stability of the blocking, i.e. the response to perturbations from the equilateral triangle. A stability analyses revealed that the equilateral [..] (or the ideal point vortex blocking model) corresponds to an unstable saddle point in accordance with the findings from Faranda et al. (Citation2016) and Schubert and Lucarini (Citation2016). By considering the non-linear motion in the whole phase space (instead of only the local, linear behaviour near the fixed point), simulations showed an oscillatory behaviour of the lows in accordance with real blocking events. Thereby, a transition from Omega blocking to High-over-low is indicated. If the equilateral triangle is perturbed similar to the observed deviations, i.e. lows are further apart, the simulation reveals a more variable, oscillating anticyclonic vortex. This behaviour needs to be further studied in comparison to realistic atmospheric blocking behaviour, possibly using a higher number of point vortices. Furthermore, the clustering behaviour described in Faranda et al. (Citation2016) can also be observed in the point vortex model concerning the relative distances when friction in terms of noise is included. This clustering may illustrate the persistent (‘stable’) behaviour of blocking as well as the difficulty in predicting the onset and offset of blocking. However, we notice that the reduced point vortex model does not include effects like divergence, baroclinicity, Rossby waves or the Earth’s rotation that also play a role in modifying the cancellation of the zonal mean flow and the theoretically calculated translation velocity from the point vortex blocking model. Other vortices, e.g. those embedded within the zonal mean flow, have not been taken into account explicitly, only indirectly in terms of the averaged zonal mean flow.
To answer the research questions from the introduction, we can conclude that atmospheric blocking, especially their high-pressure systems, behave in many ways similar to the idealized point vortex blocking model. We have shown that not only the stationary behaviour of the blocking high can be modelled with point vortices, but also the instability and the consequently limited predictability due to clustering behaviour.
Supplementary Material 1:15 January 2018
Download PDF (306.1 KB)Supplementary Material 1:10 September 2017
Download PDF (322.1 KB)Acknowledgements
We like to thank Andy Richling for providing the Blocking Index data. Peter Névir and Annette Müller thank Deutsche Forschungsgemeinschaft for their support within the framework of CRC 1114 ’Scaling Cascades in Complex Systems’, project A01. Lisa Schielicke was funded by the Helmholtz graduate school GeoSim.
Additional information
Funding
Notes
No potential conflict of interest was reported by the authors.
Supplemental data for this article can be accessed here: https://doi.org/10.1080/16000870.2018.1458565.
1 If more than one longitude exist, that was maximal blocked, the is chosen, that is closest to the average
.
2 We start the search so far north to exclude subtropical systems. Since the circulation depends on the area, southerly grid points can have higher circulation magnitudes than northerly ones.
3 The saddle point arises from the existence of both stable/negative and unstable/positive eigenvalues.
References
- Altenhoff, A. M., Martius, O., Croci-Maspoli, M., Schwierz, C. and Davies, H. C. 2008. Linkage of atmospheric blocks and synoptic-scale Rossby waves: a climatological analysis. Tellus A 60(5), 1053–1063.
- Aref, H. 1979. Motion of three vortices. Phys. Fluids 22, 393–400.
- Aref, H. 2007. Point vortex dynamics: a classical mathematics playground. J. Math. Phys. 48, 065401.
- Barnes, E. A., Slingo, J. and Woollings, T. 2011. A methodology for the comparison of blocking climatologies across indices, models and climate scenarios. Climate Dyn. 38(11–12), 2467–2481.
- Barriopedro, D., García-Herrera, R. and Trigo, R. 2010. Application of blocking diagnosis methods to general circulation models. Part I: a novel detection scheme. Climate Dyn. 35(7--8), 1373–1391.
- Charney, J. G. and DeVore, J. G. 1979. Multiple Flow Equilibria in the Atmosphere and Blocking. J. Atmos. Sci. 36(7), 1205–1216.
- Faranda, D., Masato, G., Moloney, N., Sato, Y., Daviaud, F., Dubrulle, B. B. and Yiou, P. 2016. The switching between zonal and blocked mid-latitude atmospheric circulation: a dynamical system perspective. Climate Dyn.. 47(5--6), 1587–1599.
- Ferranti, L., Corti, S. and Janousek, M. 2015. Flow-dependent verification of the ecmwf ensemble over the euro-atlantic sector. Q. J. R. Meteorol. Soc. 141(688), 916–924.
- Freva. 2017. Freie Universität Berlin evaluation system (Freva). Accessed: 2017-06-29. Online at: https://freva.met.fu-berlin.de/
- Galarneau, T. J. Jr, Hamill, T. M., Dole, R. M. and Perlwitz, J. 2012. A Multiscale Analysis of the Extreme Weather Events over Western Russia and Northern Pakistan during July 2010. Mon. Weather Rev. 140(5), 1639–1664.
- Gröbli, I. 1877. Spezielle Probleme über die Bewegung geradliniger paralleler Wirbelfäden. Dissertation. Druck von Z{\"{u}}rcher und Furrer.
- Hasselmann, K. 1976. Stochastic climate models Part I. Theory. Tellus 28(6), 473–485.
- Helmholtz, H. 1858. Über Integrale der hydrodynamischen Gleichungen welche den Wirbelbewegungen entsprechen. Journal für die reine und angewandte Mathematik 55, 25–55.
- Higham, D. J. 2001. An algorithmic introduction to numerical simulation of stochastic differential equations. SIAM Rev. 43(3), 525–546.
- Jeong, J. and Hussain, F. 1995. On the identification of a vortex. J. Fluid Mech. 285, 69–94.
- Kalnay, E., Kanamitsu, M., Kistler, R., Collins, W., Deaven, D., Gandin, L., Iredell, M., Saha, S., White, G., Woollen, J., Zhu, Y., Leetmaa, A., Reynolds, R., Chelliah, M., Ebisuzaki, W., Higgins, W., Janowiak, J., Mo, K. C., Ropelewski, C., Wang, J., Jenne, R. and Joseph, D. 1996. The NCEP/NCAR 40-Year Reanalysis Project. Bull. Am. Meteorol. Soc. 77(3), 437–471.
- Kennedy, D., Parker, T., Woollings, T., Harvey, B. and Shaffrey, L. 2016. The response of high-impact blocking weather systems to climate change. Geophys. Res. Lett. 43(13), 7250–7258.
- Kuhlbrodt, T. and Névir, P. 2000. Low-order point vortex models of atmospheric blocking. Meteorol. Atmos. Phys.. 73(3--4), 127–138.
- Luo, D., Cha, J., Zhong, L. and Dai, A. 2014. A nonlinear multiscale interaction model for atmospheric blocking: The eddy-blocking matching mechanism. Q. J. R. Meteorol. Soc. 140(683), 1785–1808.
- MATLAB 2013. Version 8.2.0.701 (R2013b) The MathWorks, Natick, MA.
- Mitchell, D., Davini, P., Harvey, B., Massey, N., Haustein, K., Woollings, T., Jones, R., Otto, F., Guillod, B., Sparrow, S., Wallom, D. and Allen, M. 2017. Assessing mid-latitude dynamics in extreme event attribution systems. Climate Dyn. 48(11), 3889–3901.
- Müller, A., Névir, P., Schielicke, L., Hirt, M., Pueltz, J. and Sonntag, I. 2015. Applications of point vortex equilibria: blocking events and the stability of the polar vortex. Tellus A 67, 29184.
- Neu, U., Akperov, M. G., Bellenbaum, N., Benestad, R., Blender, R., and co-authors. 2013. Imilast: A community effort to intercompare extratropical cyclone detection and tracking algorithms. Bull. Am. Meteorol. Soc. 94(4), 529–547.
- Newton, P. K. 2001. The N-Vortex Problem: Analytical Techniques New York: Springer-Verlag.
- Obukhov, A. M., Kurgansky, M. V. and Tatarskaya, M. S. 1984. Dynamical conditions for origin of droughts and other large-scale weather anomalies. Meteorol. Hydrol. 10, 5–13.
- Pelly, J. L. and Hoskins, B. J. 2003. A new perspective on blocking. J. Atmos. Sci. 60(5), 743–755.
- Pfahl, S., Schwierz, C., Croci-Maspoli, M., Grams, C. M. and Wernli, H. 2015. Importance of latent heat release in ascending air streams for atmospheric blocking. Nat. Geosci. 8(8), 610–614.
- R Core Team 2015. R: A Language and Environment for Statistical Computing. Online at: http://www.r-project.org/
- Rex, D. F. 1950. Blocking action in the middle troposphere and its effect upon regional climate. Tellus 2(October), 196–211.
- Richling, A., Kadow, C., Illing, S. and Kunst, O. 2015. Freie Universität Berlin evaluation system (Freva) -- blocking. Documentation of the Blocking Plugin. Accessed: 2017-06-29. Online at: https://freva.met.fu-berlin.de/about/blocking/
- Rodwell, M. J., Magnusson, L., Bauer, P., Bechtold, P., Bonavita, M., and co-authors. 2013. Characteristics of occasional poor medium-range weather forecasts for Europe. Bull. Am. Meteorol. Soc. 94(9), 1393–1405.
- Schielicke, L. 2017. Scale-dependent identification and statistical analysis of atmospheric vortex structures in theory, model and observation. Dissertation. Freie Universität, Berlin. Online at: http://www.diss.fu-berlin.de/diss/receive/FUDISS\_thesis\_000000105455
- Schielicke, L., Névir, P. and Ulbrich, U. 2016. Kinematic vorticity number -- a tool for estimating vortex sizes and circulations. Tellus A 68, 29464.
- Schubert, S. and Lucarini, V. 2016. Dynamical analysis of blocking events: spatial and temporal fluctuations of covariant Lyapunov vectors. Q. J. R. Meteorol. Soc. 142(698), 2143–2158.
- Shutts, G. J. 1983. The propagation of eddies in diffluent jetstreams: eddy vorticity forcing of ‘blocking’ flow fields. Q. J. R. Meteorol. Soc. 109(462), 737–761.
- Sinclair, M. R. 1997. Objective identification of cyclones and their circulation intensity, and climatology. Weather Forecasting 12(3), 595–612.
- Strogatz, S. H. 2015. Nonlinear Dynamics and Chaos: With Applications to Physics, Biology, Chemistry, and Engineering. Boulder: Westview Press, ISBN 0813349117.
- Synge, J. 1949. On the motion of three vortices. Can. J. Math. 1, 257–270.
- Tavantzis, J. and Ting, L. 1988. The dynamics of three vortices revisited. Phys. Fluids 31(6), 1392.
- Tibaldi, S. and Molteni, F. 1990. On the operational predictability of blocking. Tellus A 42(3), 343–365.
- Truesdell, C. 1953. Two measures of vorticity. Indiana Univ. Math. J. 2, 173–217.
- Tyrlis, E. and Hoskins, B. J. 2008. The morphology of northern hemisphere blocking. J. Atmos. Sci. 65(5), 1653–1665.
- Wilks, D. S. 2005. Statistical Methods in the Atmospheric Sciences London: Academic Press, ISBN 0080456227.
- Yamazaki, A. and Itoh, H. 2013. Vortex-vortex interactions for the maintenance of blocking. Part I: the selective absorption mechanism and a case study. J. Atmos. Sci. 70(3), 725–742.
- Zhu, H. and Cheng, K. 2010. Three vortex motion in the slightly viscous flow. Sci. China Phys. Mech. Astron. 53(4), 735–744.