
 ?Mathematical formulae have been encoded as MathML and are displayed in this HTML version using MathJax in order to improve their display. Uncheck the box to turn MathJax off. This feature requires Javascript. Click on a formula to zoom.
Abstract
The NCEP reanalysis data of surface heat fluxes and other related data are used to study their relationship with the Arctic Oscillation (AO). Positive and negative high correlation regions (HCR) between heat fluxes and the AO within the northern North Atlantic are identified. The main factor influencing heat fluxes is the atmospheric circulation over the Nordic Seas, which produces meridional heat transports and generates ocean circulation variability. Our hypothesis is that there are positive feedbacks that enhance the AO and negative feedbacks that weaken it. Among the three main factors related to the atmospheric circulation in Nordic Seas, meridional wind and ocean circulation result in negative feedbacks. Upward airflow produces three effects: upward advection of warm air, latent heat release by condensation and increased short-wave radiation absorption, which all result in positive feedback to the AO. The region dominated by positive feedback is referred to as Arctic Oscillation Positive Feedback Region (AOPFR). Its area is relative small, but it may have hemispheric effects through the divergence of the airflow. Regarding the driving factor of AO, we find that the upwelled airflow produces the only positive feedback, while oceanic circulation acts as a negative feedback contributor. Both atmospheric and oceanic processes are all important factors governing the evolution of the AO.
1. Introduction
Sea surface temperature (SST) is one of the main factors influencing the variation of the climate system, which is related to both the air-sea heat fluxes and horizontal ocean heat transport (Biastoch et al., Citation2008). In the climate system, the ocean absorbs most of the solar radiative energy reaching its surface, although part is re-released to the atmosphere by heat fluxes through the sea surface (Trenberth and Smith, Citation2009). The heat fluxes comprise radiative heat fluxes (short-wave and long-wave radiation) and turbulent heat fluxes (sensible and latent heat fluxes). Heat exchange through the air-sea interface is the main process for the air-sea coupling (Trenberth and Smith, Citation2009). The air-sea heat fluxes have been shown vary spatially, e.g. in the subpolar regions (Moore et al., Citation2012) and the Nordic Seas (Zhao and Drinkwater, Citation2014).
The character of large-scale air-sea interaction over the mid-latitude North Atlantic Ocean differs with timescale: the atmosphere directly drives most short-term to interannual SST variability, and the ocean contributes significantly to longer term variability of SSTs and potentially atmospheric variability (Bjerknes, Citation1964). This was confirmed by Gulev et al. (Citation2013) through analysis of surface heat fluxes. On time scales longer than 10 years, surface turbulent heat fluxes are driven by the ocean and may force the atmosphere. It is suggested that the predictability of mid-latitude North Atlantic air-sea interaction could extend beyond the ocean to the climate of surrounding continents (Gulev et al., Citation2013). The surface heat fluxes play a key role in year-to-year changes in the SSTs in the tropic Atlantic, but a relatively minor role in the subpolar and subtropical regions (Grist et al., Citation2010). However, the heat transportation in the North Atlantic Ocean is a key factor in the global climate system, as a branch of the North Atlantic Current brings enormous heat to the north, which is unique in the world oceans. The total heat transport into the Nordic Seas through three channels on the Scotland-Greenland Ridge is about 254 TW (Jónsson and Valdimarsson, Citation2012; Berx et al., Citation2013; Hansen et al., Citation2015). This heat eventually is released to the atmosphere in the Nordic Seas and marginal seas of the Arctic Ocean.
There are two dominant long time scale processes in the North Atlantic Ocean; one is at multidecadal scales and the other is decadal. The Atlantic Multidecadal Variability (AMV), also referred to as the Atlantic Multidecadal Oscillation (AMO), is defined as the detrended and filtered average SST over the North Atlantic from the equator to typically 60°–70°N (Enfield et al., Citation2001; Sutton and Hodson, Citation2005). There is spatial variability in the North Atlantic SST field (Goldenberg et al., Citation2001; Deser et al., Citation2010). The amplitude is most pronounced in the extratropics and south of Greenland with a period of 60–80 years (Knight et al., Citation2005; Sutton and Hodson, Citation2005).
The North Atlantic Oscillation (NAO) dominates the decadal time-scale variation of the climate system in North Atlantic (Hurrell, Citation1995), which is expressed by differences in sea level pressure (SLP) between the Icelandic Low and the Bermuda-Azores High using data from Akureyri or Stykkisholmur in Iceland and the Azores (Walker and Bliss, Citation1932; Rogers, Citation1985) or Lisbon, Portugal (Hurrell, Citation1995). This seesaw-like dipole oscillation is an important atmospheric circulation index, which was described in the 1920s (Walker and Bliss, Citation1932) and has been studied extensively (Hurrell et al., Citation2003). NAO variability has been shown to strongly influence North Atlantic subpolar marine ecosystems (Drinkwater et al., Citation2003; Stenseth et al., Citation2004). The Arctic Oscillation (AO) is defined by the first mode of the Empirical Orthogonal Function (EOF1) of SLP north of 20°N, and the time coefficient of EOF1 was defined as the Arctic Oscillation Index (AOI) (Thompson and Wallace, Citation1998). The AO is considered the most important pattern of atmospheric circulation in Northern Hemisphere, especially in winter (Thompson and Wallace, Citation2001; Wallace and Thompson, Citation2002). It undergoes spatial variability, including changing shape through area shrinking and expanding, and boundary changes (Zhao et al., Citation2010). Indices of AO and NAO are highly correlated with a correlation coefficient about 0.92 (Ambaum et al., Citation2001). Some researchers argue that the NAO is in fact part of the AO (http://w1.weather.gov/glossary/index.php?word=arctic+oscillation), but more studies revealed that there are subtle and notable differences in NAO and AO variations (Báez et al., Citation2013; Hanna et al., Citation2015).
The main impediment to understanding the low-frequency oscillations is knowledge of their driving factors, or, physical mechanisms, which remains insufficient to reliably predict future changes (Hanna and Cropper, Citation2017). Recent debates have focussed on the mechanism of AMV. In many climate models, AMV results from variations in the Atlantic Meridional Overturning Circulation that is generated internally by the coupled ocean–atmosphere system itself (Gulev et al., Citation2013). Some studies proposed different opinions. Ottera et al. (Citation2010) and Booth et al. (Citation2012) suggested that radiative forcing by aerosol–cloud drives the AMV. Clement et al. (Citation2015) proposed that AMV can be produced in a model that does not include ocean circulation changes. Their results suggest that AMV is a response to stochastic forcing from the mid-latitude atmospheric circulation, and the AMOC would be largely a response to, not a cause of, AMV. Zhang et al. (Citation2013) and Zhang et al. (Citation2016) contended that ocean dynamics play a central role in AMV while Clement et al. (Citation2016) reaffirmed their point of view.
For AO/NAO, analogically it is also a question: What is the driving factor, atmosphere or ocean? Previous studies gradually realised the NAO is related to systematic changes in the wind anomaly, latent and sensible heat fluxes (Cayan, Citation1992), sea surface temperature (Kawamura, Citation1994), the katabatic winds blowing off Greenland (Slonosky et al., Citation1997) and ice coverage (Deser and Blackmon, Citation1993). These variations can be explained as a response to changes in surface fluxes caused by changes in the atmospheric circulation (Seager et al., Citation2000). It is suggested that NAO growth is driven by both high- and low-frequency transient eddy vorticity fluxes, and that the decay of the NAO is due to both the influence of the low-frequency eddy fluxes and Ekman pumping (Feldstein, Citation2003).
The AO is closely related to sea-ice variability in the Arctic Ocean. In recent years, the Arctic has warmed 2.5 times more than the global mean, which has been termed Arctic Amplification (Serreze and Francis, Citation2006) and is considered a response to the anthropogenic radiative forcing by increasing greenhouse gases (Gillett et al., Citation2008). The mechanism responsible for Arctic Amplification was explained mostly by the ice-albedo feedback occurring in the Arctic Ocean (Tanaka and Tamura, Citation2016), but many other processes, such as reduction of ocean heat storage in autumn and cloud radiative feedback, are also considered to be important (Yoshimori et al., Citation2014). Arctic Amplification has an obvious impact on the climate of the mid-latitudes, such as recent severe winters in mid-latitude Eurasia (Cohen et al., Citation2012; Tang et al., Citation2013), North America (Francis and Vavrus, Citation2012) and Europe (Overland et al., Citation2011). Three potential dynamical pathways linking Arctic amplification to mid-latitude weather are: storm tracks, the jet stream and planetary waves (Cohen et al., Citation2014). However, based on the result of Mori et al. (Citation2014), the atmospheric response to sea-ice decline is independent of the AO.
The motivation of this study is to determine the possible mechanisms of low-frequency variations at the decadal timescale, focussing on the AO. We consider the AO as an air-sea coupled system, with the interaction of ocean and atmosphere as an internal process of the system. These internal processes could be described by feedbacks, not by driving factors. Using correlation analysis of the surface heat fluxes with AO, the positive and negative feedbacks are identified. The AO strengthens with positive feedbacks and weakens with negative feedbacks.
Despite heat flux variations in ice-covered regions, we focus on the sea surface heat fluxes in the North Atlantic and Nordic Seas and their relationship with the AOI. In Section 2, the data and analysis methods are introduced. The correlations of heat fluxes with the AOI are discussed in detail in Section 3. In Section 4, the positive and negative feedbacks of heat fluxes to AO process are analysed. Our conclusions are summarised in the final section.
2. Data and analysis methods
2.1. Data
Most data used in this study are NCEP-DOE Reanalysis-2 from the National Centre of Environment Prediction (NCEP), which is an improved version of the NCEP Reanalysis-1 using a state-of-the-art analysis/forecast system to perform data assimilation using past data (http://www.esrl.noaa.gov/psd/data/gridded/data.ncep.reanalysis2.html#references). These data include the components around the air-sea interface: monthly short-wave and long-wave radiation, sensible and latent heat fluxes, cloud coverage, SST, air temperature at 2 m, wind velocity, SLP and AOI. They also include data at different levels, such as air temperature, omega, relative humidity, etc., from January of 1979 to December of 2016, 38 years in total. Downward radiation is defined as positive, and the sensible and latent heat fluxes entering the atmosphere are positive. Cloud data are from NOAA-CIRES database from January of 1979 to December of 2014, 36 years in total. Spatial resolution of all data is 1.875° (longitude) ×1.904° (latitude).
2.2. Study area and monthly mean
Zhao et al. (Citation2006) revealed a special area they called the Arctic Oscillation Core Region that covers the Nordic Seas and vicinity. The averaged SLP over this region is highly correlated with AOI with a correlation coefficient of −0.949. This led to the question of what factors induce the consistent variation of the averaged SLP there and the AOI. It implies that the Nordic Seas might have a special contribution to the AO/NAO. Furthermore, the heat fluxes from the Nordic Seas are quite complex because the underlying ocean contains warm and cold waters with the maximum horizontal spatial difference in SST of more than 10 °C (Kostianoy and Nihoul, Citation2009).
To study the coupling of surface heat fluxes with the AOI, we chose the region north of 35°N in the North Atlantic Ocean, which includes the Nordic Seas, the subpolar gyre and part of the subtropical gyre. In this region, the ocean is bounded by Europe and North America in the North Atlantic, and by Greenland and the Norwegian coast in the Nordic Seas. The transportations of warm water from the tropics and the cold water from the Arctic result in enormous heat exchange to form a special climate system.
As the basis of our research, the seasonal variation of heat fluxes exhibits the thermal budget between ocean and atmosphere. The monthly means for January and August heat fluxes are plotted in to reflect the typical seasonal variations in winter and summer, respectively.
Fig. 1. Multiyear averaged monthly heat fluxes in winter (January) and summer (August). (a) Net short-wave radiation (left: January; right: August). (b) Net long-wave radiation (left: January; right: August). (c) Sensible heat flux (left: January; right: August). (d) Latent heat flux (left: January; right: August).
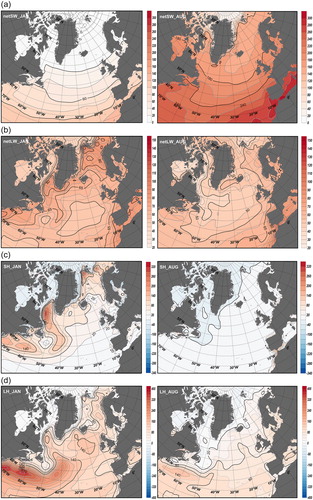
There are remarkable seasonal differences in short-wave radiation. In winter, it is only tens of W m−2 in the subpolar region and nearly zero in the Nordic Seas, while in summer the net short-wave radiation is greater than 170 W m−2 (). The net long-wave radiation is about 50–65 W m−2. The difference in net long-wave radiations in winter and summer is only 15 W m−2. The sensible heat flux in summer is less than 10 W m−2 everywhere () because of the weak air and sea temperature differences, while in winter it is more than 100 W m−2 in the subpolar region and Nordic Seas. The latent heat flux in summer is also weak in subpolar regions, about tens of W m−2, but in winter it is more than 100 W m−2 and more than 300 W m−2 in the subtropics.
Therefore, seasonally the main heat flux component in summer is shortwave radiation; whereas in winter it is through sensible and latent heat fluxes. The long-wave radiation in winter and summer are similar. In the winter, there is stronger heat release from the ocean to the overlying air masses, thereby warming the adjacent land masses. The heat mostly comes from the advection of the northward branch of the North Atlantic Current. In the summer, the effect is reversed. Warm air masses (heated by the sun on long days) above the Atlantic Ocean will transfer heat to the underlying cooler ocean.
2.3. Analysis method
To explore the relationships between each heat flux component and the AOI, a 12-month running mean was applied to remove higher frequency signals than the seasonal cycle. The Pearson correlation coefficient of the AOI with the heat fluxes at each grid point was then calculated to determine their spatial distribution. Using 12-month running means results in high persistence in each of the time series, i.e. high autocorrelation. This reduces the number of independent points in the time series (n*), which are needed to determine the statistical significance of the correlations. n* was calculated using the method of Garrett and Toulany (Citation1981), which varies from 56 to 80 for AO index, heat fluxes, and cloud for the total number of data points of 432. The corresponding degrees of freedom are then n*-2 and a statistically significant correlation is around 0.27 or higher for 95% confidential level. Therefore, the regions with correlation coefficients greater than 0.27 or less than −0.27 are defined as positive and negative high correlation regions (HCR).
After the determination of positive and negative HCRs, the running correlation coefficient (RCC) between AOI and each heat flux component averaged over the HCR were calculated to reveal the variation of the correlations with time. The RCC, Rs(i) between two time series, Xk and Yk, centred at ith month with the window length of ± n is expressed as (Zhao et al., Citation2018)
(1)
(1)
Note that and
are not the means inside the window, but the means for all of the data, based on the suggestion of Zhao et al. (Citation2018). This RCC is named as synoptic running correlation coefficient. In this study, n was taken as 6 months. The RCC was obtained by moving the window month by month. The average RCC within each HCR was calculated using the data of all RCCs, which is similar to the correlation coefficient of the total time series (Zhao et al., Citation2018). All the running correlation coefficients are plotted in related figures to show their temporal variation.
3. Correlations between heat fluxes and the Arctic Oscillation
The AO exhibits spatial variability, including area shrinking and expanding, resulting in changing boundaries (Zhao et al., Citation2010). The heat fluxes are inevitable influenced by AO, but with spatial differences to the AO itself. A high RCC of a heat flux and AOI would appear if the grid point falls into the AO-dominated region, otherwise the RCC would be low or opposite. As the heat fluxes reflect the air-sea exchange, the HCRs have explicit physical significant in regards to the AO.
3.1. Short-wave radiation
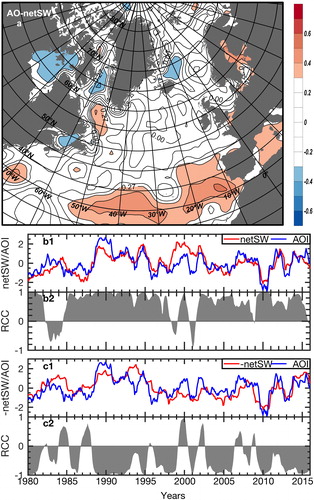
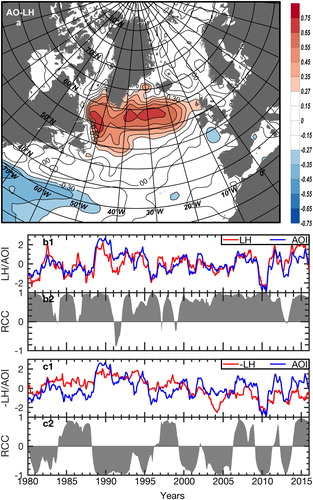
The spatial distribution of the correlation coefficient between the net short-wave radiation and the AOI is shown in . Negative correlations dominant in the Nordic Seas (a higher AO results in less short-wave radiation) and a positive correlation covers the rest of the North Atlantic Ocean. Spatially-averaged net short-wave radiation in both positive and negative HCRs are obtained and normalised to calculate the RCC with the AOI. The correlation in the positive HCR is about 0.67, while in the negative HCR it is about −0.62, both highly significant ().
Fig. 2. Correlation between net short-wave radiation and the AOI. (a) Spatial distribution of correlation coefficient with positive (orange) and negative (blue) HCRs. (b1) and (c1), are the normalised curves for AOI (blue lines) and the averaged net short-wave radiation anomalies (red lines) for positive and negative HCRs, respectively. The histograms show the RCCs for the positive (b2) and negative (c2) HCRs.
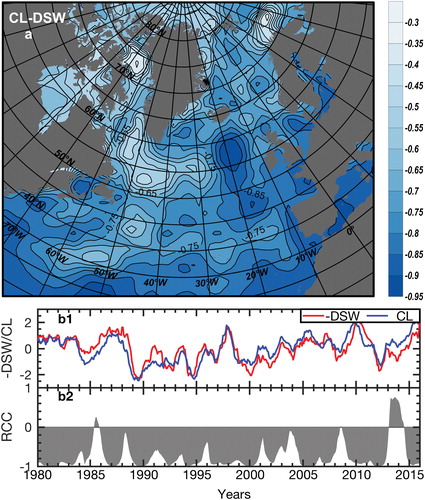
The variation of downward short-wave is closely related to cloud coverage (e.g. Hartmann, Citation2016), which is confirmed by the high correlation coefficients in the whole region (). The RCC between cloud cover and downward short-wave radiation is also highly negative with an average correlation coefficient of −0.82 (), thus more clouds, less radiation.
Fig. 3. The correlation between the downwelling short-wave radiation and cloud coverage. (a) The spatial distribution of correlation coefficient of gridded downwelling short-wave radiation and cloud coverage anomalies. The entire correlation field is negative. (b1) The normalised average downwelling short-wave radiation (red) and cloud coverage (blue) anomalies. (b2) The histogram of the RCC of downwelling short-wave radiation and cloud cover.
Further evidence of the contribution of clouds is the high correlation between cloud cover and the AOI (), which is similar to that of short-wave radiation and the AOI () but of opposite sign. The positive HCR covers only Iceland and ambient regions of the Nordic Seas, while to the south in the North Atlantic where the HCR is negative. This means that when the AOI increases, the cloud cover in most regions decreases with exception of Iceland and its ambient regions. The RCCs for positive and negative HCRs are reasonably high with averages of 0.66 and −0.76. Therefore, the close relationship among the AO Index, short-wave radiation and cloud cover is confirmed.
Fig. 4. The same as but for the total cloud coverage and AOI.
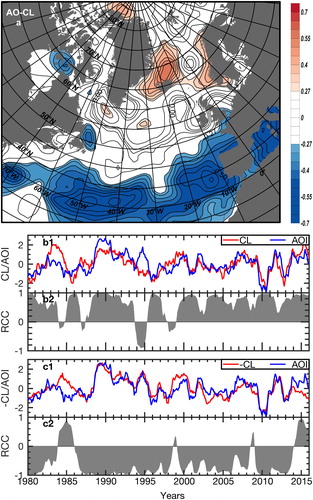
The correlation in indicates the enhancement of the cyclonic wind field in the Nordic Seas during a positive AOI. The cyclonic wind is divergent in the upper level leading to dispersal of high clouds, while it is convergent in the lower level that benefits the accumulation of middle and lower clouds. Two reasons might induce the increased cloud coverage in the Nordic Seas, one is the production of clouds by upward airflow and the other is the accumulation of clouds by convergence. These two possibilities will be discussed further in Section 4.3.
Both possibilities all require upward airflow. Large-scale and mesoscale atmospheric movements satisfy hydrostatic equilibrium, in the vertical pressure coordinate (p-system) the vertical velocity ω is expressed by
(2)
(2)
where x and y are horizontal coordinates, z is the vertical coordinate (positive upwards), u and v are horizontal velocity components, and w is the vertical velocity in the z coordinate system. The first three terms on the right side of EquationEquation (2)
(2)
(2) can be neglected as they are much smaller than the last term, and using the state equation of gas, the relationship of ω and w becomes approximately:
(3)
(3)
where Rd is the gas constant for dry air, Tv is virtual temperature of air and g is the acceleration of gravity. The ω data in a p-coordinate system provided by NCEP are used to calculate the upwelling speed w in a z-coordinate system using EquationEquation (3)
(3)
(3) .
The correlation distribution of ascending speed w at 500 hPa with the AOI is shown in . All Nordic Seas lay within a positive HCR with the averaged correlation coefficient about 0.79. It suggests that the upward airflow is enhanced with an accompanying increase in the AOI.
Fig. 5. Spatial distribution of the correlation coefficient of upward airflow speed with the AOI.
Therefore, with the atmospheric circulation and upward airflow increasing, the cloud cover in the Nordic Seas increases while that of the North Atlantic Ocean decreases. The changing cloud amount alters the short-wave radiation arriving at the ocean surface. Usually, when the AOI is positive, the decreased short-wave radiation in Nordic Seas will weaken the AOI itself. However, as analysed in Section 4.3, the positive feedback resulting from increasing clouds is dominant, whereas the negative feedback of decreased short-wave radiation is less important.
3.2. Long-wave radiation
Net long-wave radiation is positively correlated with the AOI in the North Atlantic Ocean and negatively in the Nordic Seas (). In the positive HCR, the RCC is stable with a correlation coefficient of 0.75, while in the negative HCR, the RCC is variable with a mean of −0.71. The main factor influencing upward long-wave radiation is the SST. SST variability could be caused either by solar heating or advection of heat by ocean currents. As the main energy source of oceanic heat, the variation of solar radiation surely alters SST. However, the ocean currents could transport more heat than solar heating to reflect the SST variations in warm and cold ocean current regions. The enhanced atmospheric circulation when the AOI is positive drives an enhanced ocean circulation, which induces the increase in long-wave radiation in warming regions and decrease in cooling regions.
Fig. 6. The same as but for the net long-wave radiation and the AOI.
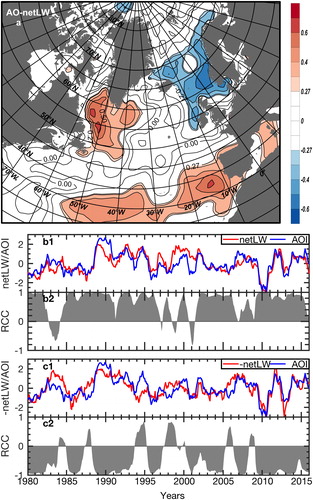
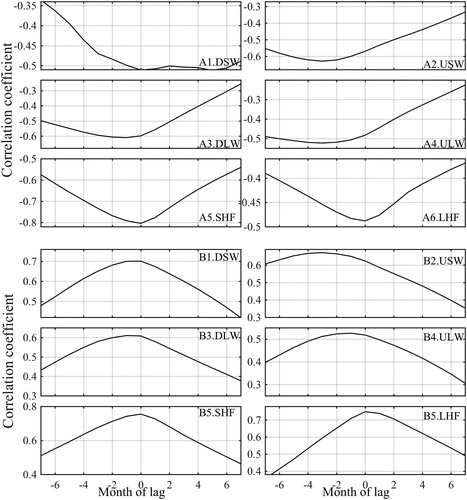
The solar heating and heat advected by currents could exist synchronously, but are easily distinguished. SST varies in phase with the AOI when heated by local solar radiation, but lags when involving transport by slow ocean currents. The long-wave radiation usually lags the AOI by two to three months () showing the major contribution comes via advection by the ocean currents. The time difference curve in for long-wave radiation also includes an in phase signal, which means the contribution of solar heating is also important.
Fig. 7. The correlation as a function of lag between heat fluxes and the AOI for positive (a) and negative (b) HCRs, respectively. DSW and USW are downward and upward shortwave radiations, DLW and ULW are downward and upward long-wave radiations, SHF and LHF and for sensible and latent heat fluxes.
3.3. Sensible heat flux
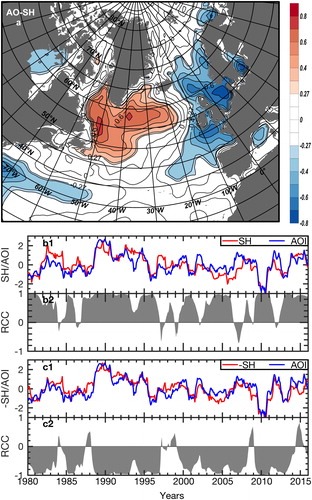
The correlation coefficient between the sensible heat flux and the AOI shows that the positive HCR locations are in the cold-water region of the subpolar gyre and the negative HCR occurs in the warm current regions (). In both positive and negative HCRs, RCCs of sensible heat and the AOI are all strongly correlated with the average RCCs being 0.76 and −0.80, respectively.
Fig. 8. The same as but for sensible heat and the AOI.
3.4. Latent heat flux
The pattern of the correlation coefficient between latent heat flux and the AOI is similar to that of sensible heat and the AOI, with the positive HCR in the subpolar gyre and negative HCR in the warm current region of the North Atlantic Ocean (). The main difference is that the latent heat along the margin of the Nordic Seas is positively correlated with AOI. The correlation between latent heat and the AOI is high in the positive HCR () with an average correlation coefficient of 0.75. While in the negative HCR, the average correlation coefficient is only −0.48 but with varying positive and negative RCCs ().
Fig. 9. The same as but for latent heat and the AOI.
4.Positive and negative feedbacks to the AO
Although the AO is derived from the SLP north of 20°N (Thompson and Wallace, Citation2001), the North Atlantic Ocean is considered to contribute dominantly to the AO, because it is closely related to the NAO, and the latter is dominated by the North Atlantic. Moreover, the average SLP in the Arctic Oscillation Core Region centred in Nordic Seas is very high correlated with AO index (Zhao et al., Citation2006), suggesting a dominate contribution from this area.
The AO exhibits a weakening or enhancing of the atmospheric circulation in the Northern Hemisphere through the feedbacks. For example, the release of absorbed solar energy from ocean surface varies interannually through long-wave radiation, sensible and latent heat fluxes. In turn, these heat fluxes are converted to momentum variations in the atmosphere, hence a contribution of ocean surface heat fluxes to the AO is expected.
In Section 3, the atmospheric circulation in Nordic Seas is attributed to the correlation between heat fluxes and AOI. Wind and ocean currents transport air and water with different temperature to alter the heat fluxes in remote regions.
4.1. Variation of the atmospheric circulation over the Nordic Seas
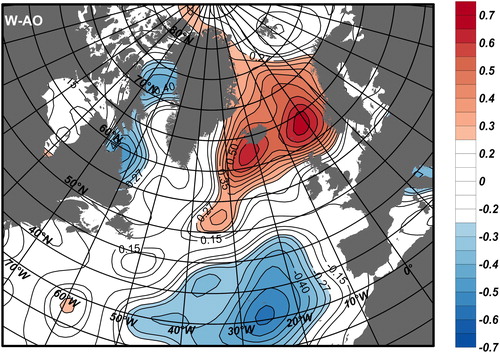
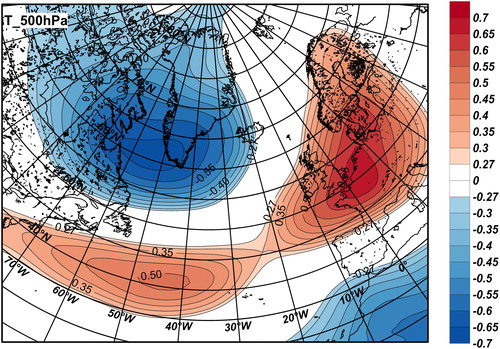
It is seen from Section 3 that all the heat flux components are related to AOI variability, especially in positive and negative HCRs. The AOI clearly reflexes the variation in the atmospheric circulation, mainly the westerly winds. However, the main factor influencing the heat fluxes is the meridional wind in the Nordic Seas, which is in phase with AOI, but quite different with the westerly (zonal wind). Owing to the geographical characteristics of Nordic Seas, the regional circulation is semi-closed with southerly winds along Norwegian coast and northerly winds along Greenland. When the AOI is positive, the atmospheric circulation of the Nordic Seas enhances the transport of warm and cold air masses that alter the surface heat fluxes. The meridional heat transport of atmosphere alters air temperatures, as shown by the correlation between 500 hPa temperature and AOI (). After several months’ lag, the ocean currents respond to the atmospheric forcing, which also alters the heat fluxes. The main function of the Nordic Seas atmospheric circulation is to alter the surface heat fluxes by transporting warm and cold air in north-south direction, and altering the regional ocean circulation.
Fig. 10. Correlation coefficient of air temperature at 500 hPa and the AOI.
4.2. Time difference relevance analysis
For the studies on the mechanisms of any physical process, the related factors are usually divided into driving factors and response factors. The driving factors are considered to be external to force the system. Nevertheless, for air-sea coupling processes, the atmosphere and ocean belong to one system, in which, except for solar radiation, the heat fluxes exchanged through air-sea interface are not external processes but internal ones of the system. In the air-sea coupled system, AO is an internal process. Our concept is that there are positive feedbacks to maintain and enhance the AO, and negative feedbacks that weaken the AO. It is just the growth and decline of these positive and negative feedbacks that determine the evolution of the oscillation. The surface heat flux is the language of ocean–atmosphere communication (Gulev et al., Citation2013), which indicates what kind of interaction occurs. The heat fluxes are either participants or indicators for the air-sea interaction helping us to understand the feedback processes.
Clues for identifying feedbacks can be found from the time difference between heat fluxes and AOI. The correlations as a function of lag between averaged heat fluxes in HCRs and the filtered AOI are analysed in this study. Using the method of Garrett and Toulany (Citation1981), the critical value of the significant correlation coefficient is around 0.27 for 95% confidential level, which is explained in section 2.3. All the results in the are statistically significant. Despite using running means, the amplitude and phase information of the low frequency processes remain. Usually the leading factors are dominant and the lag factors are responsive. As the data in our study are monthly means, only lead or lag times longer than one month can be identified. The influence of atmospheric processes is usually simultaneous with the AOI, while those impacted by the ocean circulation are much longer and lag the AOI. The time difference relevant analysis results are listed in .
Among them, only the downward shortwave radiation exhibits a signal leading by about five months. The long-wave radiation, either in positive or negative HCRs, lags by about two months, supporting the idea of a contribution by ocean currents. As the downward radiation around Iceland is the only leading factor, this small area is of interest (). This region is inside the Arctic Oscillation Core Region defined by SLP (Zhao et al., Citation2006), and only includes southern central Nordic Seas off Norwegian and Greenlandic coasts. We name it the Arctic Oscillation Positive Feedback Region (AOPFR). The scope of AOPFR is not clearly defined, which is roughly sketched by based on .
Fig. 11. (a) Sketch of Arctic Oscillation Positive Feedback Region (AOPFR). (b) Sketch of positive and negative feedback processes of surface heat fluxes to the AO. Pink and blue shaded scopes show positive and negative feedbacks, respectively. The abbreviated symbols are as follows. ‘AO’: Arctic Oscillation; AOPFR: Arctic Oscillation positive feedback region; ‘temp.’: temperature; ‘LW’: long-wave radiation; ‘SH’: sensible heat; ‘LH’: latent heat; ‘SLP’: sea level pressure; ‘
 ’: decrease.
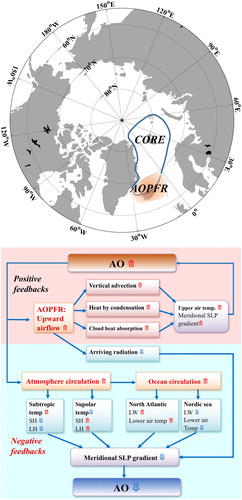
4.3. Positive and negative feedbacks to the Arctic Oscillation
In Section 3, the relationship of the heat fluxes with the AOI are plotted in . The atmospheric circulation is considered the main factor related to AOI. Three main processes are related to atmospheric circulation: horizontal atmospheric circulation, ocean circulation and upward airflow, as shown in . The main feedbacks are as follows:
4.3.1. Negative feedback by atmospheric circulation in Nordic Seas
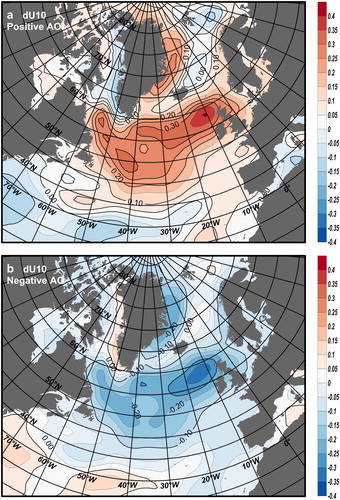
When the AO increases, the meridional wind transports more heat to the Nordic Seas. This is expected to lower the Icelandic Low, further enhancing the AO. However, this positive feedback does not occur. Enhanced southward winds transport more cold air to subpolar region at this time (). Because the enhanced westerly flow during positive AO blocks the cold air from crossing it, the cold air is restrained to the subpolar area causing the Icelandic Low to weaken, i.e. negative feedback. At the same time, the enhanced meridional wind transports more heat from equatorial region to the subtropical region, thereby weakening the Subtropical High, also a negative feedback.
Fig. 12. Spatial distribution of averaged wind speed anomaly when AO is positive (a) and negative (b). The pattern was average by wind fields with AOI > 0 and AOI < 0.
4.3.2. Negative feedback by oceanic circulation
The long-wave radiation lags the AO by about two months. As the long-wave radiation is determined by the variation of SST, the lag implies the contribution by ocean meridional currents, which transport warm or cold water to alter the SSTs. Based on , the net long-wave radiation decreases in low SLP area (Nordic Seas) and increases in high SLP area (subtropical area), resulting in weakening the meridional SLP gradient, so the function of ocean current contributes as a negative feedback. As the long-wave radiation can affect the whole air column, its thermodynamic action is dominant.
4.3.3. Negative feedback by upward airflow
The upward airflow contributes both positive and negative feedbacks. In the AOPFR, clouds and upward airflow increase when the AOI is positive (). Increasing cloud coverage reduces the amount of solar radiation arriving at sea surface, thereby lowering SSTs, long-wave radiation and sensible heat fluxes. This is a negative feedback by working to reduce the air temperatures and weaken the AOI.
4.3.4. Positive feedback by upward airflow
The main positive feedbacks are shown in the shaded frame by the pink colour in . There are three important physical processes accompanying the upward airflow. First, the upwelled thermal advection results in increasing air temperatures. Second, the condensation of warmer upwelled air releases latent heat and warms the ambient air (Pfahl et al., Citation2015). Third, the liquid water in the cloud absorbs more solar radiation (Cess et al., Citation1995). These three processes have the same function, i.e. to increase air temperature, lower the SLP and enhance the AOI, thus being a positive feedback on the AO. This feedback occurs inside AOPFR. Beyond the AOPFR, decreasing cloud coverage with positive AOI acts as the negative feedback.
4.3.5. Contribution by atmospheric turbulence
The wind speed alters the turbulence of the lower atmosphere and the turbulent heat fluxes, as well as sensible and latent heat fluxes. When the AOI is positive, the wind speed increases in westerly influenced regions of the North Atlantic and along the margins of the Nordic Seas (). When the AOI is negative, the wind speed becomes weaker (). The latent heat is a one-way transfer from ocean to atmosphere. The sensible heat, on the other hand, is transported from ocean to atmosphere during the year, except in summer. Therefore, the turbulent heat fluxes become higher for a positive AO and lower for a negative AO. It appears that the turbulent status alters the heat transfer efficiency from ocean to atmosphere, but there is no special feedback to AO.
4.3.6. Contribution of sensible heat fluxes
With exception of the contribution of wind speed, sensible heat is determined by the air-sea temperature difference. Because sensible heat synchronises with the AO, it is dominated by air temperature, not by SST. The major factor for air temperature is the advection of atmospheric circulation. In the warm air area, the temperature difference of air and sea decreases, and the weakened sensible heat flux reduces the air temperature; whereas in the cold air area, the temperature difference of air and sea increases, the enhanced sensible heat flux increases the air temperature. Therefore, the sensible heat lowers the temperature of warm air and increases the temperature of cold air, being part of the negative feedback arising from the atmospheric circulation.
4.3.7. Contribution of latent heat fluxes
First, atmospheric humidity was checked to determine if it might be the main cause of the altering latent heat. However, the difference in relative humidity at positive and negative AO phases is not obvious (not shown). Then air saturation becomes the only possible explanation of the altering latent heat. In the warm ocean current area, the latent heat decreases when AO is positive, which could be explained as an increase in the air saturation when the warm air is cooled (). Conversely, in the subpolar area, the positive HCR indicates that the latent heat increases when the AO is positive. We speculate that when cold air is dry, air saturation decreases as air temperature increases. Similar to sensible heat, the latent heat is also a negative feedback on the AO, as it lowers the temperature of warm air and rises the temperature of cold air.
4.4. Further discussion of the feedbacks
In Section 4.3, the upward airflow and its effects are identified as the only positive feedback process. It is consistent with studies that suggest radiative forcing by aerosols and cloud drives the long-term variation (Ottera et al., Citation2010; Booth et al., Citation2012). Cloud-aerosol interactions dominate not only the dynamics of marine shallow clouds, but also the vertical disposition of latent heat of deep convective clouds over the ocean and even more strongly over land (Rosenfeld, Citation2006).
The atmospheric circulation and upward airflow over Nordic Seas are the horizontal and vertical movements of the same dynamic process. But the horizontal movement results in negative feedbacks while vertical movement results in positive feedbacks. From our results, the positive and negative feedbacks appear at different regions. The margin of the Nordic Seas is the main pathway of stronger winds and ocean currents causing larger air temperature variations and is dominant by negative feedbacks. However, the wind in the area centred at Iceland is weak and the upward airflow is dominant with positive feedbacks to the AO. This is consistent with Pfahl et al. (Citation2015) that ascending air from lower levels associated with latent heating in clouds is of first-order importance.
According to our analysis, the AOPFR is a special region with weak horizontal winds because it is a transition zone of southerly and northerly winds, but it has strong upward airflow. Although the horizontal extension of upward airflow is somewhat small (), it impacts a much larger area. The convergence in the lower atmosphere will concentrate the air masses from a far larger area, and the heat released from the sea surface out of the AOPFR will join the upward flowing air, thereby impacting the AO. Whereas the divergence in the upper atmosphere not only makes the cloud disperse, it also transports heat in the AOPFR to lower and higher latitudes thus producing a hemispheric effect. Although the absorption of solar radiation by the clouds is simultaneous, the heat accumulation, thermal diffusing and semi-hemispheric system building may require a much longer time. This explains why the solar radiation variation leads the AOI by about five months.
To summarise, the production and transportation of clouds in the AOPFR is the dominant physical process, with which the heat release variations produce positive feedbacks on the AO. This is supported by the data and our analysis of the heat fluxes. The function of the ocean is one of negative feedbacks by influencing surface heat fluxes. Ocean circulation contributes to the climate system as a stabilising factor. Both positive and negative feedbacks are all important in the variability of the AO.
Although all the low-frequency variations are related to the air-sea coupling system, their mechanisms might be different. Here, we identified that the meridional wind is a key factor for AO because of the special geography of Nordic Seas. For the other important low frequency oscillation, the AMV, the mechanism might be quite different from that of the AO.
Arctic Amplification has been the highlighted climate change topic. AOI is a useful index to be related to the many variations in Arctic. The results of this paper are helpful to understand the potential contribution of physical processes in Nordic Seas and Northern North Atlantic. The feedbacks in open waters out of the ice-covered region become dominant factors. However, the contribution of ice covered ocean to AO, especially of the positive feedback by surface albedo (Screen and Simmonds, Citation2010), is still unknown.
5. Conclusions
The NCEP surface heat fluxes, including short-wave and long-wave radiations, sensible and latent heat fluxes, are used to analyse their correlation with the AOI. Other data are also used, such as cloud, SLP, air temperature, SST and wind velocity. The patterns of correlation coefficients of the heat flux components with the AOI reveal positive and negative high correlation regions (HCR) with correlation coefficients higher than ±|0.27|.
The correlations between surface heat fluxes and the AOI suggest that the main factor influencing heat fluxes is the atmospheric circulation in the Nordic Seas. Because of its geographic constraint, the Nordic Seas have a semi-closed regional atmospheric circulation with southerly wind along Norwegian coast and northerly wind along Greenland, which varies in phase with AO. Three main processes are related to the atmospheric circulation: meridional wind, ocean circulation and upward airflow. The main function of the meridional wind is on the southern and northern transportation of warm and cold air masses, which drives the ocean circulation variations accordingly.
Our concept is that the AO is an air-sea coupled system with a decadal time scale. There are positive feedbacks that enhance the AO, and also negative feedbacks that act to weaken the AO. It is their joint effect that determines the evolution of the AO. Of the three main factors related to the atmospheric circulation in Nordic Seas, meridional winds and ocean circulation are all negative feedback factors. The upward airflow produces increased cloud, which also induces a negative feedback because it reduces arriving solar radiation.
However, the upward airflow produces other effects: (a) advection of warm air, (b) latent heat release by condensation and (c) direct absorption of cloud to short-wave radiation. These three effects have the same function, i.e. to increase the air temperature in the air column, decrease the SLP and further increase the AOI. This process occurring in the southern Nordic Seas off the Norwegian and Greenlandic coasts is the only positive feedback area in the North Atlantic Ocean, here referred to as the AOPFR. We found no other positive feedback region similar to the AOPFR in the northern North Atlantic. Although the scope of AOPFR is very small, it might impact a much larger area through the convergence in the lower atmosphere and the divergence in the upper atmosphere, which could potentially impact most of the Northern Hemisphere.
Regarding what is the main driving factor, atmospheric or oceanic processes, this paper provides a different result. For long-term variations, the atmosphere and ocean belong to the same system, and AO is an internal process. The upward airflow in AOPFR is the only positive feedback factor to enhance the AO, which is directly related to atmospheric process. Oceanic circulation is a negative feedback contributor, which weakens the AO. Both atmospheric and oceanic processes are all important factors governing the evolution of the AO.
Acknowledgements
KD acknowledges the support of the Institute of Marine Research in Bergen Norway and the IMBeR regional programme Ecosystem Studies of Subarctic and Arctic Seas (ESSAS).
Additional information
Funding
References
- Ambaum, M. H. P., Hoskins, B. J. and Stephenson, D. B. 2001. Arctic Oscillation or North Atlantic Oscillation? J. Clim. 14, 3495–3507. doi: 10.1175/1520-0442(2001)014<3495:AOONAO>2.0.CO;2
- Báez, J. C., Gimeno, L., Gómez-Gesteira, M., Ferri-Yáñez, F. and Real, R. 2013. Combined effects of the North Atlantic Oscillation and the Arctic Oscillation on sea surface temperature in the Alborán Sea. PLoS One 8, e62201. doi: 10.1371/journal.pone.0062201
- Berx, B., Hansen, B., Østerhus, S., Larsen, K. M., Sherwin, T. and co-authors. 2013. Combining in situ measurements and altimetry to estimate volume, heat and salt transport variability through the Faroe–Shetland Channel. Ocean Sci. 9, 639–654. doi: 10.5194/os-9-639-2013
- Biastoch, A., Böning, C., Getzlaff, J., Molines, J.-M. and Madec, G. 2008. Causes of interannual-decadal variability in the meridional, overturning circulation of the mid-latitude North Atlantic Ocean. J. Clim. 21, 6599–6615. doi: 10.1175/2008JCLI2404.1
- Bjerknes, J. 1964. Atlantic air-sea interactions. Adv. Geophys 10, 1–82. doi: 10.1016/S0065-2687(08)60005-9
- Booth, B. B. B., Dunstone, N. J., Halloran, P. R., Andrews, T. and Bellouin, N. 2012. Aerosols implicated as a prime driver of twentieth-century North Atlantic climate variability. Nature 484, 228–232. doi: 10.1038/nature10946
- Cayan, D. R. 1992. Latent and sensible heat flux anomalies over the Northern Oceans: The connection to monthly atmospheric circulation. J. Clim. 5, 354–369. doi: 10.1175/1520-0442(1992)005<0354:LASHFA>2.0.CO;2
- Cess, R. D., Zhang, M. H., Minnis, P., Corsetti, L., Dutton, E. G. and co-authors. 1995. Absorption of solar radiation by clouds: Observations versus models. Science 267, 496–499. doi: 10.1126/science.267.5197.496
- Clement, A., Bellomo, K., Murphy, L. N., Cane, M. A., Mauritsen, T. and co-authors. 2015. The Atlantic Multidecadal Oscillation without a role for ocean circulation. Science 350, 320–324. doi: 10.1126/science.aab3980
- Clement, A., Cane, M. A., Murphy, L. N., Bellomo, K., Mauritsen, T. and co-authors. 2016. Response to Comment on “The Atlantic Multidecadal Oscillation without a role for ocean circulation”. Science 352, 1527. doi: 10.1126/science.aaf2575
- Cohen, J. L., Furtado, J. C., Barlow, M. A., Alexeev, V. A. and Cherry, J. E. 2012. Arctic warming, increasing snow cover and widespread boreal winter cooling. Environ. Res. Lett. 7, 014007. doi: 10.1088/1748-9326/7/1/014007
- Cohen, J., Screen, J. A., Furtado, J. C., Barlow, M., Whittleston, D. and co-authors. 2014. Recent Arctic amplification and extreme mid-latitude weather. Nat. Geosci. 7, 627–637. doi: 10.1038/ngeo2234
- Deser, C., Alexander, M. A., Xie, S.-P. and Phillips, A. S. 2010. Sea surface temperature variability: Patterns and mechanisms. Annu. Rev. Mar. Sci. 2, 115–143. doi: 10.1146/annurev-marine-120408-151453
- Deser, C. and Blackmon, M. L. 1993. Surface climate variations over the North Atlantic Ocean during winter: 1900-1989. J. Clim. 6, 1743–1753. doi: 10.1175/1520-0442(1993)006<1743:SCVOTN>2.0.CO;2
- Drinkwater, K. F., Belgrano, A., Borja, A., Conversi, A., Edwards, M. and co-authors. 2003. The response of marine ecosystems to climate variability associated with the North Atlantic Oscillation. In: The North Atlantic Oscillation, Climatic Significance and Environmental Impact. Geophysical Monograph Series 134 (eds. J. Hurrell, Y. Kushnir, G. Ottersen, and M. Visbeck). American Geophysical Union, Washington, DC, pp. 211–234.
- Enfield, D. B., Mestas-Nuñez, A. M. and Trimble, P. J. 2001. The Atlantic multidecadal oscillation and its relation to rainfall and river flows in the continental U.S. Geophys. Res. Lett. 28, 2077–2080. doi: 10.1029/2000GL012745
- Feldstein, S. B. 2003. The dynamics of NAO teleconnection pattern growth and decay. Q. J. R. Meteorol. Soc. 129, 901–924. doi: 10.1256/qj.02.76
- Francis, J. A. and Vavrus, S. J. 2012. Evidence linking Arctic amplification to extreme weather in mid-latitudes. Geophys. Res. Lett. 39, L06801
- Garrett, C. and Toulany, B. 1981. Variability of the flow through the Strait of Belle Isle. J. Mar. Res. 39, 163–189.
- Gillett, N. P., Stone, D. A., Stott, P. A., Nozawa, T., Karpechko, A. Y. and co-authors. 2008. Attribution of polar warming to human influence. Nat. Geosci. 1, 750–754. doi: 10.1038/ngeo338
- Goldenberg, S. B., Landsea, C. W., Mestas-Nunez, A. M. and Gray, W. M. 2001. The recent increase in Atlantic hurricane activity: Causes and implications. Science 293, 474–479. doi: 10.1126/science.1060040
- Grist, J. P., Josey, S. A., Marsh, R., Good, S. A., Coward, A. C. and co-authors. 2010. The roles of surface heat flux and ocean heat transport convergence in determining Atlantic Ocean temperature variability. Ocean Dyn. 60, 771–790. doi: 10.1007/s10236-010-0292-4
- Gulev, S. K., Latif, M., Keenlyside, N., Park, W. and Koltermann, K. P. 2013. North Atlantic Ocean control on surface heat flux on multidecadal timescales. Nature 499, 464–467. doi: 10.1038/nature12268
- Hanna, E. and Cropper, T. 2017. North Atlantic Oscillation. Oxford Research Encyclopedia of Climate Science. doi: 10.1093/acrefore/9780190228620.013.22
- Hanna, E., Cropper, T. E., Jones, P. D., Scaife, A. A. and Allan, R. 2015. Recent seasonal asymmetric changes in the NAO (a marked summer decline and increased winter variability) and associated changes in the AO and Greenland Blocking Index. Int. J. Climatol. 35, 2540–2554. doi: 10.1002/joc.4157
- Hansen, B., Larsen, K. M. H., Hátún, H., Kristiansen, R., Mortensen, E. and co-authors. 2015. Transport of volume, heat, and salt towards the Arctic in the Faroe Current 1993–2013. Ocean Sci. 11, 743–757. doi: 10.5194/os-11-743-2015
- Hartmann, D. L. 2016. Global Physical Climatology. Elsevier, Amsterdam. ISBN 978-0123285317.
- Hurrell, J. W. 1995. Decadal trends in the North Atlantic Oscillation region temperatures and precipitation. Science 269, 676–679. doi: 10.1126/science.269.5224.676
- Hurrell, J. W., Kushnir, Y., Ottersen, G. and Visbeck, M. 2003. An overview of the North Atlantic Oscillation. In: The North Atlantic Oscillation. Climate Significance and Environmental Impact (ed. J. W. Hurrell). American Geophysical Union, Washington DC, pp. 1–35.
- Jónsson, S. and Valdimarsson, H. 2012. Water mass transport variability to the North Icelandic shelf, 1994–2010. ICES J. Mar. Sci. 69, 809–815. doi: 10.1093/icesjms/fss024
- Kawamura, R. 1994. A rotated EOF analysis of global sea surface temperature variability with interannual and interdecadal scales. J. Phys. Oceanogr. 24, 707–715. doi: 10.1175/1520-0485(1994)024<0707:AREAOG>2.0.CO;2
- Knight, J. R., Allan, R. J., Folland, C. F., Vellinga, M. and Mann, M. E. 2005. A signature of persistent natural thermohaline circulation cycles in observed climate. Geophys. Res. Lett. 32, L20708. doi: 10.1029/2005GL024233
- Kostianoy, A. G. and Nihoul, J. C. J. 2009. Frontal zones in the Norwegian, Greenland, Barents and Bering Seas. In: Influence of Climate Change on the Changing Arctic and Sub-Arctic Conditions (ed. J. C. J. Nihoul). Springer, Netherlands, pp. 171–190.
- Moore, G. W. K., Renfrew, I. A. and Pickart, R. S. 2012. Spatial distribution of air-sea heat fluxes over the sub-polar North Atlantic Ocean. Geophys. Res. Lett. 39, L18806.
- Mori, M., Watanabe, M., Shiogama, H., Inoue, J. and Kimoto, M. 2014. Robust Arctic sea-ice influence on the frequent Eurasian cold winters in past decades. Nat. Geosci. 7, 869–873. doi: 10.1038/ngeo2277
- Ottera, O. H., Bentsen, M., Drange, H. and Suo, L. 2010. External forcing as a metronome for Atlantic multidecadal variability. Nat. Geosci. 3, 688–694. doi: 10.1038/ngeo955
- Overland, J. E., Wood, K. R. and Wang, M. 2011. Warm Arctic–cold continents: climate impacts of the newly open Arctic Sea. Polar Res. 30, 15787. doi: 10.3402/polar.v30i0.15787
- Pfahl, S., Schwierz, C., Croci-Maspoli, M., Grams, C. M. and Wernli, H. 2015. Importance of latent heat release in ascending air streams for atmospheric blocking. Nat. Geosci. 8, 610–614. doi: 10.1038/ngeo2487
- Rogers, J. C. 1985. Atmospheric circulation changes associated with the warming over the North Atlantic in the 1920s. J. Clim. Appl. Meteor. 24, 1303–1310. doi: 10.1175/1520-0450(1985)024<1303:ACCAWT>2.0.CO;2
- Rosenfeld, D. 2006. Aerosol-cloud interactions control of earth radiation and latent heat release budgets. Space Sci. Rev. 125, 149–157. doi: 10.1007/s11214-006-9053-6
- Screen, J. A. and Simmonds, I. 2010. The central role of diminishing sea ice in recent Arctic temperature amplification. Nature 464, 1334–1337. doi: 10.1038/nature09051
- Seager, R., Kushnir, Y., Visbeck, M., Naik, N., Miller, J. and co-authors. 2000. Causes of Atlantic Ocean climate variability between 1958 and 1998. J. Clim. 13, 2845–2862. doi: 10.1175/1520-0442(2000)013<2845:COAOCV>2.0.CO;2
- Serreze, M. C. and Francis, J. A. 2006. The Arctic amplification debate. Clim. Change 76, 241–264. doi: 10.1007/s10584-005-9017-y
- Slonosky, V. C., Mysak, L. A. and Derome, J. 1997. Linking arctic sea-ice and atmospheric circulation anomalies on interannual and decadal time scales. Atmos.-Ocean 35, 333–366. doi: 10.1080/07055900.1997.9649596
- Stenseth, N.-C., Ottersen, G., Hurrell, J. W. and Belgrano, A. (Eds.). 2004. Marine Ecosystems and Climate Variation. Oxford University Press, Oxford, 252 pp.
- Sutton, R. T. and Hodson, D. L. R. 2005. Atlantic Ocean forcing of North American and European summer climate. Science 309, 115–118. doi: 10.1126/science.1109496
- Tanaka, H. L. and Tamura, M. 2016. Relationship between the Arctic oscillation and surface air temperature in multi-decadal time-scale. Polar Sci. 10, 199–209. doi: 10.1016/j.polar.2016.03.002
- Tang, Q., Zhang, X., Yang, X. and Francis, J. A. 2013. Cold winter extremes in northern continents linked to Arctic sea ice loss. Environ. Res. Lett. 8, 014036. doi: 10.1088/1748-9326/8/1/014036
- Thompson, D. W. J. and Wallace, J. M. 1998. The Arctic oscillation signature in the wintertime geopotential height and temperature fields. Geophys. Res. Lett. 25, 1297–1300. doi: 10.1029/98GL00950
- Thompson, D. W. J. and Wallace, J. M. 2001. Regional climate impacts of the Northern Hemisphere annular mode. Science 293, 85–89. doi: 10.1126/science.1058958
- Trenberth, K. E. and Smith, L. 2009. Variations in the three-dimensional structure of the atmospheric circulation with different flavors of El Niño. J. Clim. 22, 2978–2991. doi: 10.1175/2008JCLI2691.1
- Wallace, J. M. and Thompson, D. W. J. 2002. The Pacific center of action of the northern hemisphere annular mode: Real or artifact? J. Clim. 15, 1987–1991. doi: 10.1175/1520-0442(2002)015<1987:TPCOAO>2.0.CO;2
- Walker, G. T. and Bliss, E. W. 1932. World weather V. Mem. Roy. Met. Soc 4, 53–84.
- Yoshimori, M., Abe-Ouchi, A., Watanabe, M., Oka, A. and Ogura, T. 2014. Robust seasonality of Arctic warming processes in two different versions of MIROC GCM. J. Clim. 27, 6358–6375. doi: 10.1175/JCLI-D-14-00086.1
- Zhang, R., Delworth, T. L., Sutton, R., Hodson, D. L. R., Dixon, K. W. and co-authors. 2013. Have aerosols caused the observed Atlantic multidecadal variability? J. Atmos. Sci. 70, 1135–1144. doi: 10.1175/JAS-D-12-0331.1
- Zhang, R., Sutton, R., Danabasoglu, G., Delworth, T. L., Kim, W. M. and co-authors. 2016. Comment on “The Atlantic Multidecadal Oscillation without a role for ocean circulation”. Science 352, 1527. doi: 10.1126/science.aaf1660
- Zhao, J.-P., Cao, Y. and Shi, J.-X. 2006. Core region of Arctic oscillation and the main atmospheric events impact on the Arctic. Geophys. Res. Lett. 33, L22708. doi: 10.1029/2006GL027590
- Zhao, J.-P., Cao, Y. and Shi, J.-X. 2010. Spatial variation of the Arctic Oscillation and its long-term change. Tellus A 62, 661–672. doi: 10.1111/j.1600-0870.2010.00472.x
- Zhao, J.-P., Cao, Y. and Wang, X. 2018. The physical significance of the synthetic running correlation coefficient and its applications in oceanic and atmospheric studies. J. Ocean Univ. China 17, 451–460. doi: 10.1007/s11802-018-3798-x
- Zhao, J.-P. and Drinkwater, K. 2014. Multiyear variation of the main heat flux components in the four basins of Nordic Seas. J. Ocean Univ. China 44, 9–19. (In Chinese with English abstract).