
 ?Mathematical formulae have been encoded as MathML and are displayed in this HTML version using MathJax in order to improve their display. Uncheck the box to turn MathJax off. This feature requires Javascript. Click on a formula to zoom.
Abstract
A variety of drought monitoring tools are being used for early warning systems and formulating drought mitigation policies. Standardized Drought Indices (SDI) are the most commonly used. However, the use of SDI at multiple stations located in a homogenous climatic region with internally similar characteristics and contagious in space arises several problems due to spatial and temporal behaviour in data preliminaries. Therefore, a comprehensive procedure is required to accumulate information coming from multiple stations. In this paper, we proposed a new procedure for regional drought monitoring: the Spatially Weighted Accumulated Drought Index (SWADI). The potential of the proposed procedure is based on steady-state probabilities, which were used as a weighting scheme for the prospective of accumulating information from different stations. We employed the proposed procedure on six meteorological stations of the Northern areas of Pakistan. The performance of the proposed procedure is observed based on three commonly used drought indices at a one-month time scale. This research provides a basis for the development and enhancement of drought hazards' characterization, motivates researchers and policymakers to use the accurate and more representative temporal characterization of drought hazard in a specific homogenous climatic region.
1. Introduction
Drought is the most ambiguous and least understood of all-natural hazards, affecting more people than any other hazard (Hagman et al., Citation1984). It is one of the most pertinent natural disasters and becomes a severe threat to policymakers and mitigation management (Güneralp et al. 2015). Due to being a complex, challenging to monitor and its recurrence for the past several decades, various studies focused on the consequences of drought and incompetence of the many societies to efficiently mitigate impacts in the short-run and minimize susceptibility in the longer-term (McCarthy et al., Citation2001). Vulnerability to drought is growing, and it is affecting most parts of the world in several ways, such as significant effect on the economy (Wang et al., Citation2020), influences in hydrological energy (Conway et al., Citation2017), reduce agriculture production due to scarcity in rainfall (Agnoletti et al., Citation2019).
The accurate monitoring of drought at the regional level makes a positive impact on the countries' stability and economy (Parsons et al., Citation2019). However, accurate estimation of drought indices requires long-term records of regionally representative gauge stations for regional drought forecasting and early warning about future drought. It has been attempted to improve the level of preparation for drought by building better early warning systems and adopting drought policies, response and mitigation plans for the regional and national level (Gerber & Mirzabaev, Citation2017). For these policies and drought monitoring, the characterization of drought is often measured by standardized procedures that are developed for improving the classification accuracy (Bezdan et al., Citation2019). Several studies provide various Standardized Drought Indices (SDI) (Erhardt and Czado, Citation2018), such as the Standardized Precipitation Index (SPI) (McKee et al., Citation1993), Reconnaissance Drought Index (RDI) (Tsakiris et al., Citation2007), Standardized Precipitation Evapotranspiration Index (SPEI) (Vicente-Serrano et al., Citation2010a, Citation2010b) and Standardized Precipitation Temperature Index (SPTI) (Ali et al., Citation2017).
Moreover, Svoboda and Fuchs (Citation2016) provide a comprehensive list of corresponding parameters for the above indices. The uncertainty about accurate drought characterization under different procedures always exists because of the subjective approach of selecting the probability distribution, error in distribution, geographical characteristics and parameter used in each index (Stagge et al., Citation2015). Therefore, for a better understanding and mitigation policies for drought, specifically at a regional level, it is essential to discover such strategies that help researchers, data analysts and policymakers to use the precise and more representative temporal characterization of drought hazard in a specific region.
The regional identification of drought can be made for a specific region by using drought monitoring tools at multiple gauge stations. The various gauge stations located in a homogenous climatic area cause several problems in data analysis and re-analysis. Usually, the unsuitable presence of gauge stations distributed over the region without any complete drought monitoring framework can be complied with misleading conclusions. Furthermore, the spatial pattern in drought is quite complicated. It is widespread that one area has a wet condition, while nearby is a dry condition; thus, complexity in spatiotemporal characteristics of drought data gives inaccurate information for drought monitoring and analysis.
Further, such kind of problems are discussed in the literature for several countries as Nigeria (Oladipo, Citation1995), Turkey (Umran Komuscu, Citation1999), Canada (Nkemdirim & Weber, Citation1999), England (Fowler & Kilsby, Citation2002) and Spain (Rozas et al., Citation2015). Recently, several authors worked to define and assess the homogenous climatic region (Santos et al., Citation2011). An analysis at the regional level becomes chaotic due to multiple factors involved in it (Vicente-Serrano et al., Citation2010a, Citation2010b). The existence of these factors depends on the climatic parameters, choice of the stations and historical accessibility of data on the environment. Thus, capturing spatial and temporal behaviour in drought phenomenon and trends of the region positively effects on efficient drought monitoring (Livada & Assimakopoulos, Citation2007). Therefore, a comprehensive procedure is required to accumulate information coming from multiple sources.
In this study, we aimed to develop a new drought assessment procedure for regional drought monitoring: the Spatially Weighted Accumulated Drought Index (SWADI). We applied the proposed procedure on six meteorological stations considered as a cluster in the Northern areas of Pakistan at a one-month time scale (scale-1). We also applied it with commonly used regional classification and categorization drought indices, the SPI, SPEI and SPTI.
2. Methods
2.1. Standardized Drought Index (SDI)
SDI is the most frequently used tool for drought monitoring. Characterization of droughts depending upon the type of drought based on SDI requires time-series data for a particular variable or group of variables. This study incorporates three SDI, namely, SPI, SPEI and SPTI. A brief explanation for each index is as follows:
A drought index is called SPI, developed by McKee et al. (Citation1993), based on over a long period precipitation records to compute the precipitation scarcity for different time scales of the single monitoring station. In SPI, monthly cumulative precipitation time-series data is used to normalize the suitable probability distributions to estimate the quantitative values. Positive and negative SPI values indicate greater than or less than median precipitation, respectively. The main criticism of SPI is that it is based on one variable data and does not consider the effect of another variable such as temperature, evapotranspiration, wind speed, etc. Parallel to this (McKee et al., Citation1993; Vicente-Serrano et al., Citation2010a, Citation2010b), a new drought index was proposed, called SPEI, based on climatic data such as precipitation and temperature. In this index, calculation and mathematical formulation are quite the same as for SPI, also called the water balance model. One significant advantage observed in SPEI over SPI is that it comprises the influence of the evaporation in the domain. The mathematical structure of representing the water balance equation on which SPEI is based can be written as (see EquationEquation (1)(1)
(1) ):
(1)
(1)
where in
is the moisture deficit at the month
denoting the difference between the
and
and the total monthly amount of precipitation is denoted by
while the estimated amount of Potential Evapotranspiration (PET) is denoted by
In SPEI, the estimated value of PET is used for calculation instead of actual evaporation, which leads to one of the drawbacks of this drought index. Like SPI and SPEI, Ali et al. (Citation2017) proposed the multiscalar drought index, SPTI, to characterize drought in both cold and hot climate regions. There is no mathematical contention in the SPTI mechanism. The procedure for SPTI estimation can be described in two steps as follows. In step one, for each selected station, a De Marton Aridity Index (DAI) is evaluated by utilizing total precipitation of the month and monthly average temperature by the following equation:
(2)
(2)
Where De Marton Aridity Index is denoted by and
is the total monthly precipitation and
denotes the mean monthly temperature. In the second step, we use appropriate probability distributions for its standardization; for a detailed description see Ali et al. (Citation2017).
2.2. Markov chain and steady-states probabilities
A stochastic process is a collection of random variables indexed by time (Keizer, Citation1987). The functional accessibility for the stochastic process in discrete-time and continuous-time is described in Chattopadhyay et al. (Citation2012). When the state space is continuous, it is called a Markov process regardless of whether the parameter (or time) is discrete or continuous, and when the Markov process is discrete-valued (i.e. discrete state space) it will be called a Markov chain. The availability of Markov chains is reasonably common and relatively simple (Aggoun and Elliott, 1995; Srikanthan and McMahon, Citation2001). Further, the detailed information about the Markov chain is given in Häggström (Citation2002).
The Markov process primarily consists of a group of transitions measured by some probability distributions that satisfy the interesting mathematical properties, for example, the subsequent event is independent of each other (Klein et al., Citation1984). The results are calculated and interpreted under these properties accordingly. One of the essential properties of the Markov models is ‘memoryless’, which just means that the dependence of the next state only on the current state (where the experiment is being performed), not on the sequence of states before that (Andersen and Goodman, 1957).
Moreover, the system does not need to remain in one condition; it will keep moving from one state to another state in future periods. However, the average probability of moving from one state to another state for all periods will remain constant in the long run. The average probabilities that the system will be in a particular state after many transition periods are called steady-state probabilities. In a Markov process, the probabilities will approach a steady-state after several periods have been passed. The steady-state probabilities can be formalized as:
(3)
(3)
where in EquationEquation (3)
(3)
(3)
indicates the steady-state probabilities, and t denotes the time of the process.
Further, a detailed mathematical description of the steady-state probabilities of the Markov chain is available in Stewart (Citation2009). In this research, we collected information from various stations by using the long-term behaviour of the drought classes from different stations of the region on the one-month time scale. In the proposed procedure, steady-state probabilities are used as weights to accumulate information from varying stations.
3. The proposed procedure for categorization of drought
Before discussing the four phases of our procedure, we need to define the region and meteorological stations (see ). Details are as follows:
Fig. 1. Flow chart of the proposed procedure.
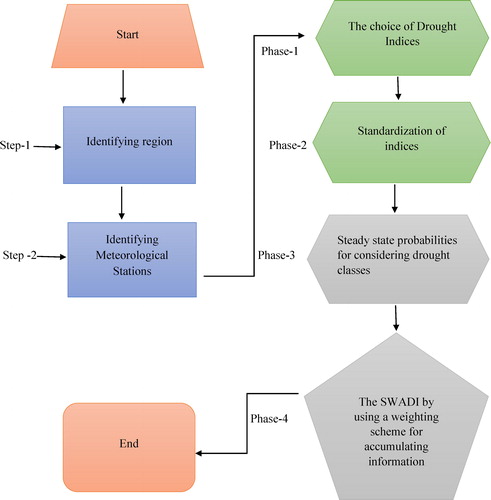
Identifying region: This step decides a specific region that is being assimilated for regional drought monitoring. The suitable selection of region for drought monitoring is a crucial step that will strengthen province or country-level strategies for drought mitigation. It will also be helpful for competent and proficient drought monitoring.
Identifying meteorological stations: Once we have selected any significant region for study, then in the second step, it requires an appropriate choice for meteorological stations/monitoring stations existing in the specific region. We know that comprehensive climatic information has a significant role in statistical inferences and drought analysis. Along these lines, the meteorological stations, which have influences for statistical inference and observed as rich drought monitoring history (Jamro et al., Citation2019), are chosen for the study. After describing the above two points, the proposed framework's structure will be executed in four phases. The following subsections have an inclusive description.
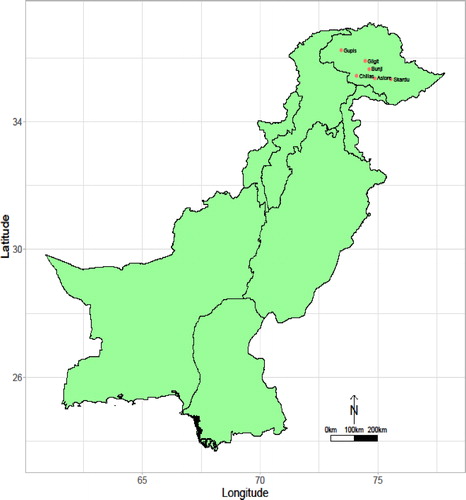
Here, we will discuss the four phases of our proposed procedure that is based on the accumulative information coming from multiple sources to use the accurate and more representative temporal characterization of drought hazard in a specific region (see ).
Fig. 2. Geographical locations of the six selected stations of the Northern area of Pakistan.
3.1. Phase 1: the choice of drought indices
This phase involves in choice of drought indicator from the list of all available drought indicators of the SDI procedure. The various drought indicators are described in the standardized procedure (see Svoboda and Fuchs, Citation2016). In Section 2, we have briefly discussed a summary of various SDI indicators and their applications. The selection of climatic parameters and the time scale to estimate multiscalar drought indices are the primary concern in this phase. Subject to nature, depending on climatic, tropical status and soil type, several climatic parameters such as temperature, precipitation, solar radiation, humidity, etc., are required for various drought indices. Hence, to precise and reliable drought monitoring, the optimized choice of drought indices and their estimation procedure can be meaningful. Specifically, this step includes in-depth information about the following issues:
The recognition of the accessibility of the time-series data on the climatic parameters and nature of the gauging station.
The suitable choice of multiscalar drought indicator (i.e. SPI, SPEI, SPTI) can be made with the available data.
Selection of specific time scale. In this step, the appropriate time scale is being selected for multiscalar drought indices. For instance, short time scales are proposed for meteorological (Guttman, Citation1998). In contrast, monitoring agricultural and hydrological drought is specified with a longer time scale (Gidey et al., Citation2018).
3.2. Phase 2: standardization of indices
This phase is related to the standardization of indices after the selection of drought indicators. The next step is to standardize values using suitable methods of estimation. Let
(
) be a time-series data of each station, then the candidacy of appropriate probability distribution will be considered for standardization. In this work, more specifically, 32 most frequently used probability distributions were applied to perceive the most suitable probability distribution. The list of these distributions is available in propagate (Spiess, Citation2014) package of R. The well-fitted distribution is selected for each station's time series based on minimum values of Akaike Information Criteria (AIC) and Bayesian Information Criteria (BIC). Further, the mathematical description for standardization by Cumulative Distribution Function (CDF) of well-fitted distribution is described in Thom (Citation1966) and Naresh Kumar et al. (Citation2009).
3.3. Phase 3: steady-state probabilities for considering drought classes
Markov chain details about steady states and their application are given in Section 2.2. For our proposed procedure, this phase considers the classification of drought classes using steady-state probabilities as a weighting scheme. This weighting scheme is applied on varying scales of SPI, SPEI and SPTI index for six stations that were selected for the study. Consider, in general,
….
be the drought classification states of SDI type processes (in our cases, we have considered seven drought classes, see ). Further, we have contemplated qualitative time-series data of drought classes as a discrete Markov process for SDI (i.e. SPI, SPEI and SPTI). The time-series data of various drought classes are given in , weighted by steady-state probabilities. The steady-state probability vector of the process for SDI can be defined for classes of Extremely Dry (ED), Severely Dry (SD), Median Dry (MD), Normal Dry (ND), Median Wet (MW), Severely Wet (SW) and Extremely Wet (EW) with their probabilities in the long run
as follows:
Table 2. An initial classification of drought categories based on the values of the SDI.
We have proposed steady-state probabilities as weights in accumulation criterion. The theory and application of steady-state probabilities are described in Section 2.2 accordingly; hence, the limiting probability of each state in each index is 1 × 7-row vector denoted by the following expressions:
(4)
(4)
(5)
(5)
(6)
(6)
These vectors (steady-state probabilities) are the long-term behaviour of drought classes (states), and these probabilities are used as weights for each drought class. Further, the steady-state probabilities corresponding to the drought classes define the visit of the drought class in the long run. For example, the visits of the particular classes in the long run in the SPI index can be observed from EquationEquation (4)(4)
(4) .
3.4. Phase 4: the SWADI by using a weighting scheme for accumulating information
The vector of the stationary spreading of drought classes can be signified by
These vectors designate the proportion or averaged long-term probabilities of drought classes in each index for all selected stations. It means that the visit of a particular drought class in the long term can be identified by the steady-state probability of drought class corresponding to the drought index. Hence, to accumulate the decisions and to adjust the inaccurate determination of drought classes, this study proposes a procedure that considers only those drought classes which take a more considerable value of the corresponding probabilities. The mathematical form for the proposed procedure is presented for SPI index at scale-1 for selected stations named as Astore, Bunji, Gupis, Chilas, Gilgit, and Skardu as follows:
The interpretation of the proposed procedure is straightforward; to avoid complexity in mathematical equations, we presented it only for SPI for selected stations at scale-1. Equation (7) comprises six stations of an index SPI at scale-1. In this situation, at a time scale-1 in SPI, probably every station may have different drought classes. For example, Astore station has a SW condition, Bunji has ND, Gupis has SW while Chilas, Gilgit and Skardu have SD, ED and ND, respectively. For this scenario, the classes in each index (SPI, SPEI and SPTI) at different time scales were weighted by transient probabilities and steady-state probabilities (Ali et al., Citation2019, Citation2020). Where the classes which received maximum weights among the indices concerning time scale and station had to select for their indices. However, in the proposed procedure, with respect to time scale and index, the classes which receive maximum weights among the stations would be selected for SWADI. It is based on the more considerable value of the corresponding steady-state probabilities. More specifically, one can say that the drought classes which would be selected among stations, have larger values of average long-run probabilities (proportions) in a particular month for a particular station and scale. For example, using SPI at scale-1, weights are given for all drought classes of six stations using a steady-state probabilities scheme, among these stations, a class says ‘ND’ in Skardu for January 1971 receives maximum average long-run probability (0.6836, see ) would be selected as a suitable class for analysis. The same selection criteria are used to find the suitable vector of drought classes of SPI at scale-1 among six stations for every month of each year from long time-series data range from January 1971 to December 2017. We called it the new spatially accumulative vector of drought classes, and this will be quantified as a SWADI (see Equation (7)). Similarly, weights are assigned in the SPEI and SPTI index for selected stations at scale-1.
Table 4. Steady-state probabilities for seven drought classes at scale-1 on varying indices (SPI, SPEI and SPTI) for selected stations.
4. Application
In this study, the initial application of the proposed procedure is made on six meteorological stations of Northern regions in Pakistan (see ). The more substantial part of the country falls in the highest temperature (Jilani et al., Citation2007). However, due to the high altitude and the structural impact on the country's boundary, the role of Northern regions has significant importance in the overall climatology of the country (Awan, Citation2002). Particularly climate change of Northern areas influences the irrigation of the agriculture sector in Pakistan. So, the dependency of other regions of the country is positively linked with the selected region.
Moreover, the country has four seasons' onset and duration of these seasons vary significantly from region to region. In recent years, several parts of the country are shockingly influenced by drought due to the growing consequences of climate change and global warming (Malik et al., Citation2012). Like other parts of the world, Pakistan is facing many challenges related to water deficiency and water contamination. Due to the recurrent occurrence of drought, the overall economy of the country has severely disturbed. Especially in Tharpakar (Sindh, Province of Pakistan), several human deaths have been reported from the last three decades. Hence, it is the need of the hour to strengthen drought monitoring module and drought mitigation policies by developing a comprehensive and well-managed collection of drought monitoring tools and frameworks. To evaluate the potential of the proposed procedure, the required long time-series data of precipitation and temperature of various meteorological stations of Northern regions are manipulated. For this research, the secondary data ranging from January 1971 to December 2017 are collected from the Pakistan Meteorological Department through the Karachi Data Processing centre (KDPC). The dataset fulfills the requirement of the World Meteorological Organization (WMO) and has been cited in our recent publication (see Ali et al., Citation2019).
4.1. Results and discussion
In , some brief statistics are given for precipitation, maximum and minimum temperature of six selected stations; and classification of drought's classes (Li et al., Citation2015) is given in . Where the value of the SDI measures the severity of the drought, for example, if the computed drought index less than or equals to −2, then it can be considered the ED, and other severity of the drought also can be observed from the given criteria for the classification. However, this classification can be modified based on socio-economic analysis or geographic considerations and experience. The varying probability distributions are used to consider at one time scales for all indices. This process is done by using R package named as propagate. Here, the smallest value of BIC for the distribution is the criteria that is used for further standardization for all time scales of SPI, SPEI and SPTI indicators according to the approximation (as described in Section 2.1).
Table 1. The climatology characteristics during the period 1971–2017 of six selected stations.
The BIC values of selected probability distributions for SPI, SPEI and SPTI at scale-1 for six stations are given in , where we can observe that for SPI three parameters (3P) Weibull distribution has a minimum value of BIC (−1036.51) for Astore station, (3P) Weibull with a minimum value of BIC (−1030.98) for Bunji station, 4P Beta Weibull with a minimum value of BIC (−788.07) for Gupis station, 4P Beta with a minimum value of BIC (−805.61) in Chilas station, 3P Weibull with a minimum value of BIC (−1097.48) for Gilgit station and 3P Weibull with a minimum value of BIC (−735.12) for Skardu station. Moreover, for SPEI at scale-1, the Johnson SB distribution was selected for Bunji, Gupis and Gilgit and the Trapezoidal distribution for Astore and Skardu. Further, we can see that for SPTI at scale-1, the Johnson distribution for the Skardu station and 4P Beta for the Gupis station have minimum BIC values −590.05 and 374.23, respectively, and the (3P) Weibull has a minimum value of BIC −483.52, 188.45, 275.42 and 164.62 for Astore, Bunji, Chilas and Gilgit, respectively. These are the distributions that CDFs are being used to obtain standardized values. However, in the field of hydrology and related discipline, the Weibull distribution has some applications (Nielsen et al., Citation1996), and it has a better-quality of candidacy for standardization.
Table 3. BIC of selected probability distributions for SPI, SPEI and SPTI on six stations at scale-1.
The construction of SWADI is based on steady-state probabilities matrices using Markochain (Spedicato et al., Citation2016) R package. Long-term behaviour of each drought category is quantified using steady-state probabilities by using temporal qualitative values categorized by severity level of drought. The steady-state probabilities of each drought category are used as weights. These weights are assigned for all stations with a particular index and scale (i.e. scale-1). The drought class, which has maximum values of corresponding steady-states probabilities, is considered for the separate vector among six stations at scale-1 for a particular index; the resultant vector is called the SWADI index. shows all results of steady-state probabilities of SPI, SPEI and SPTI indices for the selected stations at scale-1. Here, NA values indicate the nonappearance of drought categories in the temporal vector of drought classification state. The estimates of correlation coefficients among different stations at scale-1 () show that stations are significantly correlated, among others, for three indices called SPI, SPEI and SPTI. That means from the homogeneous characteristics of the selected station's information can be accumulated.
Table 5. Correlation coefficients among different stations at scale-1.
The theoretical versus empirical histograms for SPI at scale-1 (SPI-1) for six stations are presented in . In this figure, the bins on the horizontal axis represent ranges of data, and the ratio of the relative frequency of any specified bins' interval to its width size is denoted by density on the vertical axis. It can be observed from that Gilgit and Gupis stations have more closeness between theoretical and empirical. At the same time, discrepancy still arises in other stations. This discrepancy is due to the natural behaviour of data and cannot be simply controlled. To address this deviation issue, some authors have suggested nonparametric function based standardization (Farahmand and Aghakouchak, Citation2015), while some are working with mixture distribution functions (Mallya et al., Citation2015). However, yet the issue is not appropriately addressed. In this paper, the creation of varying distribution concepts to estimate drought indices is straightforward adopted (Stagge et al., Citation2015). Besides, by rationale of our criterion, the use of long-term behaviour can overcome the effect of extreme values in reporting a particular drought class. In , the temporal behaviour of the SPI index and proposed index SWADI are graphically presented at scale-1 for six stations.
Fig. 3. Theoretical vs. empirical histograms of selected distributions for six stations.
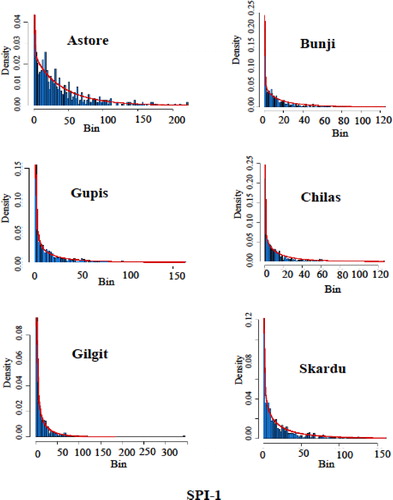
Fig. 4. Temporal plots of SPI index for six stations and SWADI at scale-1.
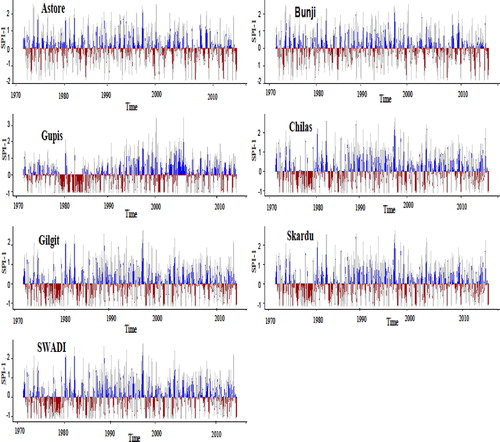
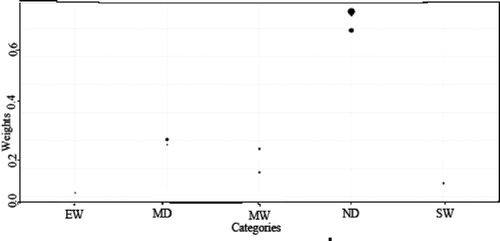
Furthermore, on the same rationale and procedure of SPI at scale-1, the SPEI and SPTI drought indices are estimated for selected stations at scale-1. In , the count-plot for drought categories versus steady-state probabilities weights are shown for Astore station, and for station Bunji at scale-1, the count-plot for drought categories versus steady-state probabilities weights are shown in , which show that how much weights are assigned for the drought classes. The intensity in the colour of the dot shows the more weight assigned for the particular class; for example, in Astore station, the ND takes more weights as compared to other drought classes.
Fig. 5. Count-plot for drought categories vs steady-state probabilities weights for Astore at scale-1.
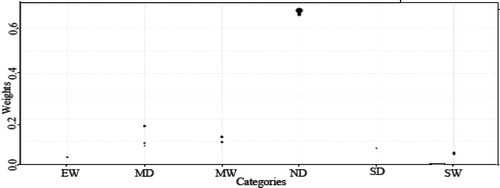
Fig. 6. Count-plot for drought categories vs steady-state weights for Bunji at scale-1.
5. Conclusion
The use of accurate and more representative temporal characterization of drought hazard in a specific region will efficiently work for analysts and policymakers in building their plans to improve and strengthen the skill of drought prediction. The use of drought monitoring tools at multiple gauge stations placed in a homogenous climatic region sets specific problems in data analysis. The study suggested a new procedure for regional drought monitoring: the SWADI. In this procedure, accumulative information is obtained from multiple gauge stations of the homogenous climatic region to characterize drought classes of scale-1 on three indices using steady-state probabilities as a weighting scheme. The initial configuration of the SWADI procedure comprised of SDI at scale-1. SDI drought indices, including SPI, SPEI and SPTI, are used for drought characterization of six meteorological stations of the Northern area of Pakistan. From the conclusions of the literature, outcomes and analysis of this paper, we have been finishing with the following points:
It is usually a time-consuming practice to collect similar information from multiple sources.
In a homogenous environment a specific the index will produce similar results on varying stations.
These above two problems can be resolved by using this proposed index SWADI.
Moreover, the SWADI assimilates for various stations in the spatiotemporal structure of time series.
Acknowledgement
The authors extend their appreciation to the Deanship of Scientific Research at King Saud University for funding this work (research group number RG-1439-015).
Disclosure statement
No potential conflict of interest was reported by the authors.
References
- Aggoun, L. and Elliott, R. J. 1995. Finite-dimensional models for hidden Markov chains. Adv. Appl. Probab. 27, 146–160. doi:10.2307/1428101
- Agnoletti, M., Errico, A., Santoro, A., Dani, A. and Preti, F. 2019. Terraced landscapes and hydrogeological risk. Effects of land abandonment in Cinque Terre (Italy) during severe rainfall events. Sustainability 11, Article ID: 235.
- Ali, Z., Almanjahie, I. M., Hussain, I., Ismail, M. and Faisal, M. 2020. A novel generalized combinative procedure for multiscalar standardized drought indices – the long average weighted joint aggregative criterion. Tellus A: Dyn. Meteorol. Oceanograph. 72, 1–23. doi:10.1080/16000870.2020.1736248
- Ali, Z., Hussain, I., Faisal, M., Almanjahie, I. M., Ahmad, I. and co-authors. 2019. A probabilistic weighted joint aggregative drought index (PWJADI) criterion for drought monitoring systems. Tellus A: Dyn. Meteorol. Oceanograph. 71, Article ID: 1588584.
- Ali, Z., Hussain, I., Faisal, M., Nazir, H. M., Abd-el Moemen, M. and co-authors. 2017. A novel multiscalar drought index for monitoring drought: the standardized precipitation temperature index. Water Resour. Manage. 31, 4957–4969. doi:10.1007/s11269-017-1788-1
- Ali, Z., Hussain, I., Faisal, M., Shoukry, A. M., Gani, S. and co-authors. 2019. A framework to identify homogeneous drought characterization regions. Theor. Appl. Climatol. 137, 3161–3172. doi:10.1007/s00704-019-02797-w
- Awan, S. A. 2002. The climate and flood risk potential of northern areas of Pakistan. Scie. Vis. 7, 100–109.
- Bezdan, J., Bezdan, A., Blagojević, B., Mesaroš, M., Pejić, B. and co-authors. 2019. SPEI-based approach to agricultural drought monitoring in Vojvodina region. Water 11, Article ID: 1481.
- Chattopadhyay, G., Chakraborthy, P. and Chattopadhyay, S. 2012. Mann–Kendall trend analysis of tropospheric ozone and its modeling using ARIMA. Theor. Appl. Climatol. 110, 321–328. doi:10.1007/s00704-012-0617-y
- Conway, D., Dalin, C., Landman, W. A. and Osborn, T. J. 2017. Hydropower plans in eastern and southern Africa increase risk of concurrent climate-related electricity supply disruption. Nat. Energy 2, 946–953. doi:10.1038/s41560-017-0037-4
- Erhardt, T. M. and Czado, C. 2018. Standardized drought indices: a novel univariate and multivariate approach. J. Roy. Stat. Soc.: C (Appl. Stat.) 67, 643–664. doi:10.1111/rssc.12242
- Farahmand, A. and AghaKouchak, A. 2015. A generalized framework for deriving nonparametric standardized drought indicators. Adv. Water Resour. 76, 140–145. doi:10.1016/j.advwatres.2014.11.012
- Fowler, H. J. and Kilsby, C. G. 2002. A weather-type approach to analysing water resource drought in the Yorkshire region from 1881 to 1998. J. Hydrol. 262, 177–192. doi:10.1016/S0022-1694(02)00034-3
- Gerber, N., & Mirzabaev, A. 2017. Benefits of action and costs of inaction: drought mitigation and preparedness–a literature review. World Meteorological Organization; Global Water Partnership, Working Paper Integrated Drought Management Programme Working Paper (1).
- Gidey, E., Dikinya, O., Sebego, R., Segosebe, E. and Zenebe, A. 2018. Analysis of the long-term agricultural drought onset, cessation, duration, frequency, severity and spatial extent using vegetation health index (VHI) in Raya and its environs, northern Ethiopia. Environ. Syst. Res. 7, Article ID: 13.
- Güneralp, B., Güneralp, İ. and Liu, Y. 2015. Changing global patterns of urban exposure to flood and drought hazards. Global Environ. Change 31, 217–225. doi:10.1016/j.gloenvcha.2015.01.002
- Guttman, N. B. 1998. Comparing the palmer drought index and the standardized precipitation index 1. J. Am. Water Resources Assoc. 34, 113–121. doi:10.1111/j.1752-1688.1998.tb05964.x
- Häggström, O. 2002. Finite Markov Chains and Algorithmic Applications. Vol. 52, Cambridge University Press, Cambridge.
- Hagman, G., Beer, H., Bendz, M. and Wijkman, A. 1984. Prevention better than cure. Report on human and environmental disasters in the Third World. 2.
- Jamro, S., Dars, G. H., Ansari, K. and Krakauer, N. Y. 2019. Spatio-temporal variability of drought in Pakistan using standardized precipitation evapotranspiration index. Appl. Sci. 9, Article ID: 4588.
- Jilani, R., Haq, M. and Naseer, A. 2007, November. A study of Glaciers in Northern Pakistan. In: The first joint PI symposium of ALOS data nodes for ALOS science program in Kyoto Secretariat, Japan Aerospace Exploration Agency (JAEA), Kyoto International Conference Centre, Main Hall, pp. 19–23.
- Keizer, J. 1987. Nonequilibrium steady states. In: Statistical Thermodynamics of Nonequilibrium Processes. Springer, New York, NY, pp. 307–352.
- Klein, J. P., Klotz, J. H. and Grever, M. R. 1984. A biological marker model for predicting disease transitions. Biometrics 40, 927–936. doi:10.2307/2531144
- Livada, I. and Assimakopoulos, V. D. 2007. Spatial and temporal analysis of drought in Greece using the Standardized Precipitation Index (SPI). Theor. Appl. Climatol. 89, 143–153. doi:10.1007/s00704-005-0227-z
- Li, X., He, B., Quan, X., Liao, Z. and Bai, X. 2015. Use of the standardized precipitation evapotranspiration index (SPEI) to characterize the drying trend in southwest China from 1982–2012. Remote Sens. 7, 10917–10937. doi:10.3390/rs70810917
- Malik, W., Shahid, H., Zafar, R., Uddin, Z., Wazir, Z. and co-authors. 2012. Role of Pakistan in global climate change through greenhouse gas emissions (GHGs). Res. J. Environ. Earth Sci. 4, 996–1001.
- Mallya, G., Tripathi, S. and Govindaraju, R. S. 2015. Probabilistic drought classification using gamma mixture models. J. Hydrol. 526, 116–126. doi:10.1016/j.jhydrol.2014.11.008
- McCarthy, J. J., Canziani, O. F., Leary, N. A. and Dokken, D. J. and White, K. S. (eds.).2001. Climate Change 2001: Impacts, Adaptation, and Vulnerability: Contribution of Working Group II to the Third Assessment Report of the Intergovernmental Panel on Climate Change. Vol. 2. Cambridge University Press, Cambridge.
- McKee, T. B., Doesken, N. J. and Kleist, J. 1993, January. The relationship of drought frequency and duration to time scales. In: Proceedings of the 8th Conference on Applied Climatology. Vol. 17, No. 22.American Meteorological Society, Boston, MA, pp. 179–183.
- Naresh Kumar, M., Murthy, C. S., Sesha Sai, M. V. R. and Roy, P. S. 2009. On the use of Standardized Precipitation Index (SPI) for drought intensity assessment. Met. Apps. 16, 381–389. doi:10.1002/met.136
- Nielsen, D. R., Kutílek, M. and Parlange, M. B. 1996. Surface soil water content regimes: opportunities in soil science. J. Hydrol. 184, 35–55. doi:10.1016/0022-1694(95)02967-2
- Nkemdirim, L. and Weber, L. 1999. Comparison between the droughts of the 1930s and the 1980s in the southern prairies of Canada. J. Climate 12, 2434–2450. doi:10.1175/1520-0442(1999)012<2434:CBTDOT>2.0.CO;2
- Oladipo, E. O. 1995. Some statistical characteristics of drought area variations in the Savanna region of Nigeria. Theor. Appl. Climatol. 50, 147–155. doi:10.1007/BF00866113
- Parsons, D. J., Rey, D., Tanguy, M. and Holman, I. P. 2019. Regional variations in the link between drought indices and reported agricultural impacts of drought. Agric. Syst. 173, 119–129. doi:10.1016/j.agsy.2019.02.015
- Rozas, V., Camarero, J. J., Sangüesa-Barreda, G., Souto, M. and García-González, I. 2015. Summer drought and ENSO-related cloudiness distinctly drive Fagus sylvatica growth near the species rear-edge in northern Spain. Agric. For. Meteorol. 201, 153–164. doi:10.1016/j.agrformet.2014.11.012
- Santos, J. F., Portela, M. M. and Pulido-Calvo, I. 2011. Regional frequency analysis of droughts in Portugal. Water Resour. Manage. 25, 3537–3558. doi:10.1007/s11269-011-9869-z
- Spedicato, G. A., Kang, T. S., Yalamanchi, S. B., Yadav, D. and Cordón, I. 2016. The markovchain package: a package for easily handling Discrete Markov Chains in R. Accessed Dec.
- Spiess, A. N. ( 2014. ). Propagate: propagation of uncertainty. R package version 1.0-4.
- Srikanthan, R. and McMahon, T. A. 2001. Stochastic generation of annual, monthly and daily climate data: a review. Hydrol. Earth Syst. Sci. 5, 653–670. doi:10.5194/hess-5-653-2001
- Stagge, J. H., Tallaksen, L. M., Gudmundsson, L., Van Loon, A. F. and Stahl, K. 2015. Candidate distributions for climatological drought indices (SPI and SPEI). Int. J. Climatol. 35, 4027–4040. doi:10.1002/joc.4267
- Stewart, W. J. 2009. Probability, Markov Chains, Queues, and Simulation: The Mathematical Basis of Performance Modeling. Princeton University Press, Princeton, NJ.
- Svoboda, M. and Fuchs, B. and Integrated Drought Management Programme (IDMP) 2016. Handbook of drought indicators and indices. Drought Mitigation Center Faculty Publications. 117. http://digitalcommons.unl.edu/droughtfacpub/117
- Thom, H. C. S. 1966. Some methods of climatological analysis (No. 551.5 T4).
- Tsakiris, G., Pangalou, D. and Vangelis, H. 2007. Regional drought assessment based on the Reconnaissance Drought Index (RDI). Water Resour. Manage. 21, 821–833. doi:10.1007/s11269-006-9105-4
- Umran Komuscu, A. 1999. Using the SPI to analyze spatial and temporal patterns of drought in Turkey. Drought Network News (1994–2001), 49.
- Vicente-Serrano, S. M., Beguería, S. and López-Moreno, J. I. 2010a. A multiscalar drought index sensitive to global warming: the standardized precipitation evapotranspiration index. J. Climate 23, 1696–1718. doi:10.1175/2009JCLI2909.1
- Vicente-Serrano, S. M., Beguería, S., López-Moreno, J. I., Angulo, M. and El Kenawy, A. 2010b. A new global 0.5 gridded dataset (1901–2006) of a multiscalar drought index: comparison with current drought index datasets based on the Palmer Drought Severity Index. J. Hydrometeorol. 11, 1033–1043. doi:10.1175/2010JHM1224.1
- Wang, P., Qiao, W., Wang, Y., Cao, S. and Zhang, Y. 2020. Urban drought vulnerability assessment – a framework to integrate socio-economic, physical, and policy index in a vulnerability contribution analysis. Sustain. Cities Soc. 54, 102004. doi:10.1016/j.scs.2019.102004