
Abstract
This study investigates the impact of fatty acids on the cloud condensation nuclei (CCN) activity of sea salt aerosol of initial size 30, 50, 70 or 90 nm. Two of the major fatty acids in the marine environment, palmitic acid (C16) and stearic acid (C18), were investigated along with their unsaturated analogues palmitoleic acid and oleic acid, respectively. Sea salt seed particles were generated by aeration through a diffuser placed inside a sea spray tank. Fatty acids were added to the particles via condensation of fatty acid vapours in a heated flask at different temperatures. The diameters and CCN activity of particles before and after condensation of fatty acids were monitored. Based on the change in mobility diameter, a coating thickness and an organic volume fraction were inferred. Addition of the unsaturated acids to the core sea salt particles did not result in hindered water uptake for any organic volume fractions studied (25–96%) and critical supersaturations generally followed the kappa addition rule assuming a kappa value of zero for the fatty acids and assuming a constant surface tension equal to that of water. For the saturated fatty acids, a deviation from the Zdanovskii, Stokes and Robinson assumption (kappa mixing rule) in the direction of hindered water uptake was observed for organic volume fractions corresponding to thick (25–29 nm) coatings of palmitic acid and even thinner coatings of stearic acid.
1. Introduction
Sea spray aerosol (SSA) formed by breaking waves accounts for the largest fraction of the total atmospheric mass emission of natural aerosols (Andreae and Rosenfeld, Citation2008; de Leeuw et al., Citation2011). Once emitted, SSA contributes significantly to cloud condensation nuclei (CCN) concentrations in the marine atmosphere. It has been shown that submicron sea salt particles may contribute as much as 90% of CCN in remote marine regions (Clarke et al., Citation2006). SSA does not only contain inorganic sea salts, but can also contains large fractions of organic matter (Middlebrook et al., Citation1998; Cavalli et al., Citation2004; O’Dowd et al., Citation2004; Aller et al., Citation2005; Leck and Bigg, Citation2005; Facchini et al., Citation2008; Hawkins and Russell, Citation2010; Russell et al., Citation2010; Orellana et al., Citation2011; Gantt and Meskhidze, Citation2013; Quinn et al., Citation2014, Citation2015). Organic enrichment in SSA relative to bulk sea water has been reported in the sub-micron size range (Keene et al., Citation2007; Quinn et al., Citation2014, Citation2015) important for CCN activation.
Organic components can be scavenged onto sea salt particles through the process of bubble rising and bursting at the ocean surface (Blanchard, Citation1975; Hoffman and Duce, Citation1976; Tseng et al., Citation1992; Skop et al., Citation1994). Here, the sea surface microlayer (SML), which is the ultra-thin boundary layer between ocean and the atmosphere, can play a critical role (O’Dowd and De Leeuw, Citation2007; Wurl et al., Citation2011; Quinn et al., Citation2015). The SML contains an elevated concentration of water-soluble organic matter as well as water-insoluble organic matter. Examples are fatty acids, proteins and carbohydrates, which are products of micro-organism membrane components, released to sea water via cell exudation and break-up and accumulated at the sea water surface (Ellison et al., Citation1999; Russell et al., Citation2010), microgels (Orellana et al., Citation2011) or bacteria and viruses (Aller et al., Citation2005).
Various field measurements have reported fatty acids as a common organic component found in marine SSA (Gagosian et al., Citation1981; Mochida et al., Citation2002; Peterson and Tyler, Citation2002; Tervahattu et al., Citation2002a, Citation2002b; Mochida et al., Citation2003, Citation2007; Peterson and Tyler, Citation2003; Ault et al., Citation2013), specifically on the surface of particles (Peterson and Tyler, Citation2002; Tervahattu et al., Citation2002a; Donaldson and Vaida, Citation2006). The extent of fatty acids covering sea salt particle surface was estimated to be in the range of 0.3–14% if averaged over all sizes (Mochida et al., Citation2002). Fatty acids have also been found enriched in SML compared to bulk sea water (Marty et al., Citation1979; Osterroht, Citation1993; Quinn et al., Citation2015). The fatty acids in SML have a high even to odd number of the fatty acids, often with the dominance of C16 followed by C18 for both saturated and unsaturated acids (Hunter and Liss, Citation1981; Osterroht, Citation1993). Similar to fatty acids in the SML, Mochida et al. (Citation2002) noted considerably higher fractions of C14, C16 and C18 acids in marine aerosols compared to other fatty acids, with a good correlation between the fatty acid concentrations and sea salt particle concentrations, indicating a marine origin for both species, which were in line with earlier observations by Peltzer et al. (Citation1984).
The ability of atmospheric particles to act as nuclei for cloud droplet formation is controlled by particle size and chemical composition (Farmer et al., Citation2015). While salt often dominates the CCN activity in internally mixed particles (Bilde and Svenningsson, Citation2004), it has been discussed that the presence of particle coatings, e.g. Cruz and Pandis (Citation1998), Xiong et al. (Citation1998), Abbatt et al. (Citation2005), Garland et al. (Citation2005), Minãmbres et al. (Citation2014), may significantly influence the hygroscopic growth and CCN activity of aerosol particles.
The C16 and C18 fatty acids are characterised by very low water solubility, e.g. 0.0072 g palmitic acid per kg water (Haynes, Citation2016). They are therefore classified as CCN inactive (Petters et al., Citation2016); even if present in very large volume fractions, they are not predicted to contribute to water uptake (assuming a surface tension of water). At the same time, these molecules are however strongly surface active and it is suggested that in salty aerosol they form surface films potentially changing water uptake (Ruehl and Wilson, Citation2014) and CCN activity (Schwier et al., Citation2012). Since fatty acids dominate sub-micron particles, Collins et al. (Citation2016) point out that discrepancies between the organic fraction of SSA as derived from CCN measurements compared to that derived from chemical analysis of SSA could be due to surface tension effects.
Despite the abundance of fatty acids in marine aerosol, no systematic laboratory study on the effect of fatty acid coatings on core sea salt aerosol has however been carried out. The current experimental study was conducted to elucidate the role of the most important fatty acids (C16 and C18) on CCN activity of SSA.
A particular challenge in this regard is to obtain a controlled volume fraction (and coating thickness) of organic material for organics of low water solubility. To overcome this challenge, the study follows a previously used procedure (Cruz and Pandis, Citation1998; Xiong et al., Citation1998; Garland et al., Citation2005; Ruehl and Wilson, Citation2014), namely coating of dried size selected core salt particles by condensation of organics from the gas phase.
Specifically, sea salt particles were coated with saturated and unsaturated fatty acids identified in the SML as well as in SSA: palmitic acid C16:0, palmitoleic acid C16:1, stearic acid C18:0 and oleic acid C18:1. In the notation Cj,i, j refers to the number of carbon atoms in the fatty acid and i denotes the number of double bonds, i.e. saturated (i = 0) or unsaturated with a single double bond (i = 1).
2. Experimental
2.1. Chemicals
Seed sea salt particles were generated from solution of artificial Sigma sea salt (Sigma–Aldrich, S9883; 55% Cl, 31% Na, 8% , 4% Mg, 1% K, 1% Ca, <1% other). The fatty acids used for coating were saturated palmitic acid (C16H32O2, purity > 99%, Sigma–Aldrich, CAS 57-10-3), unsaturated palmitoleic acid (C16H30O2, purity ≥ 98.5%, Sigma–Aldrich, CAS 373-49-9), saturated stearic acid (C18H36O2, purity ≥ 99.5%, Sigma–Aldrich, CAS 57-11-4) and unsaturated oleic acid (C18H34O2, purity > 99%, Sigma–Aldrich, CAS 112-80-1). Detailed descriptions of coating materials are provided in Table .
Table 1. Coating materials and conditions.
The CCN counter was calibrated using ammonium sulphate ((NH4)2SO4, purity > 99.9999%, Fluka Analytical, 101279573). Milli-Q water was purified using a Milli-Q water integral system (EMD Millipore) and used in all experiments. Air entering the sea spray tank was purified using a filtered air supply (TSI, 3074B, Minnesota). Dilution air was dried and cleaned by passing it through an active charcoal scrubber, silica dryers and a HEPA filter.
2.2. Particle generation
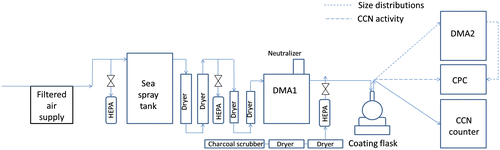
The experimental set-up is shown in Fig. and detailed as follows. Particles were generated by either atomisation (for calibration of CCN counter) or from bubble bursting. For atomisation, a constant output atomizer (TSI 3076) was used. A home-built stainless steel tank (King et al., Citation2012) was used for laboratory generation of SSA. The tank was filled with artificial sea water, prepared by dissolving 350 g Sigma sea salt in 10 L of milli-Q water, yielding a salinity of 35‰. Bubbles were produced via aeration of pressurised air (2 psi, air flow rate of 6.5 L min−1) through a stainless steel diffuser placed at the bottom of the tank, approximately 27 cm from the water surface. As bubbles rose and burst at the surface, aerosols containing Sigma sea salt were collected from the head space (approximately 5 L) and subsequently dried using a set of diffusion dryers, which included two diffusion dryers from TSI (306200) and two additional home-built diffusion dryers filled with dried granulated silica (Silica gel orange, Sigma–Aldrich).
Fig. 1. The experimental set-up employed in this study. The arrow shows the flow direction. For CCN activity measurements, the flow from the coating bottle was split between the CPC and CCN counter. For size distribution measurements, the flow was split between the CCN counter and the SMPS system (DMA2 + CPC).
2.3. Coating set-up
Dried particles (relative humidity (RH) < 10%) were led through a soft X-ray aerosol neutralizer (TSI 3087, Shoreview, Minesota, US) at a flow rate of 1 L min−1 into a Differential Mobility Analyser (DMA 3081 TSI, Shoreview, MN, US) (sheath air: aerosol air 10:1), where a specific narrow size fraction was selected. Four initial particle diameters were used: 30, 50, 70 and 90 nm, respectively. The monodisperse aerosol flow was then led to a coating system, which consists of a round bottom flask (VWR, VWRI 201-1358, 500 mL) partly immersed in an oil (PEG 400) bath. The bath was placed on a hot plate (IKA, RCT basic) with temperature control (IKA, IKATRON ETS-D4-fuzzy, operating temperature range –10 to +400 °C, accuracy ±0.1 K in temperature range – 10 to +100 °C). A magnetic stirrer was placed inside the oil bath to facilitate distribution of heat. The particle size after coating was measured as detailed in Section 2.4.
Coating temperatures were selected based on a number of initial tests. In case of palmitic and palmitoleic acids, a thin (4–7 nm), medium (12–17 nm) and thick coating (25–29 nm) were obtained. These correspond to 28–63%, 50–86% and 74–96% organic volume fractions, respectively. In case of stearic acid and oleic acid, only a thin coating was achieved with the low and medium temperature settings and a medium coating was achieved with the highest temperature setting. In the reference experiment, Sigma sea salt particles were led through a clean empty round bottom flask. RH was kept below 10% in all experiments.
2.4. Measurements of CCN activity and particle size distributions
After coating, one of the two measurement modes (particle size distribution or CCN) was applied.
For CCN measurements, the flow of particles was split between a CCN counter (Droplet Measurement Technologies, 0.5 L min−1) and a condensation particle counter (CPC, TSI 3010, 1 L min−1) to simultaneously measure CCN and total particle number concentrations, respectively. The CCN counter was set to scan stepwise over a range of supersaturations, with a time interval of 5 min at each supersaturation. A minimum of 9 up to 15 supersaturations were used in any scan.
The supersaturation of the CCN counter was calibrated using atomised ammonium sulphate according to Rose et al. (Citation2008). Theoretical supersaturations were calculated from the dry particle diameter, with the water activity calculated using the E-AIM (Extended – Aerosol Inorganics Model, http://www.aim.env.uea.ac.uk/aim/aim.php).
For particle size distribution measurements, the flow of particles was split between the CCN counter (0.5 L min−1) and a Scanning Mobility Particle Sizer (SMPS) system (1 L min−1), which consisted of a second DMA without a charger/neutraliser (sheath to aerosol flow ratio of 10:1) and the CPC (TSI 3010). The inclusion of the CCN counter in the experimental set-up for measurements of particle size distribution was to ensure that the flow set-up was kept identical to the previous CCN measurements.
Both the CPC and CCN counter yielded a measurement point every second. Average measurements of every 60 data points (one minute) were used to construct the CCN curves, which are presented as the ratio of CCN to CPC concentrations as a function of supersaturation. Each CCN scan through a range of supersaturations at a fixed dry particle diameter yields a CCN curve. A sigmoidal fit was applied to each CCN curve using the Igor Pro 6.36 software and an activation supersaturation (or critical supersaturation SSc) was determined as the 50% activation point.
2.5. Cryogenic transmission electron microscopy (Cryo-TEM)
Particles were collected using a home-built micro-inertial impactor set-up (Kandler et al., Citation2007) specifically designed for collection of submicron particles for microscopy sampling: a jet with the critical diameter of 0.25 mm was mounted before a jet with a diameter of 0.6 mm, followed by a TEM grid mounted to a holder with openings for the air stream to pass at the sides. This set-up of jets is different from the one used in Kandler et al. (Citation2007), but was chosen here because it reduces the speed of the air stream and particles from 343 to 57 m/s from the first to the second jet, which should also lead to a gentler impaction of the particles on the substrate. The substrate used was a finder type Ni-TEM grid with holey carbon (S147N9, Plano, Wetzlar, Germany).
Both uncoated sea salt particle samples and particles coated with the thickest coating of palmitic acid (80 °C) were collected for Cryo-TEM analysis. Ninety nanometre particles were size selected by the first DMA and led through the same experimental set-up (Fig. ). The only difference was that the impactor was mounted at the same position as the CCN counter in the original set-up, as both instruments produce a flow of 0.5 Lpm and can thus substitute each other without disturbing the overall flow in the system. Each TEM sample was collected for 210 s, corresponding to the scanning duration of the parallel SMPS system.
Directly after sampling, the impactor was placed into a closed box with silica gel and transported to a fume hood. Here, the TEM grids were removed from the Micro Inertial Impactor container under gentle flow of gaseous nitrogen to avoid condensation of water vapour on the particles, flash frozen in liquid nitrogen and loaded into the microscope using an autoloader. The samples were examined using a FEI Titan Krios operating at 300 kV under cryogenic conditions.
The uncoated particle samples were collected and stored in a closed container with silica gel and examined the day after sampling, whereas the coated particle samples were frozen and transferred to the FEI Titan Krios immediately.
3. Theory
3.1. Organic volume fraction and coating thickness
The organic volume fraction was calculated from the measured (SMPS) diameters of uncoated (Dp,initial) and coated (Dp,final) particles, assuming spherical particles and that all volume increase was due to the deposited fatty acids only as follows:(1)
Assuming a uniform and full coating of the particles, the coating thickness was calculated as:(2)
where Dp,initial and Dp,final are the particle diameters measured by the SMPS system before and after coating, respectively.
3.2. Köhler theory
The water vapour saturation ratio (S) over an aqueous solution droplet is described by the so-called Köhler equation (Köhler, Citation1936).
(3)
where σsol is the air–liquid surface tension, Mw is the molecular weight of water, ρw is the density of water, R is the ideal gas constant, T is the temperature, Dp is the droplet diameter and aw is the water activity of the droplet solution.
Petters and Kreidenweis (Citation2007) suggested to parameterise the water activity term as follows.
(4)
where Vs is the volume of the dry particle, Vw is the volume of water in the droplet and κ is the so-called hygroscopicity parameter.
Combining this with Köhler theory, the κ-Köhler equation can be obtained (Petters and Kreidenweis, Citation2007).
(5)
where Dp,dry is the dry particle diameter. The air–liquid surface tension σsol is assumed to equal the surface tension of the water–air interface and surfactant partitioning between bulk and surface is neglected.
κ values used to construct κ lines in plots of critical supersaturation versus dry particle diameter were obtained from Markus Petters, Department of Atmospheric Science, Colorado State University, Fort Collins, CO (URL: http://www4.ncsu.edu/~mdpetter/code.html, Access date: January 2016).
The overall value for κ of a mixture can be calculated assuming a simple mixing rule based on the Zdanovskii, Stokes and Robinson (ZSR) assumption (Petters and Kreidenweis, Citation2007):(6)
where εi is the dry volume fraction of component i in the particle and κi is the kappa value of the pure component i.
The effects of surface tension lowering on cloud droplet formation represent a significant challenge for models and as recently pointed out by Petters and Petters (Citation2016) solubility limitations and salting out effects in relation to surfactants present special challenges. This could be particularly relevant in the case of SSA containing salt and fatty acids. Studies comparing results from thermodynamic models accounting for partitioning of surfactants between the bulk and surface of droplets with simple models neglecting surface tension effects (Sorjamaa et al., Citation2004; Prisle et al., Citation2010; Lowe et al., Citation2016) show that surface tension lowering from water soluble surfactants can in general be ignored when predicting CCN activity. Recent studies however point to special and unresolved effects due to surface film formation in aqueous solution droplets (Ruehl and Wilson, Citation2014; Petters and Petters, Citation2016).
4. Results and discussion
4.1. Fatty acid coating
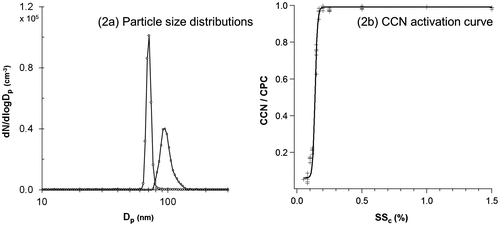
Figure (a) shows the size distributions of 70 nm dry sea salt particles before (left) and after (right) coating with palmitoleic acid (medium coating thickness, 80 °C) as measured by the SMPS system. Figure (b) shows the corresponding CCN activation curve for the coated particles. As can be seen from the figure, the size distribution of coated particles shows a shoulder towards larger diameter. This was generally observed for medium and thick coatings. Potential explanations for these shoulders could be multiple charged particles and uneven amounts of time spent in the coating bottle. It was also observed that particle number concentrations decreased with increasing coating temperature, which could be due to particle loss to the walls. As all CCN curves showed a clear activation curve (Fig. (b)), only the median number particle size of the main peak (obtained using AIM software, TSI) was further used as the final diameter of coated particles (Dp, final).
Fig. 2. Measured size distribution (a) of Sigma sea salt (initial diameter of 70 nm) particles before and after coating with palmitoleic acid (medium coating thickness, 80 °C) and (b) the corresponding CCN activation curve.
Assuming that particles are uniformly coated, an average coating thickness was calculated (Equation (Equation2(2) )) for every coating material at each coating temperature (Table ).
Table 2. Characterisation of fatty acid coating.
The time of diffusion of a water molecule through a layer of fatty acid coating is estimated as t = x2/2D where x is the thickness of the coating and D is the diffusivity of water in the fatty acid medium obtained using the Stokes–Einstein equation:(7)
where D is the diffusion coefficient of water in fatty acid, kB is the Boltzmann constant, T is temperature, ŋ is the dynamic viscosity of the fatty acid medium and is the radius of a water molecule (Atkins and De Paula, Citation2014). The diameter of the water molecule is of the order of ~0.3 nm (Schatzberg, Citation1967).
Accordingly, it is estimated that a water molecule would take microseconds to diffuse through a nm coating layer of oleic acid at 23.9 °C using a dynamic viscosity of 0.029 Pa s (Noureddini et al., Citation1992). Meanwhile, palmitic acid and stearic acid are not in the liquid form at room temperature. According to a study by Renbaum-Wolff et al. (Citation2013) on the dynamic viscosities of common semi-solid and amorphous solid substances, the viscosity varies over a broad range from 102 to 1012 Pa s for semi-solids to >1012 Pa s for amorphous solid substances. A mid-range semi-solid viscosity of 107 would thus result in a diffusion time of ~3–4 s per nm coating layer, whereas an amorphous solid coating would result in a diffusion time of >105 s. The timescale in the CCN counter is of the order of seconds (Rose et al., Citation2008) and these ‘back of the envelope’ calculations thus suggest that even a thin coating by the saturated acids if present as amorphous solids can hinder water uptake while coatings by the unsaturated acids will not hinder water uptake.
The number of monolayers for each coating experiment was estimated in a simple way assuming the fatty acids arranged on the surface of the particles as a pack of cylinders. The length of the cylinder was taken as the length of the carbon chain similar to Garland et al. (Citation2005). The corresponding carbon chain length was calculated using the software ChemBio 3D Ultra 14.0. The results are summarised in Table . The number of monolayers calculated in this way likely represents a minimum estimate since the molecules may bend and curl in the coating layer. In all cases, the thickness of the coating corresponds to more than a mono-layer assuming that the fatty acids are evenly distributed on the sea salt particle surface.
Table 3. Overview of experimental data. Calculated κ was obtained for each sea salt–fatty acid mixture based on κ addition rule, using calculated κSigma sea salt = 0.93 and assuming κfatty acid as zero. An uncertainty of ±0.01 was estimated for SSc based on propagation of uncertainty using the ammonium sulphate calibration curve (Harris, Citation2007).
To challenge the assumption of a uniform coating, the morphology of the uncoated and coated particles was explored using CRYO-TEM which has recently been shown to be a very promising technique for investigation of nascent sea spray particles (Patterson et al., Citation2016).
Particles on the pure sea salt sample showed no indication of coating, but showed a clear pattern in electron diffraction, which can be linked to sea salt (NaCl). In opposite, the particles which passed a bottle with palmitic acid heated to 80 °C show some indication of coating. The primary particles have the same diffraction patterns as the pure sea salt sample; in addition, there is an amorphous phase which is partly or fully coating them (e.g. Fig. ) or attached to them in smaller, round shaped form (not shown). Under flash freezing, amorphous ice particles can be formed and were also found on the samples. Large hexagonal ice crystals were observed on the samples as well. It must be noticed that the SMPS selects electrical mobility diameter, while the micro-inertial impactor sampling is based on aerodynamic diameter and the TEM provides an area projected diameter. Predicting the exact relations requires knowledge on specific densities and a full characterisation of the sampling efficiency of the impactor in the set-up which was outside the scope of the current work but is also recommended for future studies.
Fig. 3. TEM bright field images of (a) particle from the uncoated Sigma sea salt sample and (b) particles from coated Sigma sea salt sample (palmitic acid, 80 °C).
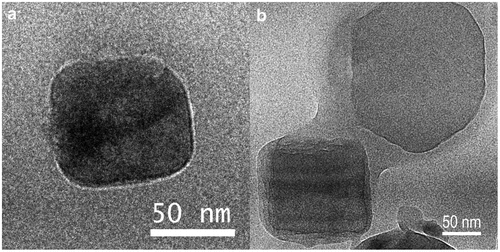
Garland et al. (Citation2005) found that pure palmitic acid was stable when investigated by environmental TEM, a technique applying higher water vapour pressure around the sample, compared to normal TEM. However, coated ammonium sulphate particles in their images show beam damage on the coated surface. A similar pattern on the coated particles was found in this study at higher spot sizes, or when the beam remained on the particle for longer time (minutes).
The CRYO-TEM studies herein represent a first approach, giving some indication for the presence of the organic phase on sea salt particles after coating, but a final proof of complete coating by for example tomography of a completely coated particle is lacking. It cannot be excluded that damage was induced to the coating by impaction on the substrate. In the following, the discussions are framed around organic volume fraction as well as the corresponding coating thickness, bearing in mind that based on the microscopy studies, the presence of a complete coating has not been proved.
4.2. CCN activity
Figure shows results from the CCN experiments using the saturated fatty acids (palmitic and stearic acid) as coating material, while Fig. shows the corresponding results from those using the unsaturated fatty acids (palmitoleic and oleic acids). The figures show the measured critical supersaturation (SSc) versus the diameter of the coated particles Dp,final. The size of the symbols reflects the diameter of the uncoated particles. Accordingly, the smallest marker size corresponds to a Dp,initial of 30 nm and the largest marker size corresponds to a Dp,initial of 90 nm. The colour of the symbols represents the organic volume fraction. The uncoated Sigma sea salt particles are shown in all graphs for reference. As expected from the Köhler theory, the critical supersaturation decreases with increasing particle size for uncoated Sigma sea salt particles.
Fig. 4. Demonstration of the coating effect on the CCN activity of the saturated fatty acids: (a) palmitic acid C16:0 and (b) stearic acid C18:0. The size of the marker represents the initial size of uncoated particles, with the smallest size (top left) representing 30 nm and the largest size (bottom) representing 90 nm. The colour bar represents the organic volume fraction. The horizontal lines from Dp,initial of 30, 50, 70 and 90 nm serve to guide the eyes as SSc (%) of uncoated Sigma sea salt. The coloured lines connect particles with similar coating thickness.
Fig. 5. Demonstration of the coating effect on the CCN activity of the unsaturated fatty acids: (a) palmitoleic acid C16:1 and (b) oleic acid C18:1. The size of the marker represents the initial size of uncoated particles, with the smallest size (top left) representing 30 nm and the largest size (bottom) representing 90 nm. The colour bar represents the organic volume fraction. The horizontal lines from Dp,initial of 30, 50, 70 and 90 nm serve to guide the eyes as SSc (%) of uncoated Sigma sea salt. The coloured lines connect particles with similar coating thickness.
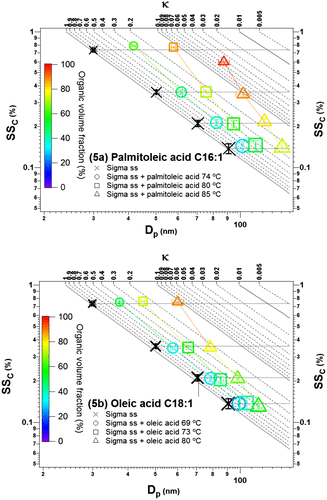
Table provides an overview of the experimental data obtained.
4.2.1. Saturated fatty acid coating
The saturated fatty acids, palmitic and stearic acids, are solid at room temperature and differ chemically by one CH2 unit.
The effects of palmitic acid on the CCN activity of sea salt particles were observed as follows. Reading from left to right in Fig. (a) for each Dp,initial, the organic volume fraction/coating thickness increases. For coating thicknesses up to ~15 nm (at low temperature, 64 °C and medium temperature, 70 °C), the critical supersaturation is determined by the salt core and unchanged by the presence of the coating. This could be due to uneven and incomplete coating providing the water vapour direct access to the soluble salt or diffusion of the water through the relatively thin coating.
The presence of the thickest coating of ~28 nm (at high temperature setting, 80 °C) led to considerably higher SSc than that for the salt core in all cases: for Dp,initial of 30, 70 and 90 nm, the increase of SSc relative to the salt core was 29–33% SSc, while for Dp,initial of 50 nm, the increase was 82%. As activation was observed in all cases, it indicates that an organic volume fraction corresponding to a coating of ~28 nm limits water uptake to some extent but does not hinder it completely. Even though uniform and full coating could not be proven based on the CRYO-TEM studies, the fact that the deviation from the critical supersaturation of the salt core happens at different organic volume fractions indicates that the hindered water uptake is determined more by the coating thickness corresponding to a given organic volume fraction than the organic volume fraction alone.
At the same time, it is seen that for a given coating thickness (thin or medium), the critical supersaturation decreases as the core size increases and organic volume fraction decreases and that particles with similar organic volume fractions broadly lie on the same kappa lines.
Garland et al. (Citation2005) studied water uptake at sub-saturated conditions of ammonium sulphate particles coated with palmitic acid and found that coatings (mass fraction ~20%, coating thickness ~21 nm) did not affect deliquescence relative humidity. For very thick coatings (mass fraction ~50%, coating thickness of ~89 nm), a change in water uptake was observed for the coated particles, with no clear deliquescence point compared to the case of the inorganic core. Ruehl and Wilson (Citation2014) observed that coatings of palmitic acid on large (200 nm) ammonium sulphate particles result in delayed water uptake at relative humidity of 99.9%.
With respect to the other saturated acid (stearic acid C18:0, Fig. (b)), the CCN activity of sea salt particles coated with this compound was in most cases associated with a slightly higher critical supersaturation than the salt core, with SSc increased from 1 to 14% for thin coatings (69 °C, ~7 nm coating thickness) and 5–21% for medium coating (74 °C, ~15 nm coating thickness). Thus, compared to the coating experiment with palmitic acid C16:0, where no clear change in SSc was observed as discussed above for thin and medium coating thicknesses, the longer chain stearic acid C18:0 perhaps demonstrates a stronger ability to limit water uptake. It was however not possible to fully confirm this trend, as stearic acid C18:0 could not be coated as well as the other fatty acids as mentioned above and the case of thicker coating (25–29 nm) could not be achieved.
For comparison, Raymond and Pandis (Citation2002) did not observe any activation of pure stearic acid particles and Ruehl and Wilson (Citation2014) did not observe droplet formation at 99.9% for ammonium sulphate particles coating with stearic acid. Abbatt et al. (Citation2005) coated ammonium sulphate core particles with stearic acid and found that coating thicknesses larger than those in our experiments (20–40 nm) inhibited cloud droplet formation of ammonium sulphate core particles in the range of 40–50 nm (SS < 2%). This was ascribed to the inability of water vapour to diffuse through the solid coating of stearic acid within the 20 s time scale of the experiment.
4.2.2. Unsaturated fatty acid coating
The unsaturated fatty acids, palmitoleic and oleic acids, differ chemically only by one CH2 unit. They differ chemically from the saturated acids discussed above by a single double bond, and also in their physical phase state by being liquid at room temperature.
Figure shows that the coating by the unsaturated fatty acids has little or no discernible effect on the CCN activity of the salt for thin and medium coating thicknesses. For the smallest core size (Dp,initial = 30), the thickest coating of palmitoleic acid (coating thickness of 26.5 nm, organic volume fraction of 96%) lead however to a significantly smaller critical supersaturation than for the salt core. Enhancement of activation as a result of an insoluble coating of unsaturated (liquid) fatty acid was also observed by Abbatt et al. (Citation2005) for ammonium sulphate particles coated by oleic acid and ascribed to a ‘particle size effect’ (i.e. lowering of the Kelvin term due to the increase in particle size as a result of coating by insoluble material). The result from this study is at the ‘edge’ of this effect due to the relatively thinner coating used; however, the observation here is consistent with this particle size effect. It is only observed for the thickest coating of the smallest core size, where sensitivity to the Kelvin term of the Köhler equation is largest. No discernible effect was observed in case of oleic acid coating, where only a medium coating thickness (~15 nm) was obtained for the corresponding smallest core size. This is consistent with the absence of a delay in water uptake at 99.9% RH as reported by Ruehl and Wilson (Citation2014) for ammonium sulphate particles coated with oleic acid.
There could be several explanations for the observation that coatings by the unsaturated fatty acids do not seem to hinder water uptake. One explanation is incomplete coating. It could be that a liquid coating is more prone to form ‘enclaves’ resulting in an incomplete coating of the particles with direct access to the salt core. Another explanation is related to the different nature of the saturated fatty acids (solid) and the unsaturated fatty acids (liquid) coatings used in this study. The presence of a double bond in the palmitoleic acid is expected to result in a less compressed coating than for palmitic and stearic acids since the unsaturated acids require more surface area per molecule (Finlayson-Pitts and Pitts, Citation2000). Consistently, diffusion through the liquid unsaturated acid coating is expected to be faster than through the corresponding solid saturated coating (Abbatt et al., Citation2005) and as estimated above should happen on a very short timescale. The difference between unsaturated and saturated fatty acid coatings was also demonstrated in a study of the coating film effects on the water uptake of H2SO4 particles by Xiong et al. (Citation1998). The results showed a reduction in water uptake with monolayer coatings of the saturated lauric acid C12:0 and stearic acid C18:0, respectively, while monolayer coating by the unsaturated oleic acid C18:1 did not affect water uptake.
4.2.3. Kappa values and atmospheric considerations
Another way to look at the experimental data presented herein and the trends discussed above is to compare experimental and predicted kappa values.
Figure shows observed kappa values versus kappa values obtained using the kappa addition rule following equation (Equation6(6) ). Observed κ values were identified for each pair pf Dp,final and SSc using the spreadsheet provided by Markus Petters (URL: http://www4.ncsu.edu/~mdpetter/code.html, Access date: January 2016) with detailed results provided in Table . κ values in the range of 0.87–0.97 were observed for Sigma sea salt. An overall κ value of 0.93 was calculated for Sigma sea salt by fitting SSc as a function of Dp following equation (Equation5
(5) ). The microscopy images suggest that the core sea salt particles are of cubic shape. Applying a shape factor of 1.08 (Baron et al., Citation2011) to the particle diameters as measured by the SMPS system results in a kappa value of 1.04. The data shown in the figures are not shape factor corrected.
Fig. 6. Observed versus calculated kappa (κ). For each compound at a Dp,initial – coating temperature combination – calculated κ was obtained for each sea salt–fatty acid mixture based on κ addition rule, using calculated κSigma sea salt = 0.93 and assuming κfatty acid as zero. The colour bar represents the organic volume fraction. The size of the marker represents Dp, initial.
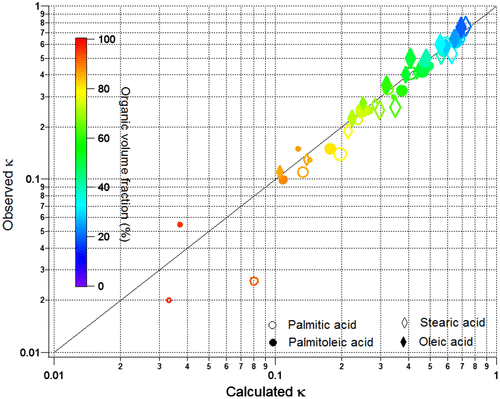
It can be seen from Table that coated particles had the lowest κ values of 0.020 (palmitic acid), 0.054 (palmitoleic acid), 0.13 (stearic acid) and 0.11 (oleic acid). These κ values were obtained using the corresponding data pairs of Dp,final and SSc for the smallest core size (30 nm) with thickest coating. This indicates that the true κ values of the fatty acids must be below these lowest observed values. In fact, oleic acid has been reported to have a κ value of only 0.003 (Rickards et al., Citation2013). For the sake of simplicity, it was assumed that the fatty acids are insoluble and thus a κ value of zero was used in the calculations using kappa addition rule.
It can be seen from Fig. and Table that for organic volume fraction below 60%, the coating in general does not affect cloud droplet activation and the kappa mixing rule applies. For the saturated palmitic acid, a slight negative deviation (smaller observed kappa value than predicted) from the kappa addition rule was observed at thick coatings. It seems likely that this is due to limited diffusion of water through a solid coating as discussed above. This tendency of negative deviation was also observed with the saturated stearic acid (Fig. ). No clear pattern of deviation from the kappa addition rule was observed for the thicker coatings of the unsaturated palmitoleic and oleic acids, except for the possible particle size effect observed with the thickest coating of palmitoleic acid as discussed in Section 4.2.1.
In the marine atmosphere, there are various factors and processes which can affect the hygroscopicity of SSA. In addition to the chemical composition, microbial content, mixing state and size of the nascent SSA condensation of natural or anthropogenic low-volatile material and chemical reactions at particle surfaces may influence hygroscopicity. Unravelling the different effects is difficult. Collins et al. (Citation2016) provides a comprehensive summary of studies on the effects of marine biology on CCN activity and find that in general kappa values derived from studies varying in complexity from a few proxy compounds to complex microcosms are in the range 0.7–1.4 more or less independent of particle size. On the other hand, Quinn et al. (Citation2014) finds kappa values as low as 0.4 from measurements in the Western Atlantic at two stations: Georges Bank and the Sargasso Sea from in situ measurements using the in situ particle generator Sea Sweep.
As discussed by both Quinn et al. (Citation2014) and Collins et al. (Citation2016), fatty acids may play an important role in determining the CCN activity of SSA. Figure shows kappa values of sea salt aerosol containing thin coatings of fatty acids (this work) as a function of final particle diameter. Also shown on the figure are the field data from Quinn et al. (Citation2014).
Fig. 7. Comparison of the results from this study for thin coatings of palmitic acid (64 °C), palmitoleic acid (74 °C), stearic acid (67 °C) and oleic acid (69 °C) with Sea Sweep SSA (Quinn et al., Citation2014). The colour bar represents the organic volume fraction. * means that the data were from Quinn et al. (Citation2014).
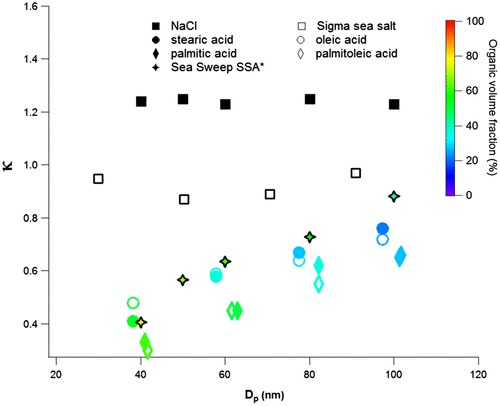
Sea salt particles coated with fatty acids show similar behaviours as that observed by Quinn et al. in the field (Quinn et al., Citation2014): an increase in kappa value with increasing size and decreasing organic volume fraction. For clarity, results for medium and thick coatings are not shown in the figure as they all fall below the kappa values for the thin coatings. The best similarity is displayed by the particles containing thin (4–7 nm) coatings corresponding to organic volume fractions in the range 28–63%. These volume fractions are somewhat lower than those reported by Quinn et al. (Citation2014). There could be several reasons for this, for example, the data of this study are obtained for a single fatty acid while the field data are prone to represent a more complex mixture of organic molecules.
5. Conclusions
This study provides insight into the effect of some of the most common fatty acids in the marine boundary layer on cloud droplet activation of SSA. In particular, it elucidates the open question about a potential large effect of surface tension lowering of fatty acids. Sigma sea salt particles were coated with four fatty acids representing model systems for common marine surfactants: palmitic acid, palmitoleic acid, stearic acid and oleic acid.
The unsaturated fatty acids (palmitoleic or oleic acid) are liquid at room temperature and CCN activation of particles consisting of sea salt and unsaturated fatty acid was modelled well using the kappa mixing rule assuming a negligible kappa value for the organic, surface tension of water and no surfactant partitioning.
For the saturated fatty acids which are solid at room temperature, some deviation from the ZSR assumption (kappa mixing rule) was observed in the direction of hindered water uptake by the presence of the fatty acid. The presence of a uniform coating could not be proven from the CRYO-TEM studies, but even so, the CCN results indicate that hindered water uptake is determined more by the coating thickness corresponding to a given organic volume fraction than the organic volume fraction alone.
Disclosure statement
No potential conflict of interest was reported by the authors.
Funding
This work was supported by the Carlsberg Foundation; Nordic Centre of Excellence on CRyosphere-Atmosphere Interactions in a changing Arctic Climate (CRAICC); and Danish Centre for Nanosafety II.
Acknowledgements
We thank Robert Lange for his help with the initial experimental set-up and good discussions on the results. We also thank Dr. Eva Emanuelsson for her help with using the Igor software. We thank Dr. Mia Frosch for her Matlab script for calculations of theoretical supersaturations. Nadia Nasser Pedersen is also acknowledged for her help in calculating carbon chain length using ChemBio 3D Ultra 14.0. We also express our gratitude to Jacques Chevallier, Department of Physics, Aarhus University for his generous help with the CRYO-TEM experiment, results and discussions. We thank Dr. Patricia Quinn, Pacific Marine Environmental Laboratory, National Oceanic and Atmospheric Administration, USA for providing organic volume fraction and kappa data from Quinn et al. (Citation2014).
References
- Abbatt, J. P. D., Broekhuizen, K. and Pradeepkumar, P. P. 2005. Cloud condensation nucleus activity of internally mixed ammonium sulfate/organic acid aerosol particles. Atmos. Environ. 39, 4767–4778.10.1016/j.atmosenv.2005.04.029
- Aller, J. Y., Kuznetsova, M. R., Jahns, C. J. and Kemp, P. F. 2005. The sea surface microlayer as a source of viral and bacterial enrichment in marine aerosols. J. Aerosol. Sci. 36, 801–812.10.1016/j.jaerosci.2004.10.012
- Andreae, M. O. and Rosenfeld, D. 2008. Aerosol-cloud-precipitation interactions. Part 1. The nature and sources of cloud-active aerosols. Earth-Sci. Rev. 89, 13–41.10.1016/j.earscirev.2008.03.001
- Atkins, P. W. and De Paula, J. 2014. Atkins’ Physical Chemistry. Oxford University Press, Oxford.
- Ault, A. P., Moffet, R. C., Baltrusaitis, J., Collins, D. B., Ruppel, M. J. and co-authors. 2013. Size-dependent changes in sea spray aerosol composition and properties with different seawater conditions. Environ. Sci. Technol. 47, 5603–5612.10.1021/es400416g
- Baron, P. A., Kulkarni, P. and Willeke, K. 2011. Aerosol Measurement : Principles, Techniques, and Applications. Wiley, Hoboken, NJ.
- Bilde, M. and Svenningsson, B. 2004. CCN activation of slightly soluble organics: the importance of small amounts of inorganic salt and particle phase. Tellus B. 56, 128–134.10.3402/tellusb.v56i2.16406
- Blanchard, D. C. 1975. Bubble scavenging and water-to-air transfer of organic material in sea. Adv. Chem. Ser. 18, 360–387.10.1021/advances
- Cavalli, F., Facchini, M. C., Decesari, S., Mircea, M., Emblico, L. and co-authors. 2004. Advances in characterization of size-resolved organic matter in marine aerosol over the North Atlantic. J. Geophys. Res.-Atmos. 109, D24215.10.1029/2004JD005137
- Clarke, A. D., Owens, S. R. and Zhou, J. C. 2006. An ultrafine sea-salt flux from breaking waves: implications for cloud condensation nuclei in the remote marine atmosphere. J. Geophys. Res.-Atmos. 111, D06202.
- Collins, D. B., Bertram, T. H., Sultana, C. M., Lee, C., Axson, J. L. and co-authors. 2016. Phytoplankton blooms weakly influence the cloud forming ability of sea spray aerosol. Geophys. Res. Lett. 43, 9975–9983.10.1002/2016GL069922
- Cruz, C. N. and Pandis, S. N. 1998. The effect of organic coatings on the cloud condensation nuclei activation of inorganic atmospheric aerosol. J. Geophys. Res.-Atmos. 103, 13111–13123.10.1029/98JD00979
- de Leeuw, G., Andreas, E. L., Anguelova, M. D., Fairall, C. W., Lewis, E. R. and co-authors. 2011. Production flux of sea spray aerosol. Rev. Geophys. 49, RG2001.
- Donaldson, D. J. and Vaida, V. 2006. The influence of organic films at the air−aqueous boundary on atmospheric processes. Chem. Rev. 106, 1445–1461.10.1021/cr040367c
- Ellison, G. B., Tuck, A. F. and Vaida, V. 1999. Atmospheric processing of organic aerosols. J. Geophys. Res.-Atmos. 104, 11633–11641.10.1029/1999JD900073
- Facchini, M. C., Rinaldi, M., Decesari, S., Carbone, C., Finessi, E. and co-authors, 2008. Primary submicron marine aerosol dominated by insoluble organic colloids and aggregates. Geophys. Res. Lett. 35, L17814.10.1029/2008GL034210
- Farmer, D. K., Cappa, C. D. and Kreidenweis, S. M. 2015. Atmospheric processes and their controlling influence on cloud condensation nuclei activity. Chem. Rev. 115, 4199–4217.10.1021/cr5006292
- Finlayson-Pitts, B. J. and Pitts, J. N. 2000. Chemistry of the Upper and Lower Atmosphere: Theory, Experiments and Applications. Academic Press, San Diego, CA; London.
- Gagosian, R. B., Peltzer, E. T. and Zafiriou, O. C. 1981. Atmospheric transport of continentally derived lipids to the tropical North Pacific. Nature 291, 312–314.10.1038/291312a0
- Gantt, B. and Meskhidze, N. 2013. The physical and chemical characteristics of marine primary organic aerosol: a review. Atmos. Chem. Phys. 13, 3979–3996.10.5194/acp-13-3979-2013
- Garland, R. M., Wise, M. E., Beaver, M. R., DeWitt, H. L., Aiken, A. C. and co-authors. 2005. Impact of palmitic acid coating on the water uptake and loss of ammonium sulfate particles. Atmos. Chem. Phys. 5, 1951–1961.10.5194/acp-5-1951-2005
- Harris, D. C. 2007. Quantitative Chemical Analysis. Freeman and Co., New York.
- Hawkins, L. N. and Russell, L. 2010. Polysaccharides, proteins, and phytoplankton fragments: four chemically distinct types of marine primary organic aerosol classified by single particle spectromicroscopy. Adv. Meteorol. 612132.
- Haynes, W. M. 2016. CRC Handbook of Chemistry and Physics. CRC Press, Boca Raton, FL.
- Hoffman, E. J. and Duce, R. A. 1976. Factors influencing the organic carbon content of marine aerosols: a laboratory study. J. Geophys. Res.-Oc. Atm. 81, 3667–3670.10.1029/JC081i021p03667
- Hunter, K. A. and Liss, P. S. 1981. Organic sea surface films. In: Marine Organic Chemistry – Evolution, Composition, Interactions and Chemistry of Organic Matter in Seawater (eds. E.K. Duursma and R. Dawson). Elsevier, pp. 259–295. http://www.sciencedirect.com/science/bookseries/04229894/31
- Kandler, K., Benker, N., Bundke, U., Cuevas, E., Ebert, M. and co-authors, 2007. Chemical composition and complex refractive index of Saharan Mineral Dust at Izaña, Tenerife (Spain) derived by electron microscopy. Atmos. Environ. 41, 8058–8074.10.1016/j.atmosenv.2007.06.047
- Keene, W. C., Maring, H., Maben, J. R., Kieber, D. J., Pszenny, A. A. P. and co-authors. 2007. Chemical and physical characteristics of nascent aerosols produced by bursting bubbles at a model air-sea interface. J. Geophys. Res.-Atmos. 112, D21202.
- King, S. M., Butcher, A. C., Rosenoern, T., Coz, E., Lieke, K. I. and co-authors. 2012. Investigating primary marine aerosol properties: CCN activity of sea salt and mixed inorganic-organic particles. Environ. Sci. Technol. 46, 10405–10412.10.1021/es300574u
- Köhler, H. 1936. The nucleus in and the growth of hygroscopic droplets. Trans. Faraday Soc. 32, 1152–1161.10.1039/TF9363201152
- Leck, C. and Bigg, E. K. 2005. Biogenic particles in the surface microlayer and overlaying atmosphere in the central Arctic Ocean during summer. Tellus B. 57, 305–316.10.3402/tellusb.v57i4.16546
- Lowe, S., Partridge, D. G., Topping, D. and Stier, P. 2016. Inverse modelling of Köhler theory – part 1: a response surface analysis of CCN spectra with respect to surface-active organic species. Atmos. Chem. Phys. 16, 10941–10963.10.5194/acp-16-10941-2016
- Marty, J. C., Saliot, A., Buat-Ménard, P., Chesselet, R. and Hunter, K. A. 1979. Relationship between the lipid compositions of marine aerosols, the sea surface microlayer, and subsurface water. J. Geophys. Res.-Oc. Atm. 84, 5707–5716.10.1029/JC084iC09p05707
- Middlebrook, A. M., Murphy, D. M. and Thomson, D. S. 1998. Observations of organic material in individual marine particles at Cape Grim during the First Aerosol Characterization Experiment (ACE 1). J. Geophys. Res.-Atmos. 103, 16475–16483.10.1029/97JD03719
- Miñambres, L., Méndez, E., Sánchez, M. N., Castaño, F. and Basterretxea, F. J. 2014. The effect of low solubility organic acids on the hygroscopicity of sodium halide aerosols. Atmos. Chem. Phys. 14, 11409–11425.10.5194/acp-14-11409-2014
- Mochida, M., Kitamori, Y., Kawamura, K., Nojiri, Y. and Suzuki, K. 2002. Fatty acids in the marine atmosphere: factors governing their concentrations and evaluation of organic films on sea-salt particles. J. Geophys. Res.-Atmos. 107, 4325.
- Mochida, M., Kawamura, K., Umemoto, N., Kobayashi, M., Matsunaga, S. and co-authors. 2003. Spatial distributions of oxygenated organic compounds (dicarboxylic acids, fatty acids, and levoglucosan) in marine aerosols over the western Pacific and off the coast of East Asia: continental outflow of organic aerosols during the ACE-Asia campaign. J. Geophys. Res.-Atmos. 108, 8638.10.1029/2002JD003249
- Mochida, M., Umemoto, N., Kawamura, K., Lim, H. J. and Turpin, B. J. 2007. Bimodal size distributions of various organic acids and fatty acids in the marine atmosphere: influence of anthropogenic aerosols, Asian dusts, and sea spray off the coast of East Asia. J. Geophys. Res.-Atmos. 112, D19S19.10.1029/2006JD007773
- Noureddini, H., Teoh, B. C. and Davis Clements, L. 1992. Viscosities of vegetable oils and fatty acids. J. Am. Oil Chem. Soc. 69, 1189–1191.10.1007/BF02637678
- O’Dowd, C. D. and de Leeuw, G. 2007. Marine aerosol production: a review of the current knowledge. Philos. T. R. Soc. A. 365, 1753–1774.
- O’Dowd, C. D., Facchini, M. C., Cavalli, F., Ceburnis, D., Mircea, M. and co-authors. 2004. Biogenically driven organic contribution to marine aerosol. Nature. 431, 676–680.10.1038/nature02959
- Orellana, M. V., Matrai, P. A., Leck, C., Rauschenberg, C. D., Lee, A. M. and co-authors. 2011. Marine microgels as a source of cloud condensation nuclei in the high Arctic. Proc. Natl. Acad. Sci. USA. 108, 13612–13617.10.1073/pnas.1102457108
- Osterroht, C. 1993. Extraction of dissolved fatty acids from sea water. Fresen. J. Anal. Chem. 345, 773–779.10.1007/BF00323009
- Patterson, J. P., Collins, D. B., Michaud, J. M., Axson, J. L., Sultana, C. M. and co-authors. 2016. Sea spray aerosol structure and composition using cryogenic transmission electron microscopy. ACS Central Sci. 2, 40–47.10.1021/acscentsci.5b00344
- Peltzer, E. T., Alford, J. B. and Gagosian, R. B. 1984. Methodology for sampling and analysis of lipids in aerosols from the remote marine atmosphere. Woods Hole Oceanog. Inst. Tech. Rept. WHOI-84-9, 115.
- Peterson, R. E. and Tyler, B. J. 2002. Analysis of organic and inorganic species on the surface of atmospheric aerosol using time-of-flight secondary ion mass spectrometry (TOF-SIMS). Atmos. Environ. 36, 6041–6049.10.1016/S1352-2310(02)00686-6
- Peterson, R. E. and Tyler, B. J. 2003. Surface composition of atmospheric aerosol: individual particle characterization by TOF-SIMS. Appl. Surf. Sci. 203–204, 751–756.10.1016/S0169-4332(02)00812-7
- Petters, M. D. and Kreidenweis, S. M. 2007. A single parameter representation of hygroscopic growth and cloud condensation nucleus activity. Atmos. Chem. Phys. 7, 1961–1971.10.5194/acp-7-1961-2007
- Petters, M. D., Kreidenweis, S. M. and Ziemann, P. J. 2016. Prediction of cloud condensation nuclei activity for organic compounds using functional group contribution methods. Geosci. Model Dev. 9, 111–124.10.5194/gmd-9-111-2016
- Petters, S. S. and Petters, M. D. 2016. Surfactant effect on cloud condensation nuclei for two-component internally mixed aerosols. J. Geophys. Res.-Atmos. 121, 1878–1895.10.1002/2015JD024090
- Prisle, N. L., Raatikainen, T., Laaksonen, A. and Bilde, M. 2010. Surfactants in cloud droplet activation: mixed organic-inorganic particles. Atmos. Chem. Phys. 10, 5663–5683.10.5194/acp-10-5663-2010
- Quinn, P. K., Bates, T. S., Schulz, K. S., Coffman, D. J., Frossard, A. A. and co-authors. 2014. Contribution of sea surface carbon pool to organic matter enrichment in sea spray aerosol. Nat. Geosci. 7, 228–232.10.1038/ngeo2092
- Quinn, P. K., Collins, D. B., Grassian, V. H., Prather, K. A. and Bates, T. S. 2015. Chemistry and related properties of freshly emitted sea spray aerosol. Chem. Rev. 115, 4383–4399.10.1021/cr500713g
- Raymond, T. M. and Pandis, S. N. 2002. Cloud activation of single-component organic aerosol particles. J. Geophys. Res.-Atmos. 107, 4787.
- Renbaum-Wolff, L., Grayson, J. W., Bateman, A. P., Kuwata, M., Sellier, M. and co-authors, 2013. Viscosity of alpha-pinene secondary organic material and implications for particle growth and reactivity. Proc. Natl. Acad. Sci. USA. 110, 8014–8019.10.1073/pnas.1219548110
- Rickards, A. M. J., Miles, R. E. H., Davies, J. F., Marshall, F. H. and Reid, J. P. 2013. Measurements of the sensitivity of aerosol hygroscopicity and the κ parameter to the O/C ratio. J. Phys. Chem. A. 117, 14120–14131.10.1021/jp407991n
- Rose, D., Gunthe, S. S., Mikhailov, E., Frank, G. P., Dusek, U. and co-authors. 2008. Calibration and measurement uncertainties of a continuous-flow cloud condensation nuclei counter (DMT-CCNC): CCN activation of ammonium sulfate and sodium chloride aerosol particles in theory and experiment. Atmos. Chem. Phys. 8, 1153–1179.10.5194/acp-8-1153-2008
- Ruehl, C. R. and Wilson, K. R. 2014. Surface organic monolayers control the hygroscopic growth of submicrometer particles at high relative humidity. J. Phys. Chem. A. 118, 3952–3966.10.1021/jp502844g
- Russell, L. M., Hawkins, L. N., Frossard, A. A., Quinn, P. K. and Bates, T. S. 2010. Carbohydrate-like composition of submicron atmospheric particles and their production from ocean bubble bursting. Proc. Natl. Acad. Sci. USA. 107, 6652–6657.10.1073/pnas.0908905107
- Schatzberg, P. 1967. Molecular diameter of water from solubility and diffusion measurements. J. Phys. Chem. 71, 4569–4570.10.1021/j100872a075
- Schwier, A., Mitroo, D. and McNeill, V. F. 2012. Surface tension depression by low-solubility organic material in aqueous aerosol mimics. Atmos. Environ. 54, 490–495.10.1016/j.atmosenv.2012.02.032
- Skop, R. A., Viechnicki, J. T. and Brown, J. W. 1994. A model for microbubble scavenging of surface-active lipid molecules from seawater. J. Geophys. Res.-Oceans. 99, 16395–16402.10.1029/94JC01199
- Sorjamaa, R., Svenningsson, B., Raatikainen, T., Henning, S., Bilde, M. and co-authors, 2004. The role of surfactants in Kohler theory reconsidered. Atmos. Chem. Phys. 4, 2107–2117.10.5194/acp-4-2107-2004
- Tervahattu, H., Hartonen, K., Kerminen, V. M., Kupiainen, K., Aarnio, P. and co-authors. 2002a. New evidence of an organic layer on marine aerosols. J. Geophys. Res.-Atmos. 107, 4053.
- Tervahattu, H., Juhanoja, J. and Kupiainen, K. 2002b. Identification of an organic coating on marine aerosol particles by TOF-SIMS. J. Geophys. Res.-Atmos. 107, 4319.
- Tseng, R. S., Viechnicki, J. T., Skop, R. A. and Brown, J. W. 1992. Sea-to-air transfer of surface-active organic compounds by bursting bubbles. J. Geophys. Res.-Oceans. 97, 5201–5206.10.1029/91JC00954
- Wurl, O., Wurl, E., Miller, L., Johnson, K. and Vagle, S. 2011. Formation and global distribution of sea-surface microlayers. Biogeosciences 8, 121–135.10.5194/bg-8-121-2011
- Xiong, J. Q., Zhong, M. H., Fang, C. P., Chen, L. C. and Lippmann, M. 1998. Influence of organic films on the hygroscopicity of ultrafine sulfuric acid aerosol. Environ. Sci. Technol. 32, 3536–3541.10.1021/es980019q