
Abstract
As a contribution to an EU project which dealt with the effects of climate change, air pollution impacts and ecosystems, two different atmospheric chemical transport models were used to simulate the depositions of acidifying and eutrophying pollutants over Europe for the period 1900–2050. Given the unavoidable uncertainties in the historical inputs to these simulations (emissions, meteorology), we generated a new and unique data-set for the purposes of model evaluation; comprising data from the European Air Chemistry Network (EACN) in operation from 1955 to early 1980s and more recent data from the EMEP monitoring network. The two models showed similar and reasonable skills in reproducing both the EACN and EMEP observational data although the MATCH model consistently simulates higher concentrations and depositions than the EMEP model. To further assess the models’ ability to reproduce the long-term trend in sulphur and nitrogen deposition we compared modelled concentrations of major ions in precipitation with data extracted from a glacier in the European Alps. While, the shape and timing of the nss-sulphate data agrees reasonably, the ice core data indicate persistently high nitrogen concentrations of oxidised and reduced nitrogen after the 1980s which does not correspond to the model simulations or data from Western Europe in the EMEP monitoring network. This study concludes that nss-sulphate deposition to Europe was already clearly elevated in the year 1900, but has now (mid-2010s) decreased to about 70% of what it was at the beginning of the last century. The deposition of oxidised nitrogen to Europe peaked during the 1980s but has since decreased to half of its maximum value; still it is 3–4 times higher than in the year 1900. The annual deposition of reduced nitrogen to Europe is currently more than two times as high as the conditions in the year 1900.
1. Introduction
The industrial revolution in Europe, powered largely by energy from the burning of fossil coal, led to ever increasing emissions of carbon dioxide and air pollutants into the atmosphere. Chimneys emitting black or white smoke were seen as signs of modernity and economic development and emissions continued to increase as nations industrialised (Fenger, Citation2009). While, local air pollution admittedly became a concern in some areas, the general belief was that taller stacks would resolve all problems by diluting the plumes into the seemingly infinite atmosphere (ibid.). The perception that human activities could affect the environment in distant regions was inconceivable until the late 1960s when it was shown that emissions from continental Europe and the British Isles led to the acidification of Scandinavian lakes and soils (Odén, Citation1968). Concern about the European environment combined with decreased profitability in the British coal-mines and the collapse of the former Eastern bloc, all contributed to the monumental shift in the trend of European sulphur dioxide (SO2) emissions to the atmosphere during the 1970s and 1980s (Grennfelt and Hov, Citation2005).
Following the rapid increase of private and commercial vehicles after the Second World War, additional sources of air pollutants became important. Petrol and diesel fuelled cars and trucks typically emitted less SO2 but relatively more nitrogen oxides (NO2 and NO, the sum often referred to as NOx) compared to the industrial and household burning of fossil coal. The advent of mass transportation was at a much later date than that of the coal-fired power plants in Europe but its impact on acid deposition and air-borne pollutants eventually became comparable to that of anthropogenic SO2 emissions from power plants and industry (Reis et al., Citation2009; Fowler et al., Citation2013).
Taking advantage of the Nobel prize awarded technique of making ammonia (NH3) out of the practically endless atmospheric reservoir of nitrogen (the Haber–Bosch process), European farmers started to spread their fields with industrial fertiliser which, together with mechanisation, lead to much greater productivity in the agricultural sector. The increasing number of livestock held in Europe is the dominant source for the high atmospheric loading of NH3 in the European atmosphere (Fowler et al., Citation2013). Leakage of NH3 from farmland to the atmosphere constitutes an important anthropogenic source of reactive nitrogen (Nr; all components of oxidised and reduced nitrogen) to the European atmosphere (Galloway et al., Citation2004, Fowler et al., Citation2013). Increased temperature, as a result of climate change, may amplify the NH3 emissions from soil to the atmosphere (Skjøth and Geels, Citation2013; Sutton et al., Citation2013), negating some of the expected benefits of planned emission control for reducing exceedances of the critical levels for Nr deposition (Simpson et al., Citation2014).
Excessive deposition of sulphur has caused severe acidification problems in large areas of Europe (e.g. Schöpp et al., Citation2003) while, elevated deposition of Nr can result in both acidification and eutrophication of soils and water bodies (Galloway et al., Citation2004; Fowler et al., Citation2013). International agreements to abate the emissions leading to acidifying and eutrophying deposition – such as the Gothenburg Protocol (Reis et al., Citation2012) and the National Emissions Ceilings Directive (Amann et al., Citation2011) – has led to changed practices and new techniques in industry, transport and agriculture, which continue to reduce the European emissions of air pollutants to the atmosphere. Although sulphur and nitrogen pollution in Europe still mostly emanate from internal sources, one cannot ignore emissions outside Europe (i.e. in North America and Asia) when dealing with European air quality (Sanderson et al., Citation2008). In the future, the hemispheric background is expected to become even more important in determining air quality in Europe (Wild et al., Citation2012).
The status of an ecosystem is governed not only by the current stress factors, but by the integrated effect of variations in climate, ambient air quality and deposition of atmospheric trace species (sulphur and nitrogen as well as base cations and other nutrients). Individual trees can live for hundreds of years and the underlying soil conditions are the result of thousands of years of litter fall, atmospheric deposition and leaching of minerals. To understand the present and future condition of European forests it is therefore, important to consider the history of the soil and the standing biomass.
There are already a number of studies addressing pan-European trends in deposition, both extending into the future (Engardt and Langner, Citation2013; Lamarque et al., Citation2013; Simpson et al., Citation2014), or covering historical periods (Mylona, Citation1996; Schöpp et al., Citation2003; Fagerli et al., Citation2007; Fagerli and Aas, Citation2008; Claremar et al., Citation2013; Lamarque et al., Citation2013). The modelling data presented in this paper were prepared expressly to facilitate harmonised inputs to a set of long-term ecosystem models, as part of the EU ECLAIRE project (Effects of Climate Change on Air Pollution and Response Strategies for European Ecosystems, http://www.eclaire-fp7.eu). Such models, which include the LPJ–GUESS model (Smith et al., Citation2001; Arneth et al., Citation2007), the OC–N model (Zaehle et al., Citation2010, Franz et al., Citation2017) and the JULES model (Best et al., Citation2011), make use of nitrogen deposition as well as climate data and atmospheric ozone and carbon dioxide concentrations to simulate ecosystem (and biomass) changes over decadal time scales. The long-term (1900–2050) forest carbon sequestration study of De Vries et al. (Citation2017) also made use of EMEP model ozone and deposition data from this work. As part of ECLAIRE both the atmospheric inputs and the regional climate model meteorology as described here were made available to these ecosystem modelling groups.
For this work, we set-up and performed internally coherent model simulations of sulphur and nitrogen deposition to European ecosystems over the 150-year period 1900 to 2050. Our study covers the dynamic period when European air pollution first increased dramatically, then levelled off and started to decrease; it concludes by looking into the future when we also have to deal with the concurrent threat of anthropogenic climate change. To illustrate some of the uncertainties in the calculations we employ two different chemical transport models (CTMs), operating with identical input (gridded emissions and three-dimensional, time varying, climate data). The models have recently been evaluated by comparing with data representing current (ca. 2005) emissions and climate (see Simpson et al., Citation2014).
Given the unavoidable uncertainties in the historical inputs to these simulations (emissions and meteorology), a significant effort has been made to evaluate the model performance over this time period. For this purpose, we have reevaluated and harmonised a unique historical data-set, that of the European Air Chemistry Network (EACN) in operation from 1955 to early 1980s. Data from more than 100 EACN stations have been merged with more recent data from the EMEP (European Monitoring and Evaluation Programme) monitoring network to construct quality controlled series of observed concentration of major ions in precipitation from 1955 through 2011. In addition to these data, we also make use of concentration records extracted from an Alpine ice core. The aim of the comparison with observations is to judge the models’ abilities to reproduce absolute levels and historical trends of the deposition of sulphur and nitrogen across Europe.
2. Models and their input data
2.1 Chemical transport models
Two different CTMs (MATCH and the EMEP MSC-W model) were used to simulate the evolution of air pollution in Europe over the 150-year period 1900 to 2050. Although the models have some similarities (especially in their chemical mechanism, both updated from earlier EMEP schemes, e.g. CitationAndersson-Sköld and Simpson, 1999), they also differ in many respects and show distinct differences in, for example, nitrogen deposition estimates (Simpson et al., Citation2014). Up to date information of the MATCH model can be found in Engardt and Langner (Citation2013) or Andersson et al. (Citation2007). The EMEP modelling system (here version rv4.4) is essentially the same as that described in detail in Simpson et al. (Citation2012), with earlier comparisons with sulphur and nitrogen species presented in Fagerli et al. (Citation2008) and Simpson et al. (Citation2006a, Citation2006b).
Minor differences between the models include different numerical values for certain parameters (dry deposition parameters, scavenging coefficients, reaction rate constants and yields), different advection schemes and different vertical discretisation of the model domain. More significant distinctions include the description of the near-surface turbulent mixing and different schemes for deducing the wet deposition of gases and particles. The EMEP model also calculates the pH of cloud and rain droplets based on the ion balance at every time step, and has temporally evolving dry deposition velocities for SO2 and NH3. In the MATCH model, the pH of cloud droplets is fixed throughout the whole simulation period and the dry deposition velocities of each species have the same values and seasonal variation during all simulated years.
For this study, both models use identical annually accumulated anthropogenic emissions and common meteorology. The annual emissions are distributed according to the respective model’s standard configuration in terms of release height, temporal profile of emissions from different sectors and splitting between different subspecies, etc. Both models adopt the geometry of the regional climate model in the horizontal domain (85 × 95 cells of ca. 50 km × 50 km size). Except for the lowest layer, which is divided into three layers, MATCH follows the regional climate model’s configuration in the vertical. MATCH uses 15 layers to represent the lower troposphere (model top at ca. 6 km height). The EMEP model interpolates the regional climate model’s meteorology vertically to fit its native vertical coordinate system which extends to 100 hPa (ca. 16 km above the surface).
Seasonally varying lateral and top boundaries are based on each model’s best estimate of the conditions during 2000. To mimic the temporal trend in the hemispheric background over the period 1900 to 2050 both models employ common scaling factors for the species that are assumed to have changed significantly during the simulated period. The chemical schemes of the two models do not consider identical species and it was left to the respective modelling team to select which species should be set constant or follow one of the factors provided (see Figure S1 in the Supplementary Material). Boundary concentrations of methane, in both models, follow the global mean trend specified in RCP6.0 (van Vuuren et al., Citation2011).
2.2 Emissions
The chemical schemes used by the MATCH and EMEP models in this study require emissions of SO2, NOx, NH3, non-methane volatile organic compounds (NMVOCs), and carbon monoxide from natural and anthropogenic sources. The utilised anthropogenic emissions consist of gridded, annual total, data from ten different sectors (SNAP-level; SNAP stands for Source Nomenclature of Air Pollutants). The data are an extended version of that used by Simpson et al. (Citation2014) in a multi-model comparison of future nitrogen deposition in Europe. Detailed SNAP-level emissions are available for recent years from a number of sources, not least the EMEP official databases (http://www.emep.int) or from the International Institute for Applied System Analysis (IIASA, http://www.iiasa.ac.at). These emissions do not cover the historical period we are interested in, and changes in reporting and methodologies complicate the generation of temporally consistent data. In order to generate an exhaustive data-set, a number of emission inventories that became available in 2012 were merged, aiming to provide consistency (as far as possible) with other data used within the ECLAIRE project, and best possible spatial resolution for the underlying emissions data. The latter aspect is important as the emissions need to be interpolated to the rotated latitude–longitude horizontal grid of the climate model, and the finer the base grid the more accurate such interpolation can be. A multi-step procedure was used to generate the common anthropogenic emissions data used by the two models.
Firstly, national, SNAP-level, emissions were taken from the ECLIPSE database produced by IIASA for various EU Projects and the Task Force on Hemispheric Transport of Air Pollution (Amann et al., Citation2013; Stohl et al., Citation2015). The original (version 4) databases produced in 2011 were updated in February 2012 for the ECLAIRE project (to version 4a). Secondly, for countries within the MACC area (this includes the entire EU and some neighbouring countries), the 7 km resolution MACC-2 emissions produced by TNO (Kuenen et al., Citation2011; Citation2014) were used to spatially distribute the country-specific SNAP emissions. For other countries the IIASA 0.5 degree by 0.5 degree spatial resolution was preserved. Finally, international shipping emissions were added from the RCP6.0 data-sets (Hijioka et al., Citation2008). Emission data-sets were provided by IIASA for the years 2005, 2010, and a 2030, 2050 `current legislation’ (CLE) scenario. The EU totals, and changes between 2005 and 2050, are given in Simpson et al. (Citation2014). For 1990, emissions from land–based sources were taken directly from the EMEP database for that year, since 1990 had been the subject of recent review and quality control (e.g. Mareckova et al., Citation2013). Emissions between 1990 and 2005 were simply estimated via linear interpolation between the EMEP 1990 and IIASA/ECLAIRE 2005 values. Although simple, this procedure ensured consistency with two data-sets believed to have good quality for the respective end years, and avoided some known inconsistencies of the EMEP database for interim years. Emissions prior to 1990 were derived by scaling the EMEP 1990 emissions by the emissions ratios found in the historical data series of Lamarque et al. (Citation2010). Yearly emissions up to 2050 were achieved by linear interpolation between the years with data.
A number of other emissions sources are typically also used in the CTMs. These include natural NOx emissions from soils, NMVOC from vegetation, as well as emissions from oceans, forest fires, aircraft and lightning. The MATCH and EMEP models have different approaches to these emissions sources, and harmonising these was beyond the scope of our study. Instead, in order to simplify the interpretation of the CTM results, we have adopted the policy of setting emissions from soils, forest fires, aircraft and lightning to zero, so that all emissions in the models stem from the common emission data-set discussed above. Tests have shown that this approximation has only a small impact on annual deposition totals to Europe, even for simulations at the beginning of the 20th century. In contrast to these relatively minor emission sources, emissions of NMVOC from vegetation are too great to ignore (Simpson et al., Citation1999), and as in Langner et al. (Citation2012) each model calculates its own emissions at each model time step based upon meteorology and land cover. For these calculations, the land cover is assumed to remain constant over the 150 years, but as even the base-case biogenic NMVOC emissions estimates are so uncertain (e.g. Simpson et al., Citation1999; Langner et al., Citation2012) this is a secondary problem, and furthermore assumed to have limited impact on sulphur and nitrogen depositions. Volcanic emissions are a significant fraction of European sulphur emissions and both models used the official EMEP estimate of volcanic emissions, which provides a constant value for all years. The MATCH model also considered seasonally varying SO2 emissions from oceans (a proxy for DMS emissions). These emissions are minor compared to other SO2 emissions in the model domain but may influence sulphur concentrations close to open water. The temporal evolutions of the sulphur and nitrogen emissions in the model domain are visualised in Figure S2 of the Supplementary Material.
It should be noted that many simplifying assumptions are needed when estimating, in particular, historical emissions. The spatial distributions of the emissions are scaled from current distributions (for 2005); we thus ignore, for example, the extensive changes known to have taken place in point-source emissions – both in terms of number and stack heights. Emission factors early in the period are of course much more uncertain than in recent years, especially for NOx where combustion conditions rather than fuel content largely control emission rates (Vestreng et al., Citation2009), and where statistical data is of generally poorer quality (ibid.). The major sources have also changed in relative importance over this period. For example, domestic coal burning was a larger source of NH3 at the start of the twentieth century than agriculture in the United Kingdom, but the associated emission factors from domestic coal are very uncertain (Fowler et al., Citation2004). Assumptions often made about the emission factors for Eastern versus Western Europe (especially prior to 1990; Vestreng et al., Citation2009; van Aardenne et al., Citation2001) are also difficult to assess in terms of uncertainty, and such differences can also impact regional-scale trends (Fricke and Beilke, Citation1992). However, such uncertainties are inevitable given the lack of activity data and emission factors for past activities. Our underlying assumption is that the main driver of change will be total emissions, and our methodology should provide a good approach to consistent trends from 1900 to 2050.
2.3 Meteorology
The driving meteorology for the CTM simulations is taken from the regional climate model RCA3 (Kjellström et al., Citation2011; Samuelsson et al., Citation2011). We use the downscaling of ECHAM5 A1B-r3 (simulation 11 in Table of Kjellström et al., Citation2011). These data have already been used in a number of recent studies of the future deposition of acidifying and eutrophying species (e.g. Engardt and Langner, Citation2013; Tuovinen et al. Citation2013; Simpson et al., Citation2014).
Table 1. Evaluation scores for the MATCH and EMEP models during two different historical time periods. Obs. is the arithmetic average of the n multi-year observations during the respective period. FO2 is the fraction of modelled multi-year averages that fall within a factor of two of the corresponding observational multi-year average. Bias and RMSE are the average bias and root mean square error of model results. Correlation coefficient denotes the correlation between the n modelled and observational multi-year values (i.e. the spatial correlation).
The regional climate simulation covers the period 1960 to 2100. Engardt and Langner (Citation2013) showed that projected trends in deposition due to changes in climate are dwarfed by the trends induced by emission changes. Assuming that this relation also applies to the first half of the twentieth century, we generate a meteorological series starting in 1900 by assigning random years of 1960 to 1969 to represent each of the years 1900 through 1959 (the assignments were performed by S. Zaehle, personal communication, for use in the ECLAIRE project). All consecutive data (complete three-dimensional model states, every 6 h) are copied from the respective native year to the new, earlier, year. The procedure will admittedly result in discontinuities in weather (wind direction, temperature etc.) during most year-ends, but the discontinuity affects a very small fraction of the time and the alternative – to use the present climate copy pasted as a time slot to the more distant past – would negatively reduce the stochastic nature of the climate. Further, the meteorological data from a climate model do not represent a certain date, but rather should statistically represent the climate of the past and future. In Figs. and , we compare the resulting produced annual mean 2 m temperature and annually accumulated precipitation in EU28+ (EU28+ Norway and Switzerland) to observational data. The original and extrapolated RCA3 data are arithmetic averages over all grid cells that are denoted as EU28+ country in our modelling domain. Observational EU28+ data are area-weighted combinations of corresponding country averages extracted from CRU CY3.21 which, in turn, is derived from the global CRU TS3.21 data-set (Harris et al., Citation2014). The different series are not strictly representing identical quantities, but are well suited to illustrate general biases and trends in the data we use for driving our CTMs from 1900 to 2050.
Fig. 1. Trends of annual average 2 m temperatures in EU28+. RCA3 data from 1900–1959 are copies of random years during the period 1960–1969. Observational data, 1901–2012, are formed from area-weighted country averages in CRU CY3.21.
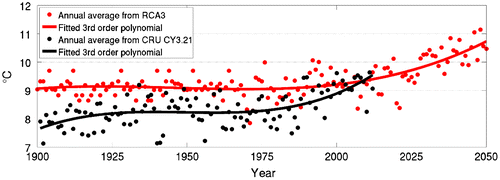
Fig. 2. Trends of annually accumulated average precipitation in EU28+ . RCA3 data from 1900–1959 are copies of random years during the period 1960–1969. Observational data, 1901–2012, are formed from area-weighted country averages in CRU CY3.21.
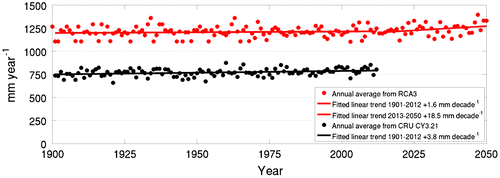
Figures and also reveal that RCA3 has significant temperature and precipitation biases in EU28+ during the period 1961 to 1990 (+0.7 °C and +0.4 m year−1, respectively). Kjellström et al. (Citation2011) show that the positive temperature bias in the RCA3 downscaling of ECHAM5 A1B-r3 is especially large in winter; in summer, on the other hand, the temperature is slightly underestimated during 1961 to 1990 in this regional climate projection. The precipitation bias in our extrapolated meteorological series remains largely constant over the historical period 1901 to 2012, while observed temperatures are about 1 °C lower than the modelled values at the beginning of the twentieth century and similar to RCA3 around 2000. This means that the observed positive temperature trend 1901 to 2012 is not reproduced in our extrapolated meteorological data-set used as forcing of the CTMs. Both temperature and precipitation are expected to increase more rapidly after 2012, with annual mean temperatures in EU28+ being about 1.5 °C warmer in 2050 than in 2000.The impact of the temperature bias on the deposition estimates is expected to be minor, whereas the overestimation of precipitation may result in a too short life time of sulphur and nitrogen species in the atmosphere. Fortunately, the time consistency of the bias in the precipitation decreases the risk of introducing artificial trends in the modelled data-set.
3. Observations
3.1 Precipitation chemistry networks
Sporadic observations of the deposition of selected species exist from the late 1800 century onwards (e.g. Miller, Citation1905; Russel and Richards, Citation1919; see also references in Brimblecombe and Stedman, Citation1982; Ruoho-Airola et al., Citation2012). Systematic, pan-European, monitoring of deposition and precipitation chemistry begun in the mid-1950s through the introduction of the European Air Chemistry Network (EACN; Egnér and Eriksson, Citation1955). The network used the newly developed ‘Égner cabinets’, designed to collect bulk samples of precipitation with monthly resolution. The original purpose of this network was to establish the flux of plant nutrients to forests and agricultural regions across Europe. The monitoring stations were generally located away from urban and industrial pollution sources but the practice to place them at farms or at agricultural research sites made the data prone to impacts from local dust and NH3 emissions. The EACN was operational from 1955 to 1985 although most stations only have data from a fraction of this period. The number of stations exceeded 100 during the first decade of operation but subsequently decreased over time (Granat, Citation1978). The EACN stations were mainly located in Northwestern Europe. Original data were published in a series of articles in the present journal, starting with Egnér and Eriksson (Citation1955) and ending with Anonymous (Citation1960). All currently available data, together with information about sampling sites, sampling equipment, analytical methods and institutions involved in collection and analysis are collected in Granat (Citation2010).
In Sweden, as in other parts of Europe, the EACN stations were gradually phased out and replaced by other sites. The new Swedish network, which came into operation in 1983, strived for regionally representative sampling locations and used uniform equipment and measurement protocols. Criteria included: at least two bulk collectors within some 300 m distance at each site, bulk collectors specifically designed for summer or winter use (‘funnel and bottle’ and ‘snow sack’), ‘wet–only’ collectors at a subset of sites and full analysis of all samples up to 1991. This, so-called, PMK network was operated by the Department of Meteorology at Stockholm University (e.g. Granat, Citation1991). From mid-1991, the PMK network was operated by the Swedish Environmental Research Institute (IVL) as the LNKN network. IVL also operated about five EMEP stations in Sweden from 1978 onwards. A thorough discussion of these data-sets together with an analysis of trends in the nitrogen deposition to Sweden 1955–2011 is available in Hansen et al. (Citation2013). Other studies which made use of EACN data include the chronology of nitrogen deposition in the UK by Fowler et al. (Citation2004), and long-term estimates of nutrient inputs to the Baltic Sea (Ruoho-Airola et al., Citation2012).
The pan-European EMEP network became operational during the early 1970s and it is still the backbone of the monitoring of air pollution and surface deposition in Europe (Tørseth et al., Citation2012). It comprises fewer stations than its predecessor EACN but is geographically more extensive. The EMEP network is specifically designed for sampling regionally representative background air and precipitation and large efforts has been devoted to harmonising the measurements across Europe.
3.2 Data screening
Although the EACN data represent a unique archive of our past, limited availability, incomplete or lost documentation of the collection and chemical analyses, and the sometimes questionable representativeness and accuracy have precluded extensive exploitation of the data. Early examples of its usage can be found in Odén (Citation1968), Granat, (Citation1972), Granat (Citation1978), Kallend et al. (Citation1983), Rodhe and Granat (Citation1984) and Rodhe and Rood (Citation1986). In the present study we have returned to the original data and subjected them to a series of quality controls before generating precipitation-weighted annual mean concentrations in precipitation of nss-sulphate (sulphate excluding sea salt sulphur, nss-SO42−), nitrate (NO3−) and ammonium (NH4+) at more than 100 sites across Northwestern Europe during a period with few other published measurements.
To ensure representative data, we have developed a protocol to identify occasional contamination of the samples during collection, changes in sample composition during and after collection, systematic errors in the chemical analyses, and contamination by local sources due to unfavourable location of the measurement sites. The chemical analysis at individual stations and the spatial representativeness are thoroughly discussed in Granat (Citation1975) and Granat (Citation2010) for Swedish EACN stations. The following is a summary of the methods we use to minimise the risk of including erroneous or non-representative data:
| (1) | A limited number of obviously erroneous data (e.g. misplaced decimal point) were removed at the onset of the analysis. | ||||
| (2) | From the remaining monthly data of each EACN or PMK station we calculated the gross mid-spread (i.e. the difference between the 75 percentile and 25 percentile) for each species. All monthly values larger than the station’s respective 5 × mid-spread value were rejected. This criterion removes occasional and very high values. The factor 5 was selected after tests with the 1983–1990 PMK data series which were scrutinised by comparing all measurements at each site. Less than 1% of data were removed with the factor 5 and the multi-year mean values were lowered by about 1%. | ||||
| (3) | The spatial variation in normalised concentrations (ratio between yearly mean values and the mean value for the 1983–1990 period (aka ‘reference concentration’, explained below)) were analysed and stations deviating largely from the characteristics of a particular region were deemed locally biased (non-representative) and excluded from the subsequent analyses. | ||||
| (4) | A few year′s data were removed based on large fluctuations in annual mean concentrations between consecutive years (a factor 2 or larger) or very large deviations from neighbouring stations. In a few cases, this was also supported by a very poor ion and conductivity balance. Some large year-to-year variations, particularly in France, were retained since it was uncertain if the low or high values were in error. | ||||
An overview of the sites, including information on the available data is given in Table S5 in the Supplementary Material. For every year during the period 1955 to the present day, we find that data availability and quality was superior in the Nordic countries, with Sweden excelling with, on the average, 23 stations each year with acceptable data quality.
3.3 Multi-year averages and normalised concentrations
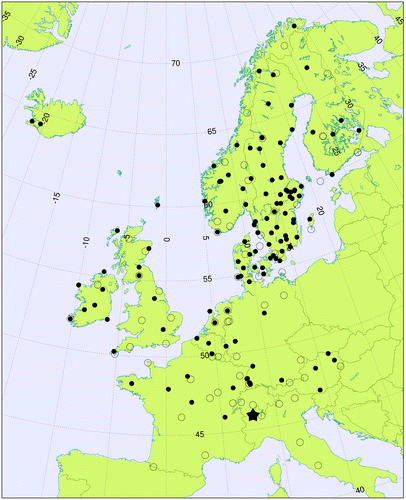
The MATCH and EMEP models, operating with meteorological forcing from a climate model, have recently been evaluated against observations representing the conditions during the early 2000s (Simpson et al., Citation2014). In the present work, we wanted to assess the quality of the input data and the performance of the models also for earlier periods. For this purpose, we compare station-wise, multi-year, averages over two different historical periods, 1958–1966 and 1983–1990. The earliest period was selected because it provides the most extensive coverage of the EACN data and the later period was selected because of the excellent coverage of Sweden during this period. The locations of the stations with multi-year averages are shown in Fig. . For the data from EACN, we first produced precipitation-weighted annual mean concentrations from the valid monthly data. We consider an annual value defined if at least 9 months of data are available (i.e. ≥75% data capture). For the EMEP observations, the multi-year mean values are formed by taking the arithmetic average of the precipitation-weighted data available from the website (http://www.emep.int). The multi-year averages from the EACN and EMEP networks are found in the Supplementary Material (Table S3 and S4).
Fig. 3. Locations of EACN stations with a valid 9-year average concentration during 1958–1966 (solid black circles). Unfilled circles indicate the locations of the EMEP sites with at least one annual mean concentration during the 8-year period of 1983–1990. The location of Colle Gnifetti is indicated with a star.
The location of the EACN and EMEP stations rarely, if ever, coincide – which follows from the different design and scope of the two networks. In most countries there were only limited overlaps in time between the EACN and EMEP networks. Further, very few of the observational data series in either the EACN or the EMEP network cover the whole life time of the respective programme; new stations have been added and old have been decommissioned. From the data, it is clear that substantial differences can occur between adjacent stations; forming annual averages of the absolute concentrations over a country or region will therefore be heavily impacted by the availability and location of stations during each year. To be able to use all the intermittent data from both networks for trend analysis, we normalised all stations’ precipitation-weighted annual mean concentrations with their respective long-term average over the period 1983 to 1990 (each station’s ‘reference concentration’) before forming annual mean ratios (i.e. normalised concentrations) which could then be averaged over all valid stations for each year.
The reference concentrations for the Swedish EACN stations were extracted from maps based on the high-quality PMK data for 1983–1990 (Granat, Citation1991) and other auxiliary information (e.g. other publications including additional observations in Sweden). For the non-Swedish EACN stations the reference concentrations were extracted from concentration fields for 1983–1990, which were prepared for this study based on available data from the EMEP network. For the EMEP data, it was straightforward to produce normalised concentrations for most stations as the 1983–1990 average could often be constructed from the available data. In some cases, the observational means were adjusted by including one adjacent year in the calculation of the reference concentration. Reasons for this included too few data points or highly anomalous data reported for 1983–1990. There were also cases where data were lacking completely during the 1983–1990 period. For these sites a reference concentration was deduced at that location as an interpolation of available surrounding observations during the normalising period (i.e. the same method as used for the EACN data). For the model data it was uncomplicated to create normalised concentrations since model results are available for all years.
3.4 Ice core data
Glaciers are natural archives preserving snow precipitation that fell in the past. There are, however, a number of factors that complicate a direct translation of the concentrations of major ions in the glacier ice to an average concentration in precipitation during the period when this precipitation fell. Concentration records of nss-sulphate, nitrate and ammonium covering the time period 1850 to 2015 were obtained from ice cores collected at the same site on Colle Gnifetti (Monte Rosa, 45.93°N 7.88°E, 4455 m asl (above sea level)) in 2003 (Jenk et al., Citation2009) and 2015. The Colle Gnifetti forms the uppermost part of the accumulation area of Grenzgletscher in the Monte Rosa massif and is the highest glacier saddle in the Alps suitable for ice core research. The drilling site is located near the boundary between the infiltration-recrystallisation and the cold infiltration zones of the glacier. Meltwater produced occasionally by intense solar radiation refreezes in the few cm below the surface and does not percolate through the annual layers. Thus, the chemical stratigraphy is well preserved and was used among others methods to date the ice core (Jenk et al., Citation2009). Most chemical trace species show a pronounced seasonality in Alpine ice cores with concentration peaks in summer. This is caused by the meteorological conditions prevailing in the Alps, favouring convective transport of boundary layer air to high-altitude sites such as Colle Gnifetti in summer. Since there is also strong year-to-year variability due to changing meteorological conditions (Schwikowski and Eichler, Citation2010; Fagerli et al., Citation2007), 10-year averages are considered here to discuss long-term trends in deposition.
4. Results
4.1 Average concentration in precipitation during two historical periods
Figure shows a comparison between simulated and observed multi-year mean concentration in precipitation of nss-sulphate, nitrate and ammonium at a number of sites across Europe (cf. filled and unfilled circles in Fig. ). Observational data from the 1958–1966 period (93–105 sites) are from the EACN network and biased to Northern Europe; data from 1983–1990 (68 sites, not identical for all three species) are from the EMEP monitoring network with a more uniform distribution across Northern, Western and Central Europe. Model results are extracted from the grid cell encompassing the respective station and averaged over the full 8- or 9 year period.
Fig. 4. Multi-year averages of modelled (MATCH – red; EMEP – blue) versus observed concentration in European precipitation during the early 1960s (1958–1966, left) and the late 1980s (1983–1990, right). n is the number of stations with valid observations during the period in question. The solid line indicates the 1:1 relation and the dashed lines are the factor of two envelopes. Regression statistics are given in Table . Numerical values of the observations are provided in Tables S3 and S4 in the Supplementary Material.
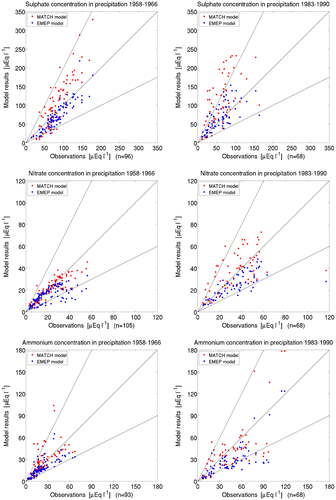
Except for one observation during 1983–1990 (IT0003R: [NO3−] = 117 μEq l−1; which is more than twice as high as the other observations from Italy, see Table S4 in the Supplementary Material) the models capture both the span and absolute levels of the observations during both periods relatively well. The two models’ multi-year mean concentrations lie within a factor of two of the corresponding EACN observations at 80–96% of the stations during 1958–1966. The MATCH model clearly overestimates nss-sulphate compared to the observations during both periods but 60% of its simulated nss-sulphate concentrations are within a factor of two of the observations during the later period. The EMEP model underestimates nitrate and ammonium concentrations compared to the observations during both periods. It reproduces 65% of the ammonium data within a factor of two during the later period, while 93–94% of nss-sulphate and nitrate fall within a factor of two of the observations. Additional statistical scores for the two periods, including RMSE and correlation coefficient can be found in Table .
4.2 Trends of concentration in precipitation during 1955–2011
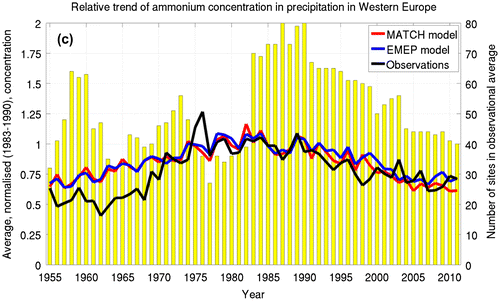
Figures show the temporal evolution of the normalised (see Section 3.3) concentration of major ions in precipitation in Western Europe. The modelled series consist of annual mean, normalised concentrations, averaged over all sites (more than 200) with observational data anytime during the 1955–2011 period. The observational series, on the other hand, are formed by averaging the available normalised concentrations for each year. The observational series are thus created from a variable selection of sites. The number of sites forming each observational annual mean value is indicated in the figure and it varies from just under 30 to more than 80. Although the precise location of the sites in the EACN and EMEP network are different we have minimised drifts in trends due to vastly different areal coverage of the monitoring data by only using observations from EMEP stations within countries with valid EACN data.
Fig. 5a. Trend in modelled (MATCH – red; EMEP – blue) and observed normalised nss-sulphate concentration in precipitation in Western Europe during 1955–2011 (left-hand scale). Precipitation-weighted annual mean concentrations of observational data (or model results) are normalised against the respective station’s (or grid cell’s) average during 1983–1990 before forming the Western European averages for each year. Yellow bars indicate number of stations used for forming annual value of observations (right hand scale). The model results are the average over 220 grid cells.
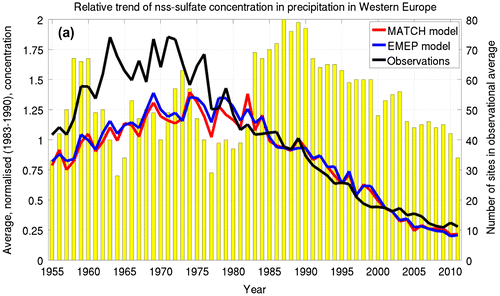
Fig. 5b. Same as Fig. , but for nitrate in precipitation and model results averaged over 214 sites.
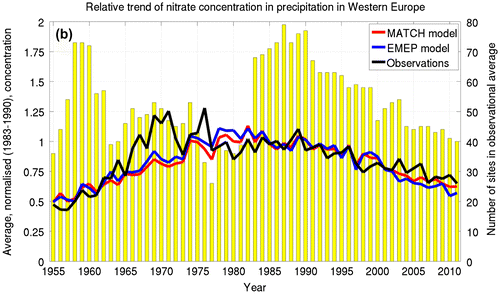
Fig. 5c. Same as Fig. , but for ammonium in precipitation and model results averaged over 207 sites.
The MATCH and EMEP models have very similar evolution of the normalised concentrations; which is unsurprising given that both models use the same emissions and meteorology. The inter-annual variability in the modelled data should, however, not be expected to follow the variations in the observations since the meteorology from the regional climate model is out of phase with the observed weather. There is reasonably good agreement between the modelled trends and the observations from the EMEP monitoring network (early 1970s and onwards) while, there are considerable differences between the observational data and the model results during the EACN period (1955 to early 1980s). Although a rigorous quality control was performed on the observational data prior to forming annual mean concentrations, it cannot be ruled out that some of the salient data are artefacts and do not represent the general concentration trends. A large uncertainty in the generation of normalised concentrations during the early period is the determination of the reference concentration. It is likely that some of the anomalous normalised concentrations during the EACN period can be attributed to incorrectly estimated reference concentrations. Keeping these uncertainties in mind we can still draw a number of important conclusions.
Nss-sulphate concentration in precipitation peaked earlier than nitrate and ammonium. The observational data indicate a broad maximum during ca. 1963–1972 while the model results reach their maximum values somewhat later, ca. 1969–1979. Observations and model results agree on the remarkable decrease of nss-sulphate in precipitation; both observations and model results suggest that concentrations around 2010 are less than 30% of the values in the mid–1950s. The observations show substantially higher average normalised nss-sulphate concentrations compared to the models during the period with EACN data. From Fig. and Table , it is however, clear that the two models simulate absolute concentrations of the same magnitude as the observations during 1958–1966 (no obvious under estimation – as may be inferred from Fig. ). The elevated normalised nss–sulphate concentrations of the observations during the EACN period may well be an artefact of the normalisation process – the result of too low reference concentrations for these stations. One likely cause would be if the regionally-representative EMEP observations were providing regional estimates that differed from those actually occurring at the location of the EACN stations. These findings are supported by the fact that time series of normalised concentrations of the EACN data and from the EMEP monitoring network showed distinctly different levels in many countries (not shown).
The maximum nitrate concentration in precipitation is reached around 1980 in the models. The observations reach their peak 5–10 years earlier, between 1969 and 1976. The maximum nitrate concentrations are at least a factor of two higher than the corresponding concentrations during the mid-1950s, indicating a greater increase than nss-sulphate over the same period. The subsequent decrease of the concentrations are, however, more modest than was the case for nss-sulphate. Nitrate concentrations in 2010 are slightly higher than during the mid-1950s. Observations and model results show similar features except for the high concentrations in some normalised observations during the late 1960s and mid-1970s.
The temporal evolution of ammonium in precipitation during the period 1955–2011 is less dramatic than for nss-sulphate and nitrate. Observations and model results both indicate that the post-1980 evolution has been characterised by only slowly decreasing ammonium concentrations. Ammonium concentrations across Europe in 2010 are similar or slightly higher than what they were in mid-1950s. During the latter part of the EACN period, the observational data seem to indicate a more pronounced increase than the model calculations. This steep rise in the observational data is preceded by a period of nearly constant ammonium concentrations during 1955–1970.
4.3 Comparison with ice core data 1850–2015
In Fig. , we compare the temporal development of modelled concentrations of nss-sulphate, nitrate and ammonium in precipitation to the trends of these ions in ice cores extracted from Colle Gnifetti, strategically located in the European Alps. From Fig. , it is clear that the concentration in the glacier ice is considerably lower than in the precipitation of the models for all three species, although both dry and wet depositions contribute to the ice core signal. Similarly low concentrations were observed in the ice core from Col du Dôme at 4250 m asl, Mt Blanc (Preunkert et al., Citation2001; Citation2003). The major reason for this is that high-alpine sites are often located in the free troposphere. For instance, at the atmospheric research station Jungfraujoch (3580 m asl), free tropospheric conditions prevailed about 39% of the time, with a maximum over 60% in winter and a minimum of about 20% in summer (Bukowiecki et al., Citation2016). In contrast, the models sample precipitation from a 50 km × 50 km grid cell which is typically set at much lower altitudes such that most pollutants are still available aloft to be rained out. Comparisons of ionic concentrations in rain samples from a low elevation site near Zurich to the Colle Gnifetti ice core data reveal typical differences of about a factor of 3–4 (Schwikowski and Eichler, Citation2010). Although, in principle, gas and aerosol concentrations could have been extracted from elevated layers in the model systems (as in Fagerli et al., Citation2007), neither model can account for sub-grid dry and wet deposition to high-alpine sites.
Fig. 6. Trends of 10-year average of (a) nss–sulphate, (b) nitrate and (c) ammonium extracted from the MATCH and EMEP model (left-hand scale) and in ice cores collected at Colle Gnifetti (right-hand scale). The modelled concentrations are precipitation-weighted mean concentrations over June–August in the gridcell encompassing Colle Gnifetti. The right-hand scale is consistently a factor of five smaller than the left-hand scale.
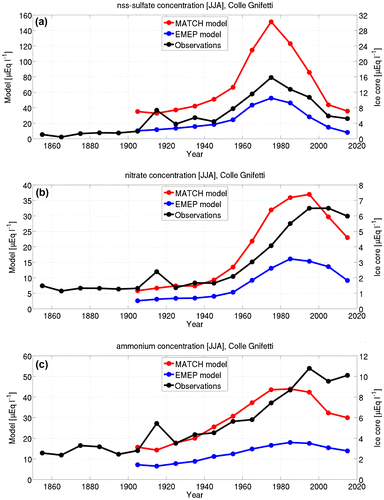
Figure also reveals large differences in absolute concentrations between the MATCH and EMEP models. MATCH is typically 2–3 times higher than the EMEP model at this particular grid cell, MATCH also features stronger decreases of the concentrations of all ions in recent decades compared to the EMEP model. Still, for nss-sulphate, the ice core data and the models agree in resolving the peak concentrations during the 1970s and the strong increase before and rapid decrease after this decade. Maximum nitrate concentrations in the ice core data occur 1–2 decades later than in the models and the concentrations remain elevated in the ice core even after 2000, which is not the case in the models. The concentration of ammonium in the ice core increase up to the 1990s and decrease only little after that decade. In the models there is a more pronounced decrease of ammonium concentrations starting after the 1980s. The present results are consistent with those presented by Fagerli et al. (Citation2007), where modelled summertime concentrations of ammonium at Col du Dôme level off after 1980, while ice core data show stabilisation or a weak increase after 1980. It is possible that non-linearities in ammonium formation and deposition (e.g. Fowler et al., Citation2007) (which can decrease the transport distance of reduced nitrogen as sulphur emissions are reduced) or changes in the relative partitioning between dry and wet deposition (Fricke and Beilke, Citation1992) explain some of the differences, which would be consistent with the somewhat flatter time profile in the EMEP model (which accounts for SO2/NH3 ratios in its deposition scheme) than in MATCH (which does not). However, other factors such as changes in Eastern or Western European emission sources not captured by the inventory may also play a role.
4.4 Deposition trend during 1850–2100 in EU28+
Figure shows the temporal evolution of nss-sulphur and nitrogen total (dry + wet) deposition to EU28+ over the period 1850 to 2100. The continuous time series from the present study are compared with results from the time slices simulated by the multi–model ensemble in Lamarque et al. (Citation2013). For nss–sulphur and oxidised nitrogen, our results compare well with Lamarque et al. (Citation2013), but the earlier study does not capture the peak in reduced nitrogen deposition that is apparent in the present study during the 1980s. It is also evident that the three RCP scenarios that Lamarque et al. (Citation2013) use for future air pollutant emissions result in considerably higher deposition of oxidised nitrogen than we achieve with our 2030 CLE scenario. The MATCH model and the Lamarque et al. (Citation2013) ensemble consistently feature larger total depositions to Europe than the EMEP model. MATCH and EMEP use the same emissions and the fact that less nss-sulphur and nitrogen is deposited within EU28+ by the EMEP model, means that the atmospheric life time of the considered sulphur and nitrogen containing species is longer in EMEP than in MATCH throughout the simulation period.
Fig. 7. Trends of the total deposition flux of sulphur and nitrogen to EU28+ (EU28+ Norway and Switzerland; area = 5.23 × 10¹² m2). Solid lines are from the present study, filled circles are from the global model ensemble in Lamarque et al. (Citation2013).
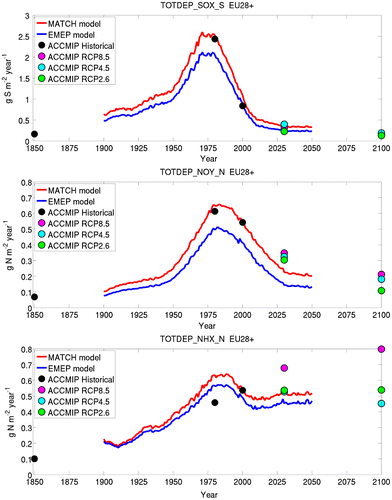
According to our estimates, sulphur deposition in EU28+ was already clearly elevated during the first decades of the twentieth century but it has now (mid-2010s) levelled off to ca. 70% of the values in 1900. Reduced nitrogen, on the other hand, features 2–2.5 times higher values today than during the early twentieth century. Reduced nitrogen deposition in EU28+ is also projected to remain elevated throughout the coming century – in stark contrast to the deposition of nss-sulphur and oxidised nitrogen which are both projected to continue decreasing until 2050 and beyond. Deposition of all species in EU28+ was at its highest around 1980, nss-sulphur deposition peaked ca. 10 years earlier and reduced nitrogen deposition peaked ca. 10 years later. Inter-annual variations due to changes in meteorology are largely suppressed when averaging the deposition flux over the whole EU28+ .
5. Discussion
The comparisons between model results and data from precipitation chemistry networks averaged over the 1958–1966 and 1983–1990 periods suggest that the models used in the present study – and their input data – are adequate to simulate the concentrations of nss-sulphur and nitrogen in European precipitation during historical periods. The models appear to reproduce concentrations in precipitation best during the earliest period, which may be related to the fact that during this period the observations were mainly concentrated on northern Europe, where emissions are better constrained than in other parts of Europe. The present findings are in line with a recent evaluation of the MATCH and EMEP models operating with meteorology from the same regional climate model, using nearly identical input data and model setups (Simpson et al., Citation2014). Due to lack of observations we have not evaluated atmospheric concentrations or dry deposition during the 1958–1966 and 1983–1990 periods, but Simpson et al. (Citation2014) concluded that the models did ‘a fair job of capturing SO2 and NO2 concentrations but results are mixed for the other components’.
The MATCH model’s overestimation of nss-sulphate concentrations compared to observations during both historical periods cannot simply be attributed to errors in the utilised emissions inventory or in the meteorology, as the EMEP model simulates nss-sulphate in precipitation very well using the same emissions and meteorological forcing. Likewise, the possible underestimation of nitrogen containing species in the EMEP model during both historical periods is contrasted by small or positive biases of these species in the MATCH model during the same periods. The differences in model results arise from different model formulations, and should be interpreted as a measure of uncertainty of the CTM simulations. From the model evaluation summarised in Table , it is not possible to judge which model is most accurately simulating the real world, although notable inter model differences occur. The MATCH model consistently simulates higher concentrations and depositions than the EMEP model. The differences in total deposition to EU28+ vary over time and species. For sulphur and oxidised nitrogen MATCH typically simulates 20–50% higher deposition than the EMEP model. For the deposition of reduced nitrogen the differences between the two models are smaller and do not exceed 20%. The difference at individual grid cells (e.g. concentration in precipitation Colle Gnifetti) can, however, be considerably larger.
The fact that annually-accumulated precipitation is overestimated in EU28+ in the meteorological data used by the two CTMs is not readily discernible in the evaluation of model performance. The absolute majority of the simulated concentrations are within a factor of two of the measurements and systematic concentration biases differ between the two investigated periods and between the two models – although the EMEP model does have an increased tendency for negative biases. The wet deposition is dependent on both the amount and frequency (not assessed) of precipitation. Assuming that it is mainly the amount that is biased in the RCA3 model, accurately simulated concentrations in precipitation imply that wet deposition will be overestimated in our models (less so in the EMEP model following the slight underestimation of concentrations). The total deposition is the sum of dry and wet deposition. A prominent feature of the atmospheric cycling of the species discussed in the present work is that their tropospheric life time is only a few days. As the dry and wet depositions are functions of the atmospheric concentrations of the respective species, increased (or decreased) wet deposition automatically results in decreased (or increased) dry deposition. Our estimations of total deposition flux to EU28+ consequently featured similar values as in a recent multi–model study (Lamarque et al., Citation2013). The partitioning between dry and wet deposition will, however, influence the atmospheric life time of the respective species – which eventually determines where the pollutants are deposited.
It is very unfortunate that the EACN and the EMEP network barely overlap in time. To a large extent the break between the operations of the two networks occurred at the same time as the annual trend of deposition of sulphur and nitrogen to Europe shifted from an increasing trend to a decreasing trend. The available data series are also often short and collected in different environments, which complicate the construction of harmonised and non-interrupted time series from the period with operational pan-European networks. By normalising all precipitation chemistry stations’ annual mean concentrations with our best estimate of their respective multi-year average concentration during a common reference period it was possible to construct time series of the observed evolution of sulphur and nitrogen in precipitation in Europe over the period 1955 to 2011. The normalised annual concentrations were used to test our models’ abilities to reproduce trends of nss-sulphate and nitrogen in precipitation. The method is subject to uncertainties in the estimation of the reference concentration, but makes it possible to incorporate data from short series and to form areal averages over regions encompassing both high and low concentrations. The uncertainties are particularly large for the EACN data, were the reference concentrations had to be determined from analysed fields based on observed concentrations not collected at the locations of the EACN stations. From our analysis it appears likely that the normalised nss-sulphate concentration during the EACN period is elevated because of too low reference concentrations, indicating that the EACN stations may have been affected by local pollution. For nitrate and ammonium, there may additionally be problems associated with occasional unrepresentative data, as evident from the unexpected large year-to-year variability of the observed concentrations during the EACN period.
The comparison of modelled concentration in precipitation with data extracted from an ice core collected at a high-altitude site in the European Alps reveals clear differences in the trend of nitrogen containing species since the 1980s, while both models match the evolution of nss-sulphate in the ice core over the period 1900 to 2015. The evolution of nitrogen in the ice core is also not in line with trends from the EMEP precipitation chemistry network in Western Europe (Figs. ; see also Fagerli and Aas, Citation2008), which suggest monotonic decreases of nitrate and ammonium in precipitation from the 1980s and onwards. The excellent correlation between data extracted from ice core collected at different locations in the Alps (Col du Dôme and Colle Gniffetti; Wagenbach et al., Citation2012) clearly shows that the deviating trends cannot be explained by local pollution but has to be sought in the European emissions data or the models’ representation of the wet deposition to an high elevation site.
Although not specifically addressed in the present study, changes in climate and hemispheric boundary concentrations do affect the levels of nss-sulphur and nitrogen deposition in Europe, but this effect is generally smaller than the effect of internal emissions (e.g. Engardt and Langner, Citation2013; Simpson et al., Citation2014). Strong year-to-year variations also occur, but they are linked to variations in the meteorological conditions (Andersson et al., Citation2007; Fagerli et al., Citation2007). The calculated total deposition to Europe is thus to a very large degree determined by the assumed emissions rather than which meteorological and boundary data has been used. However, as demonstrated in this work, identical forcings still generate somewhat different depositions from two CTMs; the span in results provides an indication of the uncertainty of such models. On top of ambiguities in model formulation, uncertainties in the input data are also important to consider. As shown in Reis et al. (Citation2009) and Granier et al. (Citation2011), emission estimates for even well-studied regions such as the European Union and for current years can differ substantially. Emission estimates over the course of the twentieth century are clearly uncertain, as discussed in detail in e.g. van Aardenne et al. (Citation2001) or Vestreng et al. (Citation2009). Future emission estimates are of course only scenarios, or the consequences of decided emission reductions, rather than likely forecasts of future emissions. There are indeed many additional complexities in the emissions, transport and deposition processes of sulphur and nitrogen compounds that we have not accounted for in the present modelling study, including for example emissions of NO from soils and lightning, or bi-directional exchange of nitrogen compounds (Massad et al., Citation2010; Zaehle et al., Citation2010; Hertel et al., Citation2012). Some authors (e.g. Fricke and Beilke, Citation1992) have reported large changes in the relative proportions of dry and wet deposition of sulphur during the 1980s and future studies of deposition trends in Europe should clearly try to understand and resolve these, and similar, non-linearities in the atmospheric cycling of sulphur and nitrogen. All such processes would certainly affect the model results to some extent, but the satisfactory agreement of modelled and observed sulphur and nitrogen containing species found in this and earlier studies with our models suggest that the main emission–deposition relationships are captured to an acceptable degree, and gives some confidence in the model’s abilities to provide long-term air pollution inputs to ecosystem models.
6. Conclusions
We have created internally consistent sets of gridded, monthly accumulated, dry and wet deposition of major ions to Europe covering the period 1900–2050. The data, intended as input to ecosystem models (e.g. Franz et al., Citation2017; De Vries et al., Citation2017), were generated by running two different CTMs accounting for identical changes in European anthropogenic air pollutant emissions, climate and hemispheric background concentrations of relevant atmospheric species. The deposition data, together with gridded meteorological information are particularly well suited for effect modellers to study the consequences of sulphur and nitrogen deposition to European ecosystems.
The results of the two CTM simulations differed due to inter-model differences but the general features in terms of deposition trends were similar from both models. The similarity of the model results stem from the fact that emission changes dominate over uncertainties in the models’ parameterisations and that the models used identical emissions and meteorological data for these runs.
Given the unavoidable uncertainties in the historical inputs to our simulations, we have invested considerable effort in the harmonisation of a unique historical data-set, that of the European Air Chemistry Network (EACN) in operation from 1955 to the early 1980s. Data from more than 100 EACN stations have been merged with more recent data from the EMEP (European Monitoring and Evaluation Programme) monitoring network to construct quality controlled harmonised series of observed concentration of major ions in precipitation from 1955 through 2011. Comparing the model results with observations of precipitation chemistry data from this data-set show broad agreement, especially when considering the large uncertainties in both the quality and representativeness of the observations – and all underlying assumptions of the modelling and its input (especially emissions) data. Other studies (Engardt and Langner, Citation2013; Simpson et al., Citation2014) have previously demonstrated the MATCH and EMEP models’ abilities to reproduce the present cycling of sulphur and nitrogen across Europe using similar setups and input data as in the present study.
Comparison of the modelled evolution of concentration in precipitation with observations collected across Western Europe during 1955–2011 was more favourable during the period with data from the EMEP monitoring network than with the, earlier, EACN period, but methodological issues explain some of the difficulties. For nss-sulphate, problems are mainly associated with difficulties assigning correct concentrations to EACN sampling sites during our chosen reference period (1983–1990). Using interpolated data from the EMEP observational network likely underestimates the concentrations at the EACN stations, which leads to an overestimation of the normalised concentration during the EACN period. For the nitrogen components, with large year-to-year variability in normalised concentrations during the EACN period, we cannot rule out imperfections in our method of combining different intermittent series to a single Western Europe series. There is clearly scope for returning to the EACN and later data to find better ways to assess trends in observed deposition of major ions to Europe.
A comparison of the model results with ice core data covering the period 1900–2015 showed reasonable correspondence for nss-sulphate trend, but featured prominent differences for nitrate and ammonium concentrations. The differences occurred during recent decades with the ice core data showing persistently high concentrations where the models instead indicate decreasing concentrations. The elevated nitrate and ammonium concentrations in the ice core is also not reproduced in the EMEP monitoring data averaged over more than 60 sites in Western Europe.
Our modelled historical deposition fluxes averaged over EU28+ compare well with Lamarque et al. (Citation2013) but for the future periods it is clear that tracer emissions from any of the RCP scenarios used by Lamarque et al. (Citation2013) result in higher nitrogen deposition to Europe than the CLE scenario we have utilised in the present study.
This study concludes that nss-sulphate deposition to Europe was already clearly elevated in the year 1900, but has now (mid-2010s) decreased to about 70% of what it was at the beginning of the last century. According to our results, sulphur deposition in Europe will continue to decrease until, at least, 2050. The deposition of oxidised nitrogen to Europe peaked during the 1980s but has since decreased to half of its maximum value; still it is 3–4 times higher than in the year 1900. The annual deposition of reduced nitrogen to Europe is currently more than two times as high as the conditions in the year 1900. In our simulations it is projected to remain at these elevated levels during the foreseeable decades.
The modelling and observational precipitation chemistry data discussed in the present paper are available on request from the authors.
Supplemental Material
Supplemental data for this article can be accessed here https://doi.org/10.1080/16000889.2017.1328945
Disclosure statement
No potential conflict of interest was reported by the authors.
Funding
This work was funded by the EU FP7 projects ECLAIRE [Project number 282910] and PEGASOS [Project number 265148], the Nordic Council of Ministers EnsClim project, and the Swedish EPA under the CLEO programme (Climate Change and Environmental Objectives), as well as EMEP under UN-ECE. Computer time for EMEP model runs was supported by the Research Council of Norway (Programme for Supercomputing).
Supplementary Material
Download PDF (1.7 MB)Acknowledgements
Thanks are due to Chris Heyes and Zig Klimont, IIASA for provision of additional data within the ECLAIRE emissions databases. The work is also intended as a contribution to the Swedish Climate Modelling Research Project MERGE.
References
- Amann, M., Bertok, I., Borken-Kleefeld, J., Cofala, J., Heyes, C. and co-authors. 2011. Cost-effective control of air quality and greenhouse gases in Europe: Modeling and policy applications. Environ. Model. Softw. 26, 1489–1501. DOI:10.1016/j.envsoft.2011.07.012.
- Amann, M., Klimont, Z. and Wagner, F. 2013. Regional and global emissions of air pollutants: Recent trends and future scenarios. Annu. Rev. Environ. Resour. 38, 31–55.10.1146/annurev-environ-052912-173303
- Andersson, C., Langner, J. and Bergström, R. 2007. Interannual variation and trends in air pollution over Europe due to climate variability during 1958–2001 simulated with a regional CTM coupled to the ERA40 reanalysis. Tellus 59, 77–98. DOI:10.1111/j.1600-0889.2006.00196.x.
- Andersson-Sköld, Y. and Simpson, D. 1999. Comparison of the chemical schemes of the EMEP MSC-W and the IVL photochemical trajectory models. Atmos. Environ. 33, 1111–1129.
- Anonymous. 1960. Current data on the chemical composition of air and precipitation. Tellus 11, 366–371.
- Arneth, A., Niinemets, Ü., Pressley, S., Bäck, J., Hari, P. and co-authors. 2007. Process-based estimates of terrestrial ecosystem isoprene emissions: incorporating the effects of a direct CO2-isoprene interaction. Atmos. Chem. Phys. 7, 31–53. DOI:10.5194/acp-7-31-2007.
- Best, M. J., Pryor, M., Clark, D. B., Rooney, G. G., Essery, R. L. H. and co-authors. 2011. The joint UK land environment simulator (JULES), model description – Part 1: Energy and water fluxes. Geosci. Model Dev. 4, 677–699. DOI:10.5194/gmd-4-677-2011.
- Brimblecombe, P. and Stedman, D. H. 1982. Historical evidence for a dramatic increase in the nitrate component of acid rain. Nature 298, 460–462.10.1038/298460a0
- Bukowiecki, N., Weingartner, E., Gysel, M., Coen, M. C., Zieger, P. and co-authors. 2016. A review of more than 20 years of aerosol observation at the high altitude research station Jungfraujoch, Switzerland (3580 m asl). Aerosol Air Qual. Res. 16, 764–788. DOI:10.4209/aaqr.2015.05.0305.
- Claremar, B., Wällstedt, T., Rutgersson, A. and Omstedt, A. 2013. Deposition of acidifying and neutralising compounds over the Baltic Sea drainage basin between 1960 and 2006. Boreal Environ. Res. 18, 425–445.
- De Vries, W., Posch, M., Simpson, D. and Reinds, G. J. 2017. Modelling long-term impacts of changes in climate, nitrogen deposition and ozone exposure on carbon sequestration of European forest ecosystems. Sci. Total Environ.
- Egnér, H. and Eriksson, E. 1955. Current data on the chemical composition of air and precipitation. Note. Tellus 7, 134–139.
- Engardt, M. and Langner, J. 2013. Simulations of future sulphur and nitrogen deposition over Europe using meteorological data from three regional climate projections. Tellus 65, 20348. DOI:10.3402/tellusb.v65i0.20348.
- Fagerli, H. and Aas, W. 2008. Trends of nitrogen in air and precipitation: Model results and observations at EMEP sites in Europe 1980-2003. Environ. Poll. 154, 448–461. DOI:10.1016/j.envpol.2008.01.024.
- Fagerli, H., Legrand, M., Preunkert, S., Vestreng, V., Simpson, D. and co-authors. 2007. Modeling historical long-term trends of sulfate, ammonium, and elemental carbon over Europe: A comparison with ice core records in the Alps. J. Geophys. Res. 112, D23S13. DOI:10.1029/2006JD008044.
- Fenger, J. 2009. Air pollution in the last 50 years – From local to global. Atmos. Environ. 43, 13–22. DOI:10.1016/j.atmosenv.2008.09.061.
- Fowler, D., Coyle, M., Skiba, U., Sutton, M. A., Cape, J. N. and co-authors. 2013. The global nitrogen cycle in the twenty-first century. Phil. Trans. R. Soc. B 368, 20130164. DOI:10.1098/rstb.2013.0164.
- Fowler, D., O’Donoghue, M., Muller, J., Smith, R., Dragosits, U. and co-authors. 2004. A chronology of nitrogen deposition in the UK between 1900 and 2000. Water Air Soil Pollut. Focus 4, 9–23.10.1007/s11267-004-3009-1
- Fowler, D., Smith, R., Muller, J., Cape, J., Sutton, M. and co-authors. 2007. Long term trends in sulphur and nitrogen deposition in Europe and the cause of non-linearities. Water Air Soil Pollut. Focus 7, 41–47.10.1007/s11267-006-9102-x
- Franz, M., Simpson, D., Arneth, A. and Zaehle, S. 2017. Development and evaluation of an ozone deposition scheme for coupling to a terrestrial biosphere model. Biogeosciences 14, 45–71.10.5194/bg-14-45-2017
- Fricke, W. and Beilke, S. 1992. Indications for changing deposition patterns in central Europe. Environ. Poll. 75, 121–127.10.1016/0269-7491(92)90031-5
- Galloway, J., Dentener, F., Capone, D., Boyer, E., Howarth, R. and co-authors. 2004. Nitrogen cycles: Past, present, and future. Biogeochemistry 70, 153–226.10.1007/s10533-004-0370-0
- Granat, L. 1972. Deposition of sulfate and acid with precipitation over Northern Europe, Report AC-20. Department of Meteorology, University of Stockholm, 30 pp.
- Granat, L. 1975. On the variability of rain water composition and errors in estimates of areal wet deposition, Report AC-30. Department of Meteorology, University of Stockholm, 31 pp.
- Granat, L. 1978. Sulfate in precipitation as observed by the European atmospheric chemistry network. Atmos. Environ. 12, 413–424.10.1016/0004-6981(78)90225-1
- Granat, L. 1991. Luft- och nederbördskemiska stationsnätet inom PMK. Rapport från verksamheteten 1990. Rapport 3942. ISBN 91-620-3942-3, Swedish Environmental Protection Agency. (In Swedish, abstract also in English).
- Granat, L. 2010. Documentation of sampling, analysis and data within the European Atmospheric Chemistry Network (EACN) with special emphasis on chemical composition of precipitation. CD available from the Swedish Environmental Protection Agency.
- Granier, C., Bessagnet, B., Bond, T., D’Angiola, A., van der Gon, H. D. and co-authors. 2011. Evolution of anthropogenic and biomass burning emissions of air pollutants at global and regional scales during the 1980–2010 period. Clim. Change 109, 163–190. DOI:10.1007/s10584-011-0154-1.
- Grennfelt, P. and Hov, O. 2005. Regional air pollution at a turning point. Ambio 34, 2–10.10.1579/0044-7447-34.1.2
- Hansen, K., Pihl Karlsson, G., Ferm, M., Karlsson, P. E., Bennet, C. and co-authors. 2013. Trender i kvävenedfall över Sverige 1955–2011. IVL Rapport B 2119, 86 pp (In Swedish, abstract also in English).
- Harris, I., Jones, P. D., Osborn, T. J. and Lister, D. H. 2014. Updated high-resolution grids of monthly climatic observations – the CRU TS3.10 Dataset. Int. J. Climatol. 34, 623–642. DOI:10.1002/joc.3711.
- Hertel, O., Skjøth, C. A., Reis, S., Bleeker, A., Harrison, R. M. and co-authors. 2012. Governing processes for reactive nitrogen compounds in the European atmosphere. Biogeosciences 9, 4921–4954. DOI:10.5194/bg-9-4921-2012.
- Hijioka, Y., Matsuoka, Y., Nishimoto, H., Masui, M. and Kainuma, M. 2008. Global GHG emissions scenarios under GHG concentration stabilization targets. J. Global Environ. Eng. 13, 97–108.
- Jenk, T. M., Szidat, S., Bolius, D., Sigl, M., Gäggeler, H. W. and co-authors. 2009. A novel radiocarbon dating technique applied to an ice core from the Alps indicating late Pleistocene ages. J. Geophys. Res. 114, D14305. DOI:10.1029/2009JD011860.
- Kallend, A. S., Marsh, A. R. W., Pickles, J. H. and Proctor, M. V. 1983. Acidity of rain in Europe. Atmos. Environ. 17, 127–137.10.1016/0004-6981(83)90017-3
- Kjellström, E., Nikulin, G., Hansson, U., Strandberg, G. and Ullerstig, A. 2011. 21st century changes in the European climate: uncertainties derived from an ensemble of regional climate model simulations. Tellus 63, 24–40. DOI:10.1111/j.1600-0870.2010.00475x.
- Kuenen, J., Denier van der Gon, H., Visschedijk, A., van der Brugh, H. and van Gijlswijk, R. 2011. MACC European emission inventory for the years 2003–2007. TNO, Utrecht, The Netherlands. Online at: http://www.tno.nl
- Kuenen, J. J. P., Visschedijk, A. J. H., Jozwicka, M. and Denier van der Gon, H. A. C. 2014. TNO-MACC_II emission inventory, a multi-year (2003–2009) consistent high-resolution European emission inventory for air quality modelling. Atmos. Chem. Phys. 14, 10963–10976.10.5194/acp-14-10963-2014
- Lamarque, J.-F., Bond, T. C., Eyring, V., Granier, C., Heil, A. and co-authors. 2010. Historical (1850–2000) gridded anthropogenic and biomass burning emissions of reactive gases and aerosols: methodology and application. Atmos. Chem. Phys. 10, 7017–7039. DOI:10.5194/acp-10-7017-2010.
- Lamarque, J.-F., Dentener, F., McConnell, J., Ro, C.-U., Shaw, M. and co-authors. 2013. Multi-model mean nitrogen and sulfur deposition from the Atmospheric Chemistry and Climate Model Intercomparison Project (ACCMIP): evaluation of historical and projected future changes. Atmos. Chem. Phys. 13, 7997–8018. DOI:10.5194/acp-13-7997-2013.
- Langner, J., Engardt, M., Baklanov, A., Christensen, J. H., Gauss, M. and co-authors. 2012. A multi-model study of impacts of climate change on surface ozone in Europe. Atmos. Chem. Phys. 12, 10423–10440. DOI:10.5194/acp-12-10423-2012.
- Mareckova, K., Wankmuller, R., Pinterits, M. and Moosman, L. 2013. Review of emission data reported under the LRTAP convention and NEC directive, stage 1 and 2 review status of gridded and LPS data. EMEP/CEIP technical report 1/2013, EEA/CEIP Vienna, 2013. Online at: http://www.emep.int
- Massad, R.-S., Nemitz, E. and Sutton, M. A. 2010. Review and parameterisation of bi-directional ammonia exchange between vegetation and the atmosphere. Atmos. Chem. Phys. 10, 10359–10386. DOI:10.5194/acp-10-10359-2010.
- Miller, N. H. J. 1905. The amounts of nitrogen as ammonia and as nitric acid and chlorine in the rainwater collected at Rothamsted. J. Agri. Sci. 1, 280–303.10.1017/S0021859600000320
- Mylona, S. 1996. Sulphur dioxide emissions in Europe 1880–1991 and their effect on sulphur concentrations and depositions. Tellus 48, 662–689.10.3402/tellusb.v48i5.15939
- Odén, S. 1968.The acidification of air and precipitation and its consequences in the natural environment. Ecology Committee Bulletin No.1. Swedish National Science Research Council, Stockholm, Translation Consultants Ltd, Arlington, VA. TR-1172 (in Swedish).
- Preunkert, S., Legrand, M. and Wagenbach, D. 2001. Sulfate trends in a Col du Dome (French Alps) ice core: A record of anthropogenic sulfate levels in the European midtroposphere over the twentieth century. J. Geophys. Res. 106, 31991–32004. DOI:10.1029/2001JD000792.
- Preunkert, S., Wagenbach, D. and Legrand, M. 2003. A seasonally resolved alpine ice core record of nitrate: Comparison with anthropogenic inventories and estimation of preindustrial emissions of NO in Europe. J. Geophys. Res. 108, 4681. DOI:10.1029/2003JD003475.
- Reis, S., Grennfelt, P., Klimont, Z., Amann, M., ApSimon, H. and co-authors. 2012. From acid rain to climate change. Science 338, 1153–1154. DOI:10.1126/science.1226514.
- Reis, S., Pinder, R. W., Zhang, M., Lijie, G. and Sutton, M. A. 2009. Reactive nitrogen in atmospheric emission inventories. Atmos. Chem. Phys. 9, 7657–7677. DOI:10.5194/acp-9-7657-2009.
- Rodhe, H. and Granat, L. 1984. An evaluation of sulfate in European precipitation 1955–1982. Atmos. Environ. 18, 2627–2639.10.1016/0004-6981(84)90327-5
- Rodhe, H. and Rood, M. J. 1986. Temporal evolution of nitrogen compounds in Swedish precipitation since 1955. Nature 321, 762–764.10.1038/321762a0
- Ruoho-Airola, T., Eilola, K., Savchuk, O. P., Parviainen, M. and Tarvainen, V. 2012. Atmospheric nutrient input to the Baltic sea from 1850 to 2006: A reconstruction from modeling results and historical data. Ambio 41, 549–557. DOI:10.1007/s13280-012-0319-9.
- Russell, E. J. and Richards, E. H. 1919. The amounts and composition of rain and snow falling at Rothamsted. J. Agri. Sci. 9, 309–337.10.1017/S0021859600005207
- Samuelsson, P., Jones, C. G., Willén, U., Ullerstig, A., Gollvik, S. and co-authors. 2011. The Rossby Centre Regional Climate model RCA3: model description and performance. Tellus 63, 4–23. DOI:10.1111/j.1600-0870.2010.00478.x.
- Sanderson, M., Dentener, F., Fiore, A., Cuvelier, C., Keating, T. and co-authors. 2008. Multi-model study of the hemispheric transport and deposition of oxidised nitrogen. Geophys. Res. Lett. 35, 635. DOI:10.1029/2008GL035389.
- Schwikowski, M. and Eichler, A. 2010. Alpine glaciers as archives of atmospheric deposition. In: Handbook of Environmental Chemistry Volume 6 Series Water Pollution: ‘Alpine Waters’ Aspects of Mountain Waters, illustrated on the example of Alpine Waters (ed. U. Bundi). Springer-Verlag, Berlin Heidelberg, pp. 141–150.
- Schöpp, W., Posch, M., Mylona, S. and Johansson, M. 2003. Long-term development of acid deposition (1880-2030) in sensitive freshwater regions in Europe. Hydrol. Earth Syst. Sci. 7, 436–446. DOI:10.5194/hess-7-436-2003.
- Simpson, D., Andersson, C., Christensen, J. H., Engardt, M., Geels, C. and co-authors. 2014. Impacts of climate and emission changes on nitrogen deposition in Europe: a multi-model study. Atmos. Chem. Phys. 14, 6995–7017. DOI:10.5194/acp-14-6995-2014.
- Simpson, D., Benedictow, A., Berge, H., Bergström, R., Emberson, L. D. and co-authors. 2012. The EMEP MSC-W chemical transport model – technical description. Atmos. Chem. Phys. 12, 7825–7865. DOI:10.5194/acp-12-7825-2012.
- Simpson, D., Butterbach-Bahl, K., Fagerli, H., Kesik, M., Skiba, U. and co-authors. 2006a. Deposition and emissions of reactive nitrogen over European forests: A modelling study. Atmos. Environ. 40, 5712–5726. DOI:10.1016/j.atmosenv.2006.04.063.
- Simpson, D., Fagerli, H., Hellsten, S., Knulst, J. and Westling, O. 2006b. Comparison of modelled and monitored deposition fluxes of sulphur and nitrogen to ICP-forest sites in Europe. Biogeosciences 3, 337–355.10.5194/bg-3-337-2006
- Simpson, D., Winiwarter, W., Börjesson, G., Cinderby, S., Ferreiro, A. and co-authors. 1999. Inventorying emissions from nature in Europe. J. Geophys. Res. 104, 8113–8152.10.1029/98JD02747
- Skjøth, C. A. and Geels, C. 2013. The effect of climate and climate change on ammonia emissions in Europe. Atmos. Chem. Phys. 13, 117–128. DOI:10.5194/acp-13-117-2013.
- Smith, B., Prentice, I. C. and Sykes, M. T. 2001. Representation of vegetation dynamics in the modelling of terrestrial ecosystems: comparing two contrasting approaches within European climate space. Glob. Ecol. Biogeogr. 10, 621–637. DOI:10.1046/j.1466-822X.2001.t01-1-00256.x.
- Stohl, A., Aamaas, B., Amann, M., Baker, L. H., Bellouin, N. and co-authors. 2015. Evaluating the climate and air quality impacts of short-lived pollutants. Atmos. Chem. Phys. 15, 10529–10566. DOI:10.5194/acp-15-10529-2015.
- Sutton, M. A., Reis, S., Riddick, S. N., Dragosits, U., Nemitz, E. and co-auhors. 2013. Towards a climate-dependent paradigm of ammonia emission and deposition. Phil. Trans. R. Soc. B 368, 20130166. DOI:10.1098/rstb.2013.0166.
- Tuovinen, J.-P., Hakola, H., Karlsson, P.E. and Simpson, D. 2013. Air pollution risks to Northern European forests in a changing climate. In: Climate Change, Air Pollution and Global Challenges Understanding and Perspectives from Forest Research (eds. R. Matyssek, N. Clarke, P. Cudlin, T. Mikkelsen, J. Tuovinen, G. Wieser and E. Paoletti) Vol. 13 of Developments in Environmental Science, chap. 5, Elsevier, Oxford, UK, pp. 77–99. DOI:10.1016/B978-0-08-098349-3.00005-0.
- Tørseth, K., Aas, W., Breivik, K., Fjæraa, A. M., Fiebig, M. and co-authors. 2012. Introduction to the European Monitoring and Evaluation Programme (EMEP) and observed atmospheric composition change during 1972–2009. Atmos. Chem. Phys. 12, 5447–5481. DOI:10.5194/acp-12-5447-2012.
- van Aardenne, J. A., Dentener, F. J., Olivier, J. G. J., Goldewijk, C. G. M. K. and Lelieveld, J. A. 2001. 1°×1° resolution data set of historical anthropogenic trace gas emissions for the period 1890–1990. Global Biogeochem. Cycles 15, 909–928.10.1029/2000GB001265
- van Vuuren, D. P., Edmonds, J., Kainuma, M., Riahi, K., Thomson, A. and co-authors. 2011. The representative concentration pathways: an overview. Clim. Change 109, 5–31. DOI:10.1007/s10584-011-0148-z.
- Vestreng, V., Ntziachristos, L., Semb, A., Reis, S., Isaksen, I. S. A. and co-authors. 2009. Evolution of NOx emissions in Europe with focus on road transport control measures. Atmos. Chem. Phys. 9, 1503–1520.10.5194/acp-9-1503-2009
- Wagenbach, D., Bohleber, P. and Preunkert, S. 2012. Cold, alpine ice bodies revisited: what may we learn from their impurity and isotope content? Geografiska Annaler: Series A, Phys. Geogr. 94, 245–263. DOI:10.1111/j.1468-0459.2012.00461.x.
- Wild, O., Fiore, A. M., Shindell, D. T., Doherty, R. M., Collins, W. J. and co-authors. 2012. Modelling future changes in surface ozone: a parameterized approach. Atmos. Chem. Phys. 12, 2037–2054. DOI:10.5194/acp-12-2037-2012.
- Zaehle, S., Friend, A. D., Friedlingstein, P., Dentener, F., Peylin, P. and co-authors. 2010. Carbon and nitrogen cycle dynamics in the O–CN land surface model: 2. Role of the nitrogen cycle in the historical terrestrial carbon balance. Global Biogeochem. Cycles 24, GB1006. DOI:10.1029/2009GB003522.