Abstract
Severe haze events and their radiation feedbacks exert a profound impact on the weather and tropospheric chemistry. Using the on-line-coupled Weather Research and Forecasting with Chemistry (WRF-Chem) model, this study investigates the impacts of direct aerosol-radiation feedbacks on local air quality (i.e. particulate matter and ozone photochemistry) during a severe autumn haze episode in Nanjing megacity, eastern China. Pronounced radiation feedbacks are found for the predictions of meteorological and chemical variables. In response to the negative radiative forcing of scattering-dominant anthropogenic haze aerosols, the instantaneous irradiance and temperature at the surface lower by 130 W m−2 and 1.1–1.4 °C, respectively, leading to a reduction of boundary layer height by 103.2–232.6 m (11–38%) and vertical wind speed by 0.1–0.8 mm s−1 (2–30% at mid-day) during this haze event. Such a stable atmosphere favours the accumulation of fine particles (30.5 μg m−3, 28.7%) and NO2 (6.0 ppb, 23.7%) in the urban pollution plume. The weaker turbulent mixing and photochemical activity associated with the enhanced titration loss, and reduced downward radiation and photolysis rate result in a 0.1−5.0 ppb (12.0%) reduction of near-surface ozone. The simulations highlight that the aerosol-radiation feedbacks play an important role in the atmospheric transport and chemistry of large urban pollution plumes.
1. Introduction
Atmospheric aerosols with diameters larger than 50–100 nm could affect the earth’s radiation balance by directly scattering (e.g. sulphate and nitrate) or absorbing (e.g. dust and black carbon) solar radiation (‘direct radiative effect’) (Charlson et al., Citation1992), and by indirectly altering the cloud optical properties and lifetime through acting as cloud condensation nuclei (‘indirect radiative effect’) (Twomey, Citation1974).
The aerosol–radiation interactions have substantial effects on meteorology and air quality, which has caused wide-spread concern recently. Aerosol-induced decreases in downward solar radiation have been observed in field experiments (e.g. Leiterer et al. (Citation1997) in Germany and Russia, Kanaya et al. (Citation2003) at Rishiri Island and Michalsky et al. (Citation2006) in Oklahoma) or through analysis of long-term ground and satellite observational data (Lee et al., Citation2005; Hatzianastassiou et al., Citation2007; Han et al., Citation2012). During strong air pollution episodes such as wild fire (Makar et al., Citation2010; Grell et al., Citation2011; Jiang et al., Citation2012) or dust events (Liu et al., Citation2016), it is calculated that aerosols reduced the shortwave radiation and temperature at the surface, and heated the atmosphere at the top of planetary boundary layer (PBL). Recent modelling studies (Gao et al., Citation2015; Wang et al., Citation2015; Gao et al., Citation2016) also highlighted that the negative radiative forcing of anthropogenic haze aerosols induced a reduction of shortwave radiation by 20–25% over the North China Plain (NCP), with a decrease in surface temperature (0.6–2.8 °C), wind speed (20–60%) and PBL height (5–30%).
The radiation feedbacks between aerosols and weather processes are critical to the transport and atmospheric chemistry of air pollutants (Forkel et al., Citation2012; Jiang et al., Citation2012; Makar, Gong, Hogrefe et al., Citation2015; Liu et al., Citation2016), such as particulate matter and ozone (O3) – two key environmental problems in megacities. Historically, traditional ‘off-line’ modelling systems in which weather and chemistry forecasts are loosely coupled were used to study the aerosol impacts. For example, using 1D radiation transfer models, numerous studies evaluated the aerosol effects on photolysis and ozone productivity in the atmosphere (Dickerson et al., Citation1997; Jacobson, Citation1998; He and Carmichael, Citation1999; Liao et al., Citation1999). They concluded that scattering aerosols accelerated photolysis by 11–18%, and absorbing aerosols inhibited smog production by 6–11%. Using a regional chemical transport model coupled with radiative transfer module, Tang et al. (Citation2003) estimated that aerosols increased the NOx concentration by 40% in urban plumes via reducing its photolytic loss. Martin et al. (Citation2003) also found a reduction in surface O3 photolysis frequency by 5–15% due to the aerosol effects throughout most of the Northern Hemisphere.
However, the neglect of aerosol-chemistry feedbacks in off-line models is expected to cause noticeable biases in both meteorological and chemical forecasts (Jacobson, Citation1997; Wong et al., Citation2012; Kong et al., Citation2015; Makar, Gong, Hogrefe et al., Citation2015; Makar, Gong, Milbrandt et al., Citation2015). Jacobson (Citation1997) was first to develop a fully-coupled on-line model to account for the radiation feedback of size-resolved aerosols on photolysis and temperature profiles. They found that aerosols reduced solar radiation and ozone mixing ratio in Los Angeles by 6.4 and 2%, respectively (Jacobson, Citation1997, Citation1998). Since then, numerous new generations of on-line-coupled models have been developed worldwide, such as Multiscale Climate Chemistry Model (MCCM) (Grell et al., Citation2000), Weather Research and Forecasting-Chemistry (WRF-Chem) (Grell et al., Citation2005) and Global Environmental Multi-scale-Modeling Air quality and CHemistry (GEM-MACH) (Moran et al., Citation2010). These models have been widely used for Europe and North America and they found that the interactions between meteorology and chemistry can be significant during strong air pollution episodes (Grell et al., Citation2011; Konovalov et al., Citation2011; Wong et al., Citation2012; Chen et al., Citation2014; Kong et al., Citation2015; Liu et al., Citation2016).
Since 2000, an increasing trend of haze days in China at a rate of 38.4 days/decade has been observed by meteorological records (Qu et al., Citation2015; Su et al., Citation2015) and satellite data (Tao et al., Citation2016), to maintain a high level of 70–90 days per year by now. The deteriorated haze pollution was related to the increase in anthropogenic emissions (Qu et al. Citation2015) and the variations in atmospheric circulations (Hui and Xiang, Citation2015; Li et al., Citation2016). These haze layers could spread across northern and eastern China and persist over a week during autumn and winter, inducing elevated PM2.5 concentration exceeding 500 μg m−3 and instantaneous visibility degradation to less than 200 m (Huang et al., Citation2011; CitationLi, Zhou et al., 2011). The tremendous aerosol loading arising from frequent haze events exerted a profound impact on the radiation balance and weather in eastern China (Liang and Xia, Citation2005; Liu et al., Citation2007; Gao et al., Citation2015). Nevertheless, the radiation feedbacks between anthropogenic aerosols and atmospheric chemistry during haze events have rarely been intensively resolved, which are expected to be significant in the vicinity of major cities. Nanjing City, located in the north-west of Yangtze River Delta (YRD), is the second largest centre of economy and culture in East China after Shanghai. It has a population of around 6.5 million and a total area of 6509 square kilometres. The annual occurrence of haze days in Nanjing has been increasing (42.9 days/decade) (Su et al., Citation2015), posing a potential influence on local meteorology and air quality.
This study attempts to assess the direct aerosol-radiation feedbacks on local air quality for a severe haze event (15–17 October 2015) in Nanjing megacity, using the on-line-coupled WRF-Chem model. The model set-up and experimental designs are presented in Section 2. Section 3 discusses the aerosol impacts on radiation balance, PBL meteorology and local air quality. Finally, a summary is presented in Section 4.
2. Model set-up and experimental designs
2.1. WRF-Chem model descriptions
The WRF-Chem model developed by Grell et al. (Citation2002) represents the state-of-the science treatments of coupled meteorology/chemistry/aerosol/radiation. This study uses WRF-Chem version 3.7 to simulate the aerosol-radiation-chemistry feedbacks. It is configured with four nested grids, with horizontal resolutions of 81, 27, 9 and 3 km, and grids of 87 × 74, 84 × 69, 69 × 63 and 54 × 60 (Fig. ). There are 21 vertical layers from the ground to 100 hPa, with eight layers located below 1 km to resolve the boundary layer processes.
Fig. 1. (a) WRF-Chem domains and terrain height (m); (b) Land-cover map and observational stations in the innermost domain. The administrative boundary of Nanjing City is marked with purple lines. An enlarged figure of the monitoring sites in downtown Nanjing is shown in panel (b).
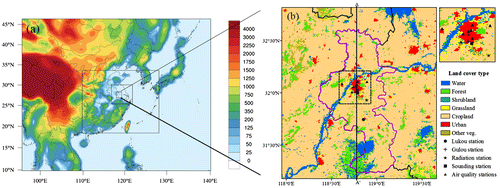
The initial and boundary meteorological conditions are obtained from the National Centers for Environmental Prediction global final analysis fields every 6 h at a spatial resolution of 1° × 1°. The WRF-Chem simulation is carried out with an 84-h model cycle, starting at 12:00 UTC of a given day and then run for 84 h, with the first 12 h discarded as the model spin-up. Model outputs at hour 72 of each model cycle are used to provide initial chemical conditions for the subsequent overlapping 84-h simulations. The static geographical fields, such as land-use type (Fig. b), vegetation fraction, leaf area index, albedo, are updated from Moderate-Resolution Imaging Spectroradiometer (MODIS) land products (Li et al., Citation2017). The Multi-resolution Emission Inventory for China in 2012 with 0.25° × 0.25° resolution (available at http://meicmodel.org) is used for the three outer domains. Gridded and speciated anthropogenic emission inventory for Nanjing (Fig. S1) is developed by Li, Chen et al. (Citation2011). Biogenic emissions are calculated online using the Model of Emissions of Gases and Aerosols from Nature (Guenther et al., Citation2006).
The Carbon-Bond Mechanism version Z gas-phase chemical mechanism (Zaveri and Peters, Citation1999) and Model for Simulating Aerosol Interactions and Chemistry (MOSAIC) aerosol module (Zaveri et al., Citation2008) are used in WRF-Chem. The MOSAIC sectional approach takes into account nine species (sulphate, nitrate, ammonium, organic carbon, black carbon, sodium chloride, calcium carbonate, water and other unspecified inorganic aerosols) and is distributed into four size bins ranging from 0.4 to 10 μm. Mie theory is used to calculate the aerosol optical properties, including extinction efficiency, single scattering albedo and asymmetry factor, based on the aerosol composition, size distribution and mixing state (Barnard et al., Citation2010). The short and long wave radiation transfer in the atmosphere is represented by the Goddard short wave radiation scheme (Chou and Suarez, Citation1999) and the Rapid Radiative Transfer Model long wave radiation scheme (Gallus and Bresch, Citation2006). The aerosol effects on photolysis rates are calculated using the Fast-J photolysis scheme (Wild et al., Citation2000). The other physical options contain the Noah land surface scheme (Ek et al., Citation2003), the Lin microphysics scheme (Lin et al., Citation1983), and the Yonsei University boundary layer scheme (Noh et al., Citation2003).
2.2. Numerical experiments
Two simulations that are respectively, designated as ‘EXP_CTRL’ and ‘EXP_NOFB’ are carried out. The EXP_CTRL experiment is defined as a control simulation in which the aerosols are allowed to provide feedbacks to the radiation scheme but through direct effects only. The sensitivity experiment (‘EXP_NOFB’) is conducted by closing both the direct and indirect feedbacks between aerosols and the radiation scheme.
To investigate the feedbacks between aerosol–radiation interaction and local air quality, a severe haze episode from 15 to 17 October 2015 was selected as a case study. The simulation lasts from 12:00 UTC on 8 October to 00:00 UTC on 21 October to capture the evolution of this pollution event. The low wind speed and high humidity associated with the persistent uniform pressure field in eastern China (Fig. S2) contributed to the elevated particulate level around Nanjing (up to 300 μg m−3 for hourly PM2.5 concentration). Meanwhile, the high temperature (~28 °C) favored the exacerbation of photochemical pollution, with the ozone peak (over 120 ppb) reported by Ministry of Environmental Protection (available at http://www.mep.gov.cn/) exceeding the national secondary standard (93.3 ppb). This autumn episode featuring both high particulate loading and photochemical pollution provides the optimal conditions to explore the aerosol-radiation-chemistry feedbacks in Nanjing.
2.3. Observational data
2.3.1. Ground and sounding meteorological data
Hourly ground observations of temperature, humidity, wind speed and wind direction at Lukou station (31.74°N, 118.86°E; Fig. b) provided by the National Climatic Data Center (NCDC) (available at http://www.ncdc.noaa.gov/) are used to evaluate the model meteorological performance. In addition, hourly total radiation measured at one ground radiation station in Nanjing (31.93°N, 118.90°E; Fig. b) by the National Meteorological Information Center (available at http://data.cma.cn/) is also used for model comparison.
Upper air radiosonde observations produced at one site – Nanjing (32.00°N, 118.80°E; Fig. b), are used to verify the upper-air fields. This site is managed by the World Meteorological Organization and provides the vertical profiles of temperature, dew point temperature, wind speed and wind direction every 12 h (08:00 and 20:00 Local Time (LT)).
2.3.2. Chemical composition and optical properties
Nanjing has a surface air quality monitoring network consisting of nine sites, as shown in Fig. b. Hourly ground-level PM2.5, O3 and NO2 concentrations collected at the monitoring network are used for model evaluation of chemical composition.
Aerosol optical parameters and ground-level ultraviolet (UV) radiation were measured at the Gulou campus (32.05°N, 118.78°E) of Nanjing University (Fig. b). Aerosol optical depth (AOD) and Ångström exponent (Angstrom, Citation1964) were retrieved from measurements using a Cimel sun photometer CE-318 N, providing data at eight wavelengths (340, 380, 440, 500, 670, 870, 1020 and 1640 nm). The sun photometer was calibrated annually to guarantee the accuracy and reliability of measurement data. The retrieved data are cloud-screened according to Smirnov et al. (Citation2000) with manual inspection being conducted.
3. Results and discussions
3.1. Model evaluation
3.1.1. Meteorology
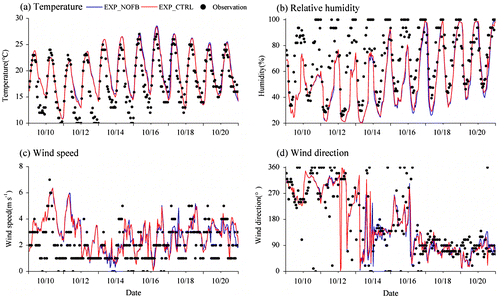
The performance for model results in the inner-most domain is evaluated using statistical metrics, such as correlation coefficient (R), mean bias (MB), mean error (ME), normalized mean bias (NMB), normalized mean error (NME), fractional bias (FB), fractional error (FE) (Table ). The model performance for meteorological variables at Lukou station (Table and Fig. ) is well within the typical ranges of mesoscale models (Hanna and Yang, Citation2001; Li et al., Citation2017). The temporal variations of 2-m temperature and relative humidity follow a strong diurnal pattern (Fig. a and b) and are reasonably well simulated in both experiments, with a correlation coefficient of 0.86 and 0.64, respectively. However, the model seriously over-predicts the temperature and under-predicts the humidity in the early simulation period, leading to a MB of 1.68 °C and −20.32%, respectively (Table ). The wind speed is characterized by large diurnal fluctuations, with a slight positive bias of 0.80 m s−1 (Fig. c). WRF is known to over-predict wind speed in particular at low to moderate values, which can be partly attributed to the unresolved terrain features by the default surface drag parameterization (Jimenez and Dudhia, Citation2012). In terms of wind direction, the model well captures the day-to-day wind shift during the modelling period.
Table 1. Statistical metrics for surface meteorological and chemical variables in EXP_CTRL.
Fig. 2. Time-series comparisons of (a) 2-m temperature, (b) 2-m relative humidity, (c) 10-m wind speed and (d) wind direction for simulations and observations at Lukou station.
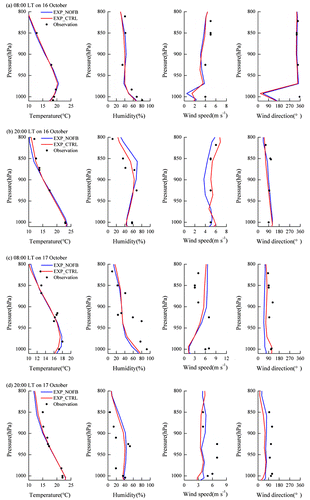
Furthermore, Fig. illustrates the vertical profiles of temperature, humidity and wind up to 800 hPa on 16 and 17 October. The temperature profiles are reasonably reproduced, showing a decreasing trend with height and only slight deviation from observations (less than 1.0 °C) above 500 m. Yet the air temperature is over-predicted at the lowest model layers by up to 2 °C in the case without aerosol-radiation feedback, e.g. at 08:00 LT on 17 October. The model also captures the vertical decrease of relative humidity, but produces large negative error below 900 hPa and positive error (nearly 20%) in the upper PBL. In terms of wind, the simulated wind direction closely matches observations, with easterly and southerly winds dominating Nanjing. The simulated wind speed, however, shows large model biases. Comparisons between the two simulations with/without aerosol-radiation feedback show that the EXP_CTRL run is cooler (0.5–1.0 °C) in the near-surface layer (~200 m) and slightly warmer in the middle and upper PBL above 500 m. The opposite is found for humidity on both days. The aerosol-induced changes in temperature and humidity profiles may be because of the negative radiative forcing of anthropogenic haze aerosols and suggest a more realistic vertical distribution.
3.1.2. Chemical composition
Time-series comparisons of PM2.5 (Fig. ) demonstrate that the WRF-Chem results agree well with observations in Nanjing, with a domain-average FB of 3% and FE of 45% (Table ). They are within the criteria proposed by Boylan and Russell (Citation2006) that the model performance is ‘satisfactory’ when FB is within ±60% and FE is below 75%. The model also successfully resolves the urban pollution hotspots in Nanjing (Fig. S3), with surface PM2.5 appearing to be highest at several typical urban sites, e.g. Aoti and Caochangmen (Fig. ). The model captures the accumulation and dissipation of particulate pollutants during the modelling period, with hourly PM2.5 concentration rising from 100 μg m−3 to more than 250 μg m−3 over 15–17 October. Since 18 October, a cold air starts to attack eastern China, leading to the dissipation of pollution. The simulated composition of PM2.5 averaged at all the observational sites shows that light-scattering secondary inorganic aerosols, i.e. sulphate (15.6%), nitrate (30.0%) and ammonium (14.6%), are the most abundant component of fine particles, accounting for 60.2% of the total particle mass.
Fig. 4. Time-series plots of PM2.5 (left panels), NO2 (middle panels) and O3 (right panels) in the EXP_CTRL simulation (black lines) and observations (red dots) at several representative sites.
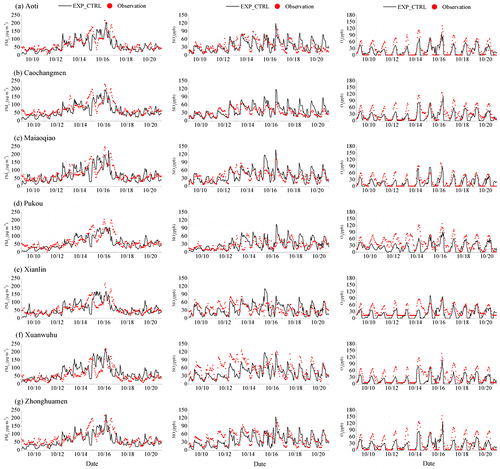
Comparisons of surface O3 and its precursor NO2 with routine observations further indicate that the WRF-Chem model generally simulates the evolution of photochemical pollution in Nanjing (Fig. ). The observed diurnal and day-to-day variations of O3 and NO2 levels are reasonably well predicted at most sites, with an overall R of 0.78 and 0.63, and NMB of −34 and 13%, respectively (Table ). The model performance for photochemical pollutants is acceptable when compared with previous studies using WRF-Chem. For example, Li et al. (Citation2017) reported a summertime O3 MB ranging from −25 to 20 ppb and a NO2 MB from −10 to 20 ppb across YRD. Zhang et al. (Citation2016) found that WRF-Chem under-predicted the surface NOx by −99.4 to −61.7% and overestimated O3 by up to 160.3% over East Asia in nearly all months. Because NO2 mixing ratio is influenced by local effects, such as emission and diffusion, the model overestimation of NO2 in this study may be caused by the uncertainties in emission inventory and boundary layer conditions. The underestimation of O3 peaks, particularly on clean days before 14 October, might be because of the model inability to accurately represent the stable boundary layer (Holtslag et al., Citation2013), the overestimation of titration loss near the source regions (Im et al., Citation2015), and the model errors in temperature fields (Fig. ).
3.1.3. Optical properties
Figure is the time-series of hourly AOD at 500 nm (AOD500) and Ångström exponent from observations at Gulou site and the model results. Both observations and simulations show that the aerosol extinction builds up rapidly during this 10-day pollution period, with AOD500 increasing from below 0.3 on 9 October to more than 1.5 seven days later (Fig. a), and the simulated extinction coefficient increasing from 0.1 to over 0.5 km−1 (Fig. b). Elevated AODs (more than 0.6) and aerosol loadings (100 μg m−3) are simulated near the sources and their downwind areas (Fig. S3). But beyond that, the simulated AODs on clean days, for example, 9–14 October, are seriously under-predicted (0.35 for simulation and 0.77 for observation). Hygroscopic particles grow significantly in size at high humidity due to water uptake, and hence, influence the aerosol extinction (Cheng et al., Citation2008; Bian et al., Citation2009; Brock et al., Citation2016). This underestimation of AODs may be because of the simulated negative bias in humidity (Fig. ) and hygroscopic growth of particles.
Fig. 5. Time-series plots of (a) AOD500, (b) extinction coefficient, (c) Ångström exponent and (d) single scattering albedo in the EXP_CTRL simulation (black lines) and observations (red dots) at Gulou site.
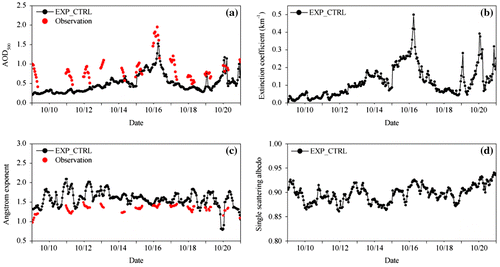
The simulated and observed Ångström exponents, a measure of wavelength dependence for aerosol extinction coefficient, agree well in terms of day-to-day and diurnal correlation (Fig. c). The typical high values of Ångström exponent (1.0–2.0) indicate that fine particles dominate this haze episode. Single scattering albedo is the ratio of particle scattering to total extinction, and thereby, a determinant of photolysis rate in the atmosphere. It is found that the simulated single scattering albedo increases from 0.87 to 0.91 during the haze event (Fig. d), indicating a more scattering aerosol component in Nanjing.
3.2. Impacts on PBL meteorology by aerosol-radiation direct feedback
3.2.1. Radiation and energy balance
Haze particles exert an important impact on surface energy budget over Nanjing (Fig. ), including downward short wave radiation (SW), sensible heat flux (SH), latent heat flux (LH) and ground heat flux (GH), which are calculated as the model differences between EXP_CTRL and EXP_NOFB.
Fig. 6. Day-to-day (upper panels; 9–20 October) and diurnal (bottom panels; 15–17 October) variations of aerosol-induced changes in (a, d) surface energy budget, (b, e) meteorological variables and (c, f) pollutant concentrations averaged over Nanjing. SW, SH, LH and GH in panels (a) and (d) refer to short wave radiation, sensible heat flux, latent heat flux and ground heat flux, respectively.
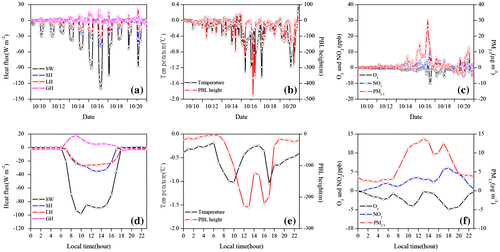
The simulation results indicate a significant reduction of downward SW flux reaching the ground (Figs. a and a), resulting from the combined effects of direct scattering and absorption of solar radiation by anthropogenic haze aerosols. Particularly, at the peak of this pollution episode (15–17 October), the instantaneous irradiance at the surface is considerably attenuated by up to 130 W m−2 (16.4%; Fig. a) due to the build-up of haze aerosols and their strong interaction with short wave radiation in the atmosphere. Jacobson (Citation1999) simulated that aerosols reduced the peak downward solar irradiance by 11% for August 27 1987 at Mount Disappointment and Riverside, California, slightly lower than our estimation. The spatial patterns of surface short-wave radiation attenuation (up to 80–90 W m−2) (Fig. a) closely follow that of the simulated aerosol loading and AOD (Fig. S3), which are more pronounced in the urban centres of Nanjing and its northern part.
Fig. 7. Aerosol-induced changes in (a) short wave radiation (W m−2), (b) 2-m temperature (°), (c) PBL height (m), (d) PM2.5 (μg m−3), (e) NO2 (ppb) and (f) O3 (ppb) between EXP_CTRL and EXP_NOFB averaged over 07:00–17:00 LT during 15–17 October. The city area of Nanjing is marked with black rectangle.
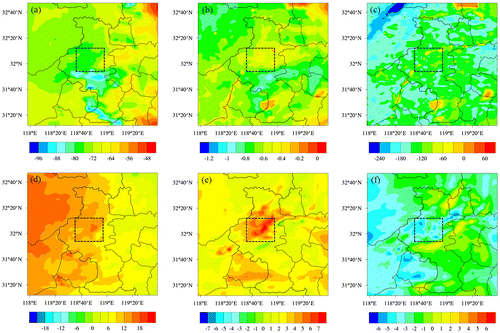
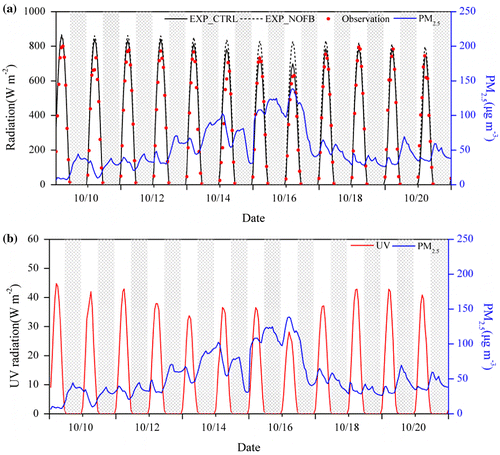
Figure examines the simulated short wave radiation with/without direct aerosol feedback against measurements. Both the EXP_CTRL simulation and observations show a significant reduction of incident radiation on 15–17 October due to the urban haze plume, with the observed peak values dropping to as low as 700–800 W m−2 (Fig. a). It is worth noting that the inclusion of aerosol feedbacks is important for better prediction of radiation fields, which reduces the model bias from 84.3 to 15.9 W m−2, though a slight overestimation still exists. Similarly, Fast et al. (Citation2006) also found an overestimation of predicted shortwave radiation by up to 40 W m−2 for the Houston area when the impact of aerosols on solar radiation was neglected.
Fig. 8. Time-series plots of surface (a) solar radiation (black lines for simulations and red dots for observations), and (b) UV radiation observed at Gulou station along with simulated PM2.5 concentration in EXP_CTRL (blue lines) during 9–20 October. Night-time hours are marked with black shade.
Because of the negative radiative effects of anthropogenic haze aerosols at the surface, the sensible heat and latent heat fluxes from the land surface into the atmosphere are both reduced substantially by 50.2 and 39.5 W m−2, respectively, on 16 October (Fig. a). On the contrary, ground heat flux is increased by 20.5 W m−2, which means that less heat is stored and transferred underground (Fig. a). The diurnal changes of surface energy balance further show that the changes of surface energy are more predominant in the daytime around 07:00 and 17:00 LT, when the anthropogenic haze aerosols reduce short-wave radiation, sensible heat flux and latent heat flux by 74.6, 23.2 and 21.1 W m−2, respectively, and increase ground heat flux by 8.2 W m−2 over Nanjing (Fig. d).
3.2.2. PBL meteorology
This intense radiative forcing of anthropogenic haze aerosols is expected to have some potential feedbacks on local meteorology. In response to the large decrease in downward short-wave radiation, the aerosol effects tend to cause a reduction of surface air temperature by up to 1.1–1.4 °C during 15–17 October over Nanjing City (Figs. b and b). From the diurnal changes depicted in Fig. e, it is clear that the reduction of surface air temperature reaches a maximum of 1.0 °C at around 10:00 and 17:00 LT, when the maximal radiation attenuation is observed. Our findings are consistent with recent studies that reported significant cooling effects in the daytime and negligible impacts at night resulting from the radiative effects by wildfire smoke (Jiang et al., Citation2012) and dust particles (Liu et al., Citation2016).
As seen in the vertical profile of temperature anomalies in the daytime (Fig. a), the impacts of aerosols on atmospheric thermal structure change considerably with altitude. Particularly, at around 10:00 LT, the direct aerosol-radiation feedback leads to a cooling of the air by −1.0 °C below 500 m above ground level, and conversely a warmer air by 0–0.4 °C at an altitude of 500–2000 m, which might contribute to stabilize the PBL (Gao et al., Citation2015). Similar effects are observed at other times during the day, but with much smaller intensity. The aerosol impacts on water vapor mixing ratio (±0.8 g kg−1) show an opposite pattern to that of temperature (Fig. b), a phenomenon that has been observed by Jiang et al. (Citation2012) in fire regions.
Fig. 9. Aerosol impacts on the vertical profiles of (a) air temperature (solid lines) and potential temperature (dash lines), (b) water vapor mixing ratio, (c) PM2.5, (d) NO and NO2 and (e) O3 at 10:00 LT, 14:00 LT, 18:00 LT and 22:00 LT averaged over Nanjing during 15–17 October.
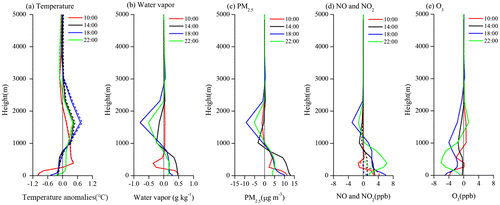
In turn, these changes in temperature structure may disturb the atmospheric dynamics, such as the PBL development and wind fields, which control the dispersion of atmospheric constituents. The aerosol effects lead to a more stable and shallow PBL, which can be inferred from the vertical profiles of potential temperature (Fig. a). Indeed, a maximum reduction of PBL height by 103.2–232.6 m (11–38%) during 10:00–17:00 LT has been simulated with aerosol-radiation feedback (Fig. e). Wang et al. (Citation2015) designed similar experiments and found that atmospheric aerosols cooled the PBL but warmed the atmosphere above it in northern China, leading to a more stable atmospheric stratification and a decrease in PBL height by about 33%.
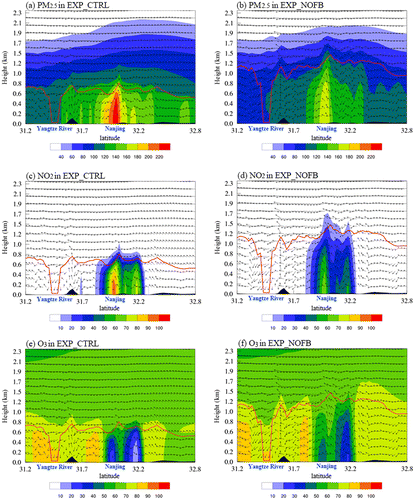
Such weakening of PBL development is the result of lower air entrainment, as the vertical wind speed is reduced by 0.1–0.8 mm s−1 (2–30% at mid-day) when the feedback of aerosols is taken into account (Fig. S4a), which is comparable to Pere et al. (Citation2014) who reported a reduction in vertical wind speed (5–80%) by the Russian wildfire. Furthermore, from the cross-sections of wind vectors (Fig. ), it can be concluded that the strong upward flow associated with the urban heat island (UHI) over city centres (31.8–32.0°N) is significantly suppressed to reach only 0.8 km height in the EXP_CTRL case. The aerosol-induced changes in horizontal wind speed are more complicated, which fluctuate within ±0.3 m s−1 (Fig. S4b). Jacobson and Kaufman (Citation2006) also reported a reduction of peak wind speed by ~0.2 m s−1 (7%) in China and California because the enhanced atmospheric stability by aerosol particles restricts the downward transfer of momentum flux.
3.3. Radiation feedback on aerosol and ozone photochemistry
3.3.1. Aerosol concentrations
The more stable PBL is favourable for the accumulation of air pollutants. Fig. illustrates the aerosol-induced changes in surface PM2.5 and PBL height. It can be clearly seen that the surface PM2.5 concentration increases throughout the modelling period, with a maximum increase reaching 30.5 μg m−3 (28.7%) at 13:00 LT on 16 October. The dramatic increase in surface PM2.5 concentration is mainly attributed to the deterioration in diffusion conditions, with a reduction of PBL height by 366 m and wind speed by 0.2 m s−1 at that time. For the diurnal cycle, the increase of surface PM2.5 concentration is more predominant at around 10:00–18:00 LT, with an average value ranging from 10 to 15 μg m−3 (12–16%). Wang et al. (Citation2015) also indicated that the more stable atmospheric stratification from haze pollution in northern China forms a positive feedback on particle concentration, with a 14% increase in surface PM2.5 concentration.
From the vertical profiles of average PM2.5 concentrations over Nanjing during 15–17 October, it is also clear that almost throughout the daytime, the PM2.5 level is increased by 5–15 μg m−3 within 1 km, but inversely reduced in the upper PBL by less than 10 μg m−3 (Fig. c). Figure further exhibits the cross-sections of PM2.5 and wind vectors along line AA′ (depicted in Fig. b) crossing the Nanjing city centre at 12:00 LT on 16 October, when the maximum PM2.5 increase (~30 μg m−3) is observed. Comparisons between the two simulations imply that, following the suppressed turbulent mixing and updraft flow in EXP_CTRL, pollution plumes with higher PM2.5 concentrations (over 220 μg m−3) are simulated in the PBL (Fig. a); while, in the EXP_NOFB case, atmospheric fine particles are dispersed deeper into the atmosphere (>1.5 km) through turbulence and UHI circulation (Fig. b).
3.3.2. Ozone photochemistry
3.3.2.1. Photolysis rate
Atmospheric aerosols have important impacts on tropospheric oxidation capacity (e.g..OH radicals) and ozone photochemistry through two key photolytic reactions: the NO2 photodissociation (J[NO2]) to form ground state oxygen atom O(3P) and the O3 photolysis (J[O(1D)]) to form electronically excited O(1D) atom.
Heavier aerosol loading during the haze period results in lower UV actinic flux from 44.7 to 28.2 W m−2 (−36.9%), showing a remarkable negative correlation (−0.79) between PM2.5 and UV actinic flux. Observations by Xia et al. (Citation2008) in NCP also indicated that atmospheric aerosols efficiently lowered UV radiation by 26% per unit AOD500. A detailed examination of photolysis rates over Nanjing (Fig. ) finds that this haze event produces evident impacts on J[NO2] and J[O(1D)] profiles. The simulated aerosol impacts on photolysis frequencies are in accordance with Mailler et al. (Citation2016). The radiation feedback by anthropogenic haze aerosols inhibits the NO2 photolysis frequency by −2.5% at the ground, whereas accelerates it by 3.2% in the boundary layer (Fig. a) because of the enhancement of UV by scattering-dominant aerosol particles. The simulated pattern and magnitude (approximately −2% at the lowest model layer to 4% in the upper PBL) for the changes in J[O(1D)] profile (Fig. b) are similar as that of J[NO2]. Particularly, the aerosol impacts on both J[NO2] and J[O(1D)] are more distinct in the early morning hours (06:00–10:00 LT) (Fig. ), when solar zenith angle (SZA) is large, indicating the effect of long aerosol optical path for downward radiation. However, with the decrease of SZA around noontime, the aerosol impacts on photolysis frequencies decrease approaching zero (Li, Bei et al., Citation2011). Through modifying these photolytic reactions, haze aerosols show important impacts on atmospheric oxidation capacity. For example, the daytime mean concentration of .OH radical in Nanjing decreases by 5.8% on the first model level (~20 m) and increases by 5.0% on the fourth model level (~700 m) (Fig. S5).
3.3.2.2. Ozone and its precursor
Daytime changes in the surface NO2 and O3 concentrations resulting from the aerosol-radiation feedback are shown in Fig. . Overall, in the urban pollution plumes, aerosols generate a remarkable increase of surface NO2 by roughly 0.4−6.0 ppb (2.4 ppb on average; 24%) via reducing its photolytic loss (Fig. a) and diffusion in the boundary layer (Fig. c), as also noticed by Tang et al. (Citation2003) in Southeast Asia and Li, Wang et al. (Citation2011) in East China. The NO2 increase is particularly large (3.2−6.0 ppb; 17.2−23.7%) around the nocturnal rush-hours (16:00−18:00 LT), when the aerosol-induced reduction in PBL height remains large (Fig. e) and anthropogenic emissions in conjunction with rush-hour traffic are strong.
By contrast, when the direct aerosol-radiation forcing is considered, the predicted ozone concentrations are substantially reduced by more than 4.0 ppb near the heavily polluted source regions (Fig. f), particularly around noontime (9:00−12:00 LT) and in the late afternoon (16:00−21:00 LT; Fig. f). The reduced ground-level O3 concentration in EXP_CTRL in the morning and late afternoon is presumably attributed to the weaker turbulent diffusion that brings O3-rich air downward and lower photochemical activity, which is confirmed in the contrast map of process contributions (Fig. S6). The lower photochemical activity is associated with the reductions in surface radiation and temperature (Fig. a and b), and photolysis rates (Fig. ) and .OH concentration (Fig. S5). Noticeably, the diurnal timing (Fig. f) and areas (Fig. f) with maximal O3 reductions (−5.0 ppb) correspond well with that of sharp NOx increase (data not shown), which has also been observed in the contrast map of vertical profiles (Fig. ). Thus, the spatio-temporal patterns of chemical fields suggest that the elevated ground-level NOx and thereby, enhanced titration loss may play a critical role in weakening ozone production. These factors collectively cause an O3 reduction in EXP_CTRL, ranging from 0.1 to 5.0 ppb (2.0 ppb on average; 12%).
Comparisons of the NO2 vertical distributions between two simulations (Fig. d) further imply that, the more stable PBL in EXP_CTRL results in a significant NO2 accumulation by 2.1−6.0 ppb within 1 km and conversely a marked NO2 reduction (less than −3.5 ppb) in the upper PBL (around 1.0 and 2.5 km). Changes in the vertical profile of NO are similar to that of NO2, but with much smaller magnitude (Fig. d). Accordingly, in the EXP_CTRL case, the O3 concentration in Nanjing is efficiently reduced by up to 6.6 ppb almost throughout the boundary layer (Fig. d). Furthermore, Fig. illustrates the cross-sections of ozone and its precursor, and wind vectors crossing the Nanjing City. In the city centre with high anthropogenic NOx emissions, the ozone photochemistry around noontime is governed by titration destruction (NO + O3 → NO2 + O2) (Seinfeld and Pandis, Citation1998), leading to a low O3 value than its surroundings (Fig. e). In EXP_CTRL, the shallow boundary layer (around 0.8 km) induced by aerosol-radiation feedback leads to weaker turbulent mixing and a denser NOx pollution plume (Fig. c and d), which further inhibits O3 production and causes a reduction of O3 concentration by over 16 ppb (Fig. e and f).
4. Conclusion
Severe haze events and their radiation feedbacks on tropospheric chemistry have drawn much attention recently. This study investigates the direct radiation feedbacks of anthropogenic haze aerosols (15–17 October 2015) on local meteorology and air quality (i.e. particulate matter and ozone photochemistry) over Nanjing megacity.
The simulation with direct aerosol-radiation feedback is capable of reproducing the actual observations. Pronounced radiation feedbacks are found for the predictions of meteorological and chemical variables, both in time and space. The negative radiative forcing of scattering-dominant haze aerosols lower the instantaneous surface irradiance by up to 130 W m−2. In response, the surface temperature decreases by 1.1–1.4 °C in regions of high aerosol loading and the atmosphere is heated at the top of PBL, leading to a more shallow PBL (232.6 m; 38.0%) and weaker vertical wind speed by 0.1–0.8 mm s−1 (2–30% at mid-day). Such a stable atmosphere favours the accumulation of particles (30.5 μg m−3; 28.7%) and NO2 (6.0 ppb; 23.7%) over Nanjing City. The weaker turbulent mixing and photochemical activity associated with the enhanced titration loss, and reduced downward radiation and photolysis rate result in a 0.1−5.0 ppb (12.0%) reduction of near-surface ozone.
The results highlight that the implementation of on-line-coupled meteorology-chemistry model is required to simulate the atmospheric transport and chemistry impacted by anthropogenic haze aerosols. In this work, however, we only examined the direct radiative forcing of aerosols. The impacts of direct and indirect aerosol effects are often shown to be in competition, and the indirect effect may be the dominant process for accurate predictions of ozone, particulate matter and other species (Makar, Gong, Milbrandt et al., Citation2015). Forkel et al. (Citation2015) performed several simulations with different aerosol feedbacks for a Russian wildfire episode; they found that the inclusion of aerosol–cloud interactions led to lower cloud droplet number and higher downward solar radiation by almost 50% for regions with low aerosol concentrations. But Kong et al. (Citation2015) pointed out that the representation of aerosol indirect effects is incomplete in current models and needs to be further improved. In the future work, both the direct and indirect aerosol radiative forcing should, therefore, be taken into account when assessing the aerosol effects on atmospheric chemistry.
Disclosure statement
No potential conflict of interest was reported by the authors.
Supplemental material
Supplemental material for this article can be accessed here https://doi.org/10.1080/16000889.2017.1339548
Supplementary Material
Download MS Word (1.3 MB)Acknowledgements
This study is supported by the National Natural Science Foundation of China (91544230, 41605115, 41621005 and 41575145), the National Key Basic Research Development Program of China (2016YFC0203303 and 2016YFC0208504) and the Fundamental Research Funds for the Central Universities (020714380021). The numerical calculations in this paper have been done on the Blade cluster system in the High Performance Computing & Massive Data Center (HPC&MDC) of School of Atmospheric Science, Nanjing University.
References
- Angstrom, A. K. 1964. The parameters of atmospheric turbidity. Tellus 16, 64–75.
- Barnard, J. C., Fast, J. D., Paredes-Miranda, G., Arnott, W. P. and Laskin, A. 2010. Technical note: evaluation of the WRF-Chem ‘aerosol chemical to aerosol optical properties’ module using data from the MILAGRO campaign. Atmos Chem Phys 10, 7325–7340.10.5194/acp-10-7325-2010
- Bian, H., Chin, M., Rodriguez, J. M., Yu, H., Penner, J. E. and co-authors. 2009. Sensitivity of aerosol optical thickness and aerosol direct radiative effect to relative humidity. Atmos Chem Phys 9, 2375–2386.10.5194/acp-9-2375-2009
- Boylan, J. W. and Russell, A. G. 2006. PM and light extinction model performance metrics, goals, and criteria for three-dimensional air quality models. Atmos Environ 40, 4946–4959.10.1016/j.atmosenv.2005.09.087
- Brock, C. A., Wagner, N. L., Anderson, B. E., Beyersdorf, A., Campuzano-Jost, P. and co-authors. 2016. Aerosol optical properties in the southeastern United States in summer – Part 2: Sensitivity of aerosol optical depth to relative humidity and aerosol parameters. Atmos Chem Phys 16, 5009–5019.10.5194/acp-16-5009-2016
- Charlson, R. J., Schwartz, S. E., Hales, J. M., Cess, R. D., Coakley, J. A. and co-authors. 1992. Climate forcing by anthropogenic aerosols. Science 255, 423–430.10.1126/science.255.5043.423
- Chen, S. Y., Zhao, C., Qian, Y., Leung, L. R., Huang, J. P. and co-authors. 2014. Regional modeling of dust mass balance and radiative forcing over East Asia using WRF-Chem. Aeolian Res 15, 15–30.10.1016/j.aeolia.2014.02.001
- Cheng, Y. F., Wiedensohler, A., Eichler, H., Heintzenberg, J., Tesche, M. and co-authors. 2008. Relative humidity dependence of aerosol optical properties and direct radiative forcing in the surface boundary layer at Xinken in Pearl River Delta of China: An observation based numerical study. Atmos Environ 42, 6373–6397.10.1016/j.atmosenv.2008.04.009
- Chou, M. D. and Suarez, M. J. 1999. A shortwave radiation parameterization for atmospheric studies. NASA/TM-104606, vol. 15, 40 pp.
- Dickerson, R. R., Kondragunta, S., Stenchikov, G., Civerolo, K. L., Doddridge, B. G. and co-authors. 1997. The impact of aerosols on solar ultraviolet radiation and photochemical smog. Science 215, 827–830.10.1126/science.278.5339.827
- Ek, M. B., Mitchell, K. E., Lin, Y., Rogers, E., Grunmann, P. and co-authors. 2003. Implementation of Noah land surface model advances in the National Centers for Environmental Prediction operational mesoscale Eta model. J Geophys Res-Atmos 108, 8851. DOI: 10.1029/2002jd003296.
- Fast, J. D., Gustafson, W. I., Easter, R. C., Zaveri, R. A., Barnard, J. C. and co-authors. 2006. Evolution of ozone, particulates, and aerosol direct radiative forcing in the vicinity of Houston using a fully coupled meteorology-chemistry-aerosol model. J Geophys Res-Atmos 111, D21305. DOI: 10.1029/2005jd006721.
- Forkel, R., Balzarini, A., Baró, R., Bianconi, R., Curci, G. and co-authors. 2015. Analysis of the WRF-Chem contributions to AQMEII phase2 with respect to aerosol radiative feedbacks on meteorology and pollutant distributions. Atmos Environ 115, 630–645.10.1016/j.atmosenv.2014.10.056
- Forkel, R., Werhahn, J., Hansen, A. B., McKeen, S., Peckham, S. and co-authors. 2012. Effect of aerosol-radiation feedback on regional air quality – A case study with WRF/Chem. Atmos Environ 53, 202–211.10.1016/j.atmosenv.2011.10.009
- Gallus, W. A. and Bresch, J. F. 2006. Comparison of impacts of WRF dynamic core, physics package, and initial conditions on warm season rainfall forecasts. Mon Weather Rev 134, 2632–2641.10.1175/MWR3198.1
- Gao, Y., Zhang, M., Liu, Z., Wang, L., Wang, P. and co-authors. 2015. Modeling the feedback between aerosol and meteorological variables in the atmospheric boundary layer during a severe fog-haze event over the North China Plain. Atmos Chem Phys 15, 4279–4295.10.5194/acp-15-4279-2015
- Gao, Y., Zhang, M. G., Liu, X. H. and Wang, L. L. 2016. Change in diurnal variations of meteorological variables induced by anthropogenic aerosols over the North China Plain in summer 2008. Theor Appl Climatol 124, 103–118.10.1007/s00704-015-1403-4
- Grell, G., Freitas, S. R., Stuefer, M. and Fast, J. 2011. Inclusion of biomass burning in WRF-Chem: Impact of wildfires on weather forecasts. Atmos Chem Phys 11, 5289–5303.10.5194/acp-11-5289-2011
- Grell, G. A., Emeis, S., Stockwell, W. R., Schoenemeyer, T., Forkel, R. and co-authors. 2000. Application of a multiscale, coupled MM5/chemistry model to the complex terrain of the VOTALP valley campaign. Atmos Environ 34, 1435–1453.10.1016/S1352-2310(99)00402-1
- Grell, G. A., McKeen, S., Michalakes, J., Bao, J. W., Trainer, M. and co-authors. 2002. Real-time simultaneous prediction of air pollution and weather during the Houston 2000 field experiment. In: Fourth Conference on Atmospheric Chemistry: Urban, Regional And Global Scale Impacts Of Air Pollutants, 224–227, Boulder, CO.
- Grell, G. A., Peckham, S. E., Schmitz, R., McKeen, S. A., Frost, G. and co-authors. 2005. Fully coupled ‘online’ chemistry within the WRF model. Atmos Environ 39, 6957–6975.10.1016/j.atmosenv.2005.04.027
- Guenther, A., Karl, T., Harley, P., Wiedinmyer, C., Palmer, P. I. and co-authors. 2006. Estimates of global terrestrial isoprene emissions using MEGAN (Model of Emissions of Gases and Aerosols from Nature). Atmos Chem Phys 6, 3181–3210.10.5194/acp-6-3181-2006
- Han, S. Q., Bian, H., Zhang, Y. F., Wu, J. H., Wang, Y. M. and co-authors. 2012. Effect of aerosols on visibility and radiation in spring 2009 in Tianjin, China. Aerosol Air Qual Res 12, 211–217.
- Hanna, S. R. and Yang, R. X. 2001. Evaluations of mesoscale models' simulations of near-surface winds, temperature gradients, and mixing depths. J Appl Meteorol 40, 1095–1104.10.1175/1520-0450(2001)040<1095:EOMMSO>2.0.CO;2
- Hatzianastassiou, N., Matsoukas, C., Drakakis, E., Stackhouse, P. W., Koepke, P. and co-authors. 2007. The direct effect of aerosols on solar radiation based on satellite observations, reanalysis datasets, and spectral aerosol optical properties from Global Aerosol Data Set (GADS). Atmos Chem Phys 7, 2585–2599.10.5194/acp-7-2585-2007
- He, S. and Carmichael, G. R. 1999. Sensitivity of photolysis rates and ozone production in the troposphere to aerosol properties. J Geophys Res Atmos 104, 26307–26324.10.1029/1999JD900789
- Holtslag, A. A. M., Svensson, G., Baas, P., Basu, S., Beare, B. and co-authors. 2013. Stable atmospheric boundary layers and diurnal cycles challenges for weather and climate models. Bull Am Meteorol Soc 94, 1691–1706.10.1175/BAMS-D-11-00187.1
- Huang, L. K., Yuan, C. S., Wang, G. Z. and Wang, K. 2011. Chemical characteristics and source apportionment of PM10 during a brown haze episode in Harbin, China. Particuology 9, 32–38.10.1016/j.partic.2010.07.022
- Hui, G. and Xiang, L. 2015. Influences of El Nino southern oscillation events on haze frequency in eastern China during boreal winters. Int J Climatol 35, 2682–2688.10.1002/joc.2015.35.issue-9
- Im, U., Bianconi, R., Solazzo, E., Kioutsioukis, I., Badia, A. and co-authors. 2015. Evaluation of operational on-line-coupled regional air quality models over Europe and North America in the context of AQMEII phase 2. Part I: Ozone. Atmos Environ 115, 404–420.
- Jacobson, M. Z. 1997. Development and application of a new air pollution modeling system. 3. Aerosol-phase simulations. Atmos Environ 31, 587–608.
- Jacobson, M. Z. 1998. Studying the effects of aerosols on vertical photolysis rate coefficient and temperature profiles over an urban airshed. J Geophys Res Atmos 103, 10593–10604.10.1029/98JD00287
- Jacobson, M. Z. 1999. Isolating nitrated and aromatic aerosols and nitrated aromatic gases as sources of ultraviolet light absorption. J Geophys Res Atmos 104, 3527–3542.10.1029/1998JD100054
- Jacobson, M. Z. and Kaufman, Y. J. 2006. Wind reduction by aerosol particles. Geophys Res Lett 33, 67–90.
- Jiang, X. Y., Wiedinmyer, C. and Carlton, A. G. 2012. Aerosols from fires: an examination of the effects on ozone photochemistry in the western United States. Environ Sci Technol 46, 11878–11886.10.1021/es301541k
- Jiménez, P. A. and Dudhia, J. 2012. Improving the representation of resolved and unresolved topographic effects on surface wind in the WRF model. J Appl Meteorol Clim 51, 300–316.10.1175/JAMC-D-11-084.1
- Kanaya, Y., Kajii, Y. and Akimoto, H. 2003. Solar actinic flux and photolysis frequency determinations by radiometers and a radiative transfer model at Rishiri Island: Comparisons, cloud effects, and detection of an aerosol plume from Russian forest fires. Atmos Environ 37, 2463–2475.10.1016/S1352-2310(03)00183-3
- Kong, X., Forkel, R., Sokhi, R. S., Suppan, P., Baklanov, A. and co-authors. 2015. Analysis of meteorology-chemistry interactions during air pollution episodes using online coupled models within AQMEII phase-2. Atmos Environ 115, 527–540.10.1016/j.atmosenv.2014.09.020
- Konovalov, I. B., Beekmann, M., Kuznetsova, I. N., Yurova, A. and Zvyagintsev, A. M. 2011. Atmospheric impacts of the 2010 Russian wildfires: Integrating modelling and measurements of an extreme air pollution episode in the Moscow region. Atmos Chem Phys 11, 10031–10056.10.5194/acp-11-10031-2011
- Lee, K. H., Kim, J. E., Kim, Y. J., Kim, J. and von Hoyningen-Huene, W. 2005. Impact of the smoke aerosol from Russian forest fires on the atmospheric environment over Korea during May 2003. Atmos Environ 39, 85–99.10.1016/j.atmosenv.2004.09.032
- Leiterer, U., Nagel, D. and Stolte, R. 1997. Typical vertical profiles of aerosol spectral extinction coefficients derived from observations of direct solar radiation extinction during the aircraft experiments Arctic Haze 94/95 and Merisec 93/94. Atmos Res 44, 73–88.10.1016/S0169-8095(97)00010-0
- Li, G., Bei, N., Tie, X. X. and Molina, L. T. 2011. Aerosol effects on the photochemistry in Mexico City during MCMA-2006/MILAGRO campaign. Atmos Chem Phys 11, 5169–5182.10.5194/acp-11-5169-2011
- Li, L., Chen, C. H., Fu, J. S., Huang, C., Streets, D. G. and co-authors. 2011. Air quality and emissions in the Yangtze River Delta, China. Atmos Chem Phys 11, 1621–1639.10.5194/acp-11-1621-2011
- Li, J., Wang, Z., Wang, X., Yamaji, K., Takigawa, M. and co-authors. 2011. Impacts of aerosols on summertime tropospheric photolysis frequencies and photochemistry over Central Eastern China. Atmos Environ 45, 1817–1829.10.1016/j.atmosenv.2011.01.016
- Li, M., Wang, T., Xie, M., Zhuang, B., Li, S. and co-authors. 2017. Improved meteorology and ozone air quality simulations using MODIS land surface parameters in the Yangtze River Delta urban cluster, China. J Geophys Res Atmos 122, 3116–3140.
- Li, Q., Zhang, R. H. and Wang, Y. 2016. Interannual variation of the wintertime fog-haze days across central and eastern China and its relation with East Asian winter monsoon. Int J Climatol 36, 346–354.10.1002/joc.4350
- Li, W. J., Zhou, S. Z., Wang, X. F., Xu, Z., Yuan, C. and co-authors. 2011. Integrated evaluation of aerosols from regional brown hazes over northern China in winter: Concentrations, sources, transformation, and mixing states. J Geophys Res-Atmos 116, 89–90.
- Liang, F. and Xia, X. A. 2005. Long-term trends in solar radiation and the associated climatic factors over China for 1961–2000. Ann Geophys 23, 2425–2432.10.5194/angeo-23-2425-2005
- Liao, H., Yung, Y. L. and Seinfeld, J. H. 1999. Effects of aerosols on tropospheric photolysis rates in clear and cloudy atmospheres. J Geophys Res Atmos 104, 23697–23707.10.1029/1999JD900409
- Lin, Y. L., Farley, R. D. and Orville, H. D. 1983. Bulk parameterization of the snow field in a cloud model. J Clim Appl Meteorol 22, 1065–1092.10.1175/1520-0450(1983)022<1065:BPOTSF>2.0.CO;2
- Liu, J., Xia, X., Wang, P., Li, Z., Zheng, Y. and co-authors. 2007. Significant aerosol direct radiative effects during a pollution episode in northern China. Geophys Res Lett 34, L23808, DOI: 10.1029/2007gl030953.
- Liu, L., Huang, X., Ding, A. J. and Fu, C. 2016. Dust-induced radiative feedback in north China: A dust storm episode modeling study using WRF-Chem. Atmos Environ 129, 43–54.10.1016/j.atmosenv.2016.01.019
- Mailler, S., Menut, L., Di Sarra, A. G., Becagli, S., Di Iorio, T. and co-authors. 2016. On the radiative impact of aerosols on photolysis rates: Comparison of simulations and observations in the Lampedusa island during the ChArMEx/ADRIMED campaign. Atmos Chem Phys 16, 1219–1244.10.5194/acp-16-1219-2016
- Makar, P. A., Zhang, J., Gong, W., Stroud, C., Sills, D. and co-authors. 2010. Mass tracking for chemical analysis: the causes of ozone formation in southern Ontario during BAQS-Met 2007. Atmos Chem Phys 10, 11151–11173.10.5194/acp-10-11151-2010
- Makar, P. A., Gong, W., Hogrefe, C., Zhang, Y., Curci, G. and co-authors. 2015. Feedbacks between air pollution and weather, part 2: Effects on chemistry. Atmos Environ 115, 499–526.10.1016/j.atmosenv.2014.10.021
- Makar, P. A., Gong, W., Milbrandt, J., Hogrefe, C., Zhang, Y. and co-authors. 2015. Feedbacks between air pollution and weather, Part 1: Effects on weather. Atmos Environ 115, 442–469.10.1016/j.atmosenv.2014.12.003
- Martin, R. V., Jocob, D. J., Yantosca, R. M., Chin, M. and Ginoux, P. 2003. Global and regional decreases in tropospheric oxidants from photochemical effects of aerosols. J Geophys Res Atmos 108, 4097. DOI: 10.1029/2002jd002622.
- Michalsky, J. J., Anderson, G. P., Barnard, J., Delamere, J., Gueymard, C. and co-authors. 2006. Shortwave radiative closure studies for clear skies during the atmospheric radiation measurement 2003 aerosol intensive observation period. J Geophys Res-Atmos 111, D14s90. DOI: 10.1029/2005jd006341.
- Moran, M. D., Menard, S., Talbot, D., Huang, P., Makar, P. A. and co-authors. 2010. Particulate-matter forecasting with GEM-MACH15, a new Canadian air-quality forecast model. Nato Sci Peace Sec B, 289–293.
- Noh, Y., Cheon, W. G., Hong, S. Y. and Raasch, S. 2003. Improvement of the K-profile model for the planetary boundary layer based on large eddy simulation data. Bound-Lay Meteorol 107, 401–427.10.1023/A:1022146015946
- Péré, J. C., Bessagnet, B., Mallet, M., Waquet, F., Chiapello, I. and co-authors 2014. Direct radiative effect of the Russian wildfires and its impact on air temperature and atmospheric dynamics during August 2010. Atmos Chem Phys 14, 1999–2013.10.5194/acp-14-1999-2014
- Qu, W. J., Wang, J., Zhang, X. Y., Yang, Z. F. and Gao, S. H. 2015. Effect of cold wave on winter visibility over eastern China. J Geophys Res Atmos 120, 2394–2406.10.1002/2014JD021958
- Seinfeld, J. H. and Pandis, S. N. 1998. Atmospheric Chemistry and Physics: From Air Pollution to Climate Change. New York: Wiley.
- Smirnov, A., Holben, B. N., Eck, T. F., Dubovik, O. and Slutsker, I. 2000. Cloud-screening and quality control algorithms for the AERONET database. Remote Sens Environ 73, 337–349.10.1016/S0034-4257(00)00109-7
- Su, B. D., Zhan, M. J., Zhai, J. Q., Wang, Y. J. and Fischer, T. 2015. Spatio-temporal variation of haze days and atmospheric circulation pattern in China (1961–2013). Quat Int 380, 14–21.10.1016/j.quaint.2014.11.044
- Tang, Y. H., Carmichael, G. R., Uno, I., Woo, J. H., Kurata, G. and co-authors. 2003. Impacts of aerosols and clouds on photolysis frequencies and photochemistry during TRACE-P: 2. Three-dimensional study using a regional chemical transport model. J Geophys Res Atmos 108, 8822. DOI: 10.1029/2002jd003100.
- Tao, M. H., Chen, L. F., Wang, Z. F., Wang, J., Tao, J. H. and co-authors. 2016. Did the widespread haze pollution over China increase during the last decade? A satellite view from space. Environ Res Lett 11, 054019. DOI: 10.1088/1748-9326/11/5/054019.
- Twomey, S. 1974. Pollution and planetary albedo. Atmos Environ 8, 1251–1256.10.1016/0004-6981(74)90004-3
- Wang, H., Shi, G. Y., Zhang, X. Y., Gong, S. L., Tan, S. C. and co-authors. 2015. Mesoscale modelling study of the interactions between aerosols and PBL meteorology during a haze episode in China Jing-Jin-Ji and its near surrounding region – Part 2: Aerosols’ radiative feedback effects. Atmos Chem Phys 15, 3277–3287.10.5194/acp-15-3277-2015
- Wild, O., Zhu, X. and Prather, M. J. 2000. Fast-j: Accurate simulation of in- and below-cloud photolysis in tropospheric chemical models. J Atmos Chem 37, 245–282.10.1023/A:1006415919030
- Wong, D. C., Pleim, J., Mathur, R., Binkowski, F., Otte, T. and co-authors. 2012. WRF-CMAQ two-way coupled system with aerosol feedback: Software development and preliminary results. Geosci Model Dev 5, 299–312.10.5194/gmd-5-299-2012
- Xia, X., Li, Z., Wang, P., Cribb, M., Chen, H. and co-authors. 2008. Analysis of relationships between ultraviolet radiation (295–385 nm) and aerosols as well as shortwave radiation in North China plain. Ann Geophys 26, 2043–2052.10.5194/angeo-26-2043-2008
- Zaveri, R. A. and Peters, L. K. 1999. A new lumped structure photochemical mechanism for large-scale applications. J Geophys Res Atmos 104, 30387–30415.10.1029/1999JD900876
- Zaveri, R. A., Easter, R. C., Fast, J. D. and Peters, L. K. 2008. Model for Simulating Aerosol Interactions and Chemistry (MOSAIC). J Geophys Res Atmos 113, D13204. DOI: 10.1029/2007jd008782.
- Zhang, Y., Zhang, X., Wang, L. T., Zhang, Q., Duan, F. K. and co-authors. 2016. Application of WRF/Chem over East Asia: Part I. Model evaluation and intercomparison with MM5/CMAQ. Atmos Environ 124, 285–300.10.1016/j.atmosenv.2015.07.022

![Fig. 11. Aerosol impacts on the vertical profiles of (a) J[NO2] and (b) J[O1D] averaged over Nanjing during 15–17 October.](/cms/asset/26263dee-cb23-4472-884e-edd2730f894b/zelb_a_1339548_f0011_oc.gif)