
Abstract
The aerosol–cloud interactions due to black carbon (BC) aerosols, as well as the implied climate responses, are examined using an aerosol module in the coupled atmosphere–ocean general circulation model MPI-ESM. BC is simulated to enhance cloud droplet number concentration (CDNC) by 10–15% in the BC emission source regions, especially in the Tropics and mid-latitudes. Higher CDNC and reduced auto-conversion from cloud water to rain water explains the increased cloud water path over the tropical regions (30S–30
N) in the model. In the global mean, the cloud water– as well as precipitation changes are negligibly small. The global-mean effective radiative forcing due to aerosol–cloud interactions for BC is estimated at
, which is attributable to the increase in CDNC burden and (regionally) cloud water in the model. Global mean temperature and rainfall response were found to be
and
, respectively, with significantly larger regional changes mainly in the downwind regions from BC sources.
1. Introduction
Black carbon (BC), the light-absorbing portion of carbonaceous aerosols, affects clouds in several ways:
through indirect effects, i.e. by serving as cloud condensation nuclei (CCN) once coated with hygroscopic material, and as ice nucleating particles, and subsequently altering cloud albedo (Twomey, Citation1974; Hendricks et al., Citation2011; Koch et al., Citation2011);
through the semi-direct effect and cloud absorption effects (Ackerman et al., Citation2000; Jacobson, Citation2012; Bond et al., Citation2013) by which the absorption of sunlight by the aerosol locally heats the atmosphere, which may lead, depending on the relative altitude of the aerosol layer with respect to the clouds, to an increase or decrease in cloud cover and cloud water content;
through a feedback of clouds to the surface cooling induced by BC (Liepert et al., Citation2004) or through the dynamics and precipitation changes induced by BC absorption of solar radiation (Ming et al., Citation2010).
Considerable uncertainty surrounds the estimates of the magnitude of the global total (direct + indirect) aerosol radiative forcing for which recent estimates range from to
(Boucher et al., Citation2013; Cherian et al., Citation2014; Zelinka et al., Citation2014). Its large uncertainty range stems from the complexity and poor understanding of the aerosol–cloud–radiation processes involved (Boucher et al., Citation2013). The effect of BC is yet more uncertain than the effect of other aerosol compounds because of the intricate cloud response induced by the strong absorption of sunlight (Andrews et al., Citation2010; Bond et al., Citation2013; Boucher et al., Citation2013; Baker et al., Citation2015). This is particularly important in the context of recentsuggestions that reducing anthropogenic BC emissions might be effective to mitigate anthropogenic climate change (Shindell et al., Citation2012; Stohl et al., Citation2015), since the warming effect by aerosol absorption of sunlight might be balanced to a considerable degree by a cooling effect of BC through cloud interactions (Koch et al., Citation2011). Previous studies estimated a negative global mean BC indirect forcing of
(Kristjánsson, Citation2002; Koch et al., Citation2011). However, positive BC indirect radiative effects were also found especially over remote oceanic and coastal regions because of the reduced aerosol hygroscopicity over these regions (Kristjánsson, Citation2002; Bond et al., Citation2013). BC indirect effects were also found to be responsible for the reduction of the cloud reflection over the North East Indian region in a recent study by Panicker et al. (Citation2016). The purpose of this study is to assess the indirect radiative effects of BC aerosols, and their implications for climate.
As in-situ and satellite measurements do not provide sufficient information about BC loading and absorption and their influence on clouds, the only tools that currently allow to estimate the effects on global climate change are climate models. In this study, we examine the climate responses of BC indirect radiative effects using sensitivity studies with a coupled aerosol-climate model. Using coupled models allows the ocean circulation to respond to the atmospheric changes resulting from the BC indirect radiative effects. We first examine the model-simulated response in CDNC, cloud water and cloud cover. We further explore the response on temperature and precipitation globally.
Section 2 describes the model description, simulation set-up and methodology used in this study. The climate responses on clouds, net radiation, surface temperature and precipitation are discussed in Section 3, followed by the conclusions in Section 4.
2. Simulation set-up and methodology
Climate simulations have been performed using the Max Planck Institute for Meteorology (MPI-M) Earth System model (MPI-ESM Giorgetta et al., Citation2013) with interactive aerosols (HAM2). The MPI-ESM-HAM2 consists of the atmospheric general circulation model (GCM), the ECHAM6.1 GCM (Stevens et al., Citation2013), coupled to the oceanic GCM MPIOM (Jungclaus et al., Citation2013). The atmosphere model ECHAM6.1 was run at a horizontal resolution of T63 (about ) and a vertical resolution of 47 levels (extending from the surface to 0.01 hPa). The interactive aerosol module HAM2 (Stier et al., Citation2005; Zhang et al., Citation2012) was used.
The aerosol module considers five species (sulphate, sea salt, mineral dust, organic carbon (OC) and BC) in seven log-normal modes with prescribed standard deviations, three of which contain hydrophobic (Aitken (BC and OC), Accumulation (mineral dust) and Coarse (mineral dust)) and four of which contain hygroscopic (Nucleation (sulphate), Aitken (BC, OC and sulphate), Accumulation (all five species) and Coarse (all five species)) aerosols. The model takes into account natural and anthropogenic emissions of aerosols and aerosol precursor gases, with the emissions of sea salt and mineral dust computed interactively (Zhang et al., Citation2012). Sinks are due to dry deposition and wet scavenging. A simplified chemical scheme is used for the sulphur cycle with reactive gases prescribed (Feichter et al., Citation1996). The micro-physical core M7 accounts for nucleation, condensation of gases onto existing particles, and coagulation of particles so that in each mode, internally-mixed particles are considered (Vignati et al., Citation2004). As such, BC is in general one constituent only of an internally mixed particle. Previous studies evaluating BC as simulated by general circulation models found that ECHAM-HAM performs similarly as other models (Koch et al., Citation2009), with often an underestimation of BC compared to the available observations. More recently, it has been found that the geographical distribution of BC is too smooth compared to aircraft observations (Kipling et al., Citation2013), and that ECHAM-HAM transports too little BC to the Arctic region (Eckhardt et al., Citation2015). Quennehen et al. (Citation2016) reported that similar to the results of other global models
ECHAM-HAM tends to underestimate BC especially near strong source regions.
In HAM2, the stratiform cloud parameterization is extended to a two-moment micro-physical scheme (Lohmann et al., Citation2007). In this scheme, aerosols serve as cloud condensation nuclei for liquid-water clouds. The nucleation of ice crystals is parame-terized independently from the ice nucleating properties of the aerosol since the implemented heterogeneous nucleation pathways (Lohmann et al., Citation2007) are considered too uncertain. In consequence, two effects of aerosols on clouds are parameterized: Aerosols may serve as CCN and enhance CDNC (Lin and Leaitch, Citation1997), by which at constant liquid water path cloud albedo is enhanced (Twomey, Citation1974); and the auto-conversion rate of cloud water to rain is dependent on the cloud droplet number concentration as proposed by Khairoutdinov and Kogan (Citation2000), by which a cloud lifetime effect (Albrecht, Citation1989) is implemented that leads to enhanced cloud liquid water path and cloud cover in a more polluted atmosphere.
Two identical simulations are carried out for quantifying the climate response from BC aerosol–cloud interaction effects, one control simulation with fully interactive BC and one sensitivity simulation with no micro-physical impact of BC on clouds (see below). The control and sensitivity simulations were run for 50 years, starting from a pre-industrial equilibrium simulation, in order to separate a robust signal from inter-annual variability. In both experiments, present-day anthropogenic emissions from the Evaluating the CLimate and Air Quality ImPacts of Short-livEd Pollutants (ECLIPSE) emission data-sets V4.0a are used (Klimont et al., Citation2013). These emissions, representative for the year 2005, are kept constant throughout the simulations. The concentrations of long-lived greenhouse gases are also kept fixed, at pre-industrial (1850) levels. In the sensitivity simulation (no BC aerosol indirect effect (NOBCAIE)), CCN concentration, as computed interactively in the model, is re-scaled by a mass fraction of the specific mass of all aerosol except for BC. In the model, aerosol activation is parameterized according to Lin and Leaitch (Citation1997):(1)
where N is the number concentration of the aerosol particles, w is the vertical velocity, is the time step,
is the CDNC from the previous time step and
. For the BC indirect forcing simulation N is scaled by using the following formula:
(2)
Considering internally mixed particles, this is a simplified description of suppressing the indirect effect by BC aerosols. However, if allowing for internal mixing, and if the indirect effect is to be separated from the direct and especially semi-direct effects of BC, this is the only feasible approach. It is expected that this perturbation to the model affects the parameterized microphysical processes (notably auto-conversion of cloud-to precipitation water), but the resulting radiative effects also cool the surface, which can induce changes in evaporation, available humidity, convective motion and horizontal circulation patterns. The results shown below are averaged over the 50-year period. In addition, one more additional sensitivity simulation is carried out by removing all anthropogenic BC emissions (named ‘NOBC’ run) to identify the climate responses resulted from total BC effects. The NOBC run has been described and analysed previously also by Baker et al. (Citation2015). Two additional 10-year simulations (one control and one NOBCAIE) with pre-scribed climatological sea surface temperatures (SST) are carried out to estimate the effective radiative forcing () from BC aerosol–cloud interactions.
3. Results and discussion
3.1. BC emission and column burden
Figure a shows the global spatial distribution of the BC emissions for the year 2005 used for the present study (Klimont et al., Citation2013). The largest anthropogenic BC emissions are over India, China and African regions. High BC emissions occur in India, China, parts of Africa and south America and the eastern USA, resulting largely from fossil fuel and biomass emissions. Total (fossil fuel + biomass + shipping + aircraft) global BC emission are 7.58 , with a significant fraction stemming from fossil fuel emissions (5.34
). This includes all current emission sources (Klimont et al., Citation2013), and the global total emission is slightly higher than the value used in previous studies (Koch et al., Citation2009).
Figure 1. Spatial distribution of (a) BC emissions (g m yr
) in 2005 and multi-year (50-year) mean (b) BC column burden (mg m
).
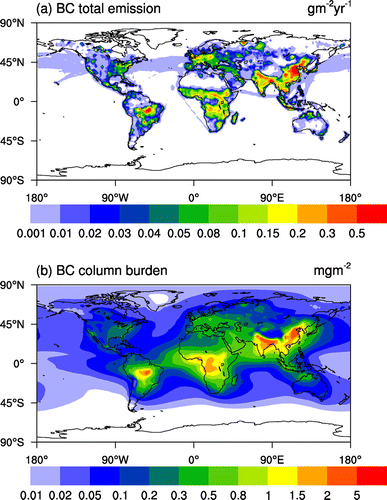
The model-simulated multi-year mean spatial distribution of the BC column burden is presented in Fig. b, which shows significant peaks in India, China, Africa and South America. In general, the model-simulated BC burden shows a large diversity that tends to decrease rather rapidly away from source regions. However, non-negligible amounts of BC are transported up to several 1000 km away from the main sources also over the ocean, where their effect on clouds may become particularly strong compared to the source regions.
Table 1. Global-mean values of different variables from the perturbation runs (NOBCAIE and NOBC), estimated as the difference between the CTL and perturbation simulations. ‘CDNC’ denotes the cloud droplet number concentration.
3.2. Cloud and radiation response from pre-scribed SST runs
In order to understand BC indirect effects on radiation, we carried out 10-year pre-scribed SST simulations for CTL and NOBCAIE conditions. A substantial CDNC increase is simulated over parts of South Asia, Africa and Europe (Fig. S1). In the upper troposphere (not shown), and in parts of the polar regions, removal of BC aerosols from cloud activation results in smaller CDNC in the NOBCAIE run (Fig. S1). The BC effective radiative forcing due to the aerosol–cloud interactions is estimated as the difference on net radiation (short-wave + long-wave) flux at the top-of-the-atmosphere (TOA) between the two simulations. The parameterized effect of BC on net radiation (aerosol–radiation interactions, formerly called ‘direct-effect’) is the same in both NOBCAIE and CTL simulations, so only the aerosol–cloud interactions are considered here. This yields a global mean BC indirect effect of at the TOA (Table ). Statistically significant radiation changes at the 90% confidence interval are found over parts of Africa, South-East Asia and Europe (Fig. S2). The TOA short-wave radiation changes were found to be relatively large (negative), albeit still noisy, over major BC source regions such as Europe, Asia and North America (Fig. S2). A positive BC forcing due to aerosol–cloud interactions, in turn, is simulated over the remote oceanic regions in the Northern Hemisphere (Fig. S2).
A substantial cooling effect (global mean BC indirect effect of ) is found, which mostly stems from regions in which large CDNC change are simulated (Figs. S1 and S2) whereas in other regions, only a very noisy signal is simulated. In the model, the reduction in net radiation coincides in its geographical distribution with the increase in CDNC burden due to additional BC CCN, over these regions (Fig. S1). This indicates that the radiation response is explained by the simulated changes in CDNC, which in turn affects the albedo (cloud albedo effect) and cloud cover or cloud water path (cloud life-time effect). In summary, a combination of cloud life-time and cloud albedo effects lead to the radiation response in the model.
3.3. Cloud and temperature responses from coupled runs
Before studying the BC indirect effect on precipitation, it is important to look at how the clouds are changing due to the NOBCAIE of the ocean-coupled model sensitivity runs. Annual zonal mean plots of CDNC, cloud water and cloud cover are analysed as a function of altitude (Figs. and ). By design of experiments, CDNC is larger in the CTL compared to the NOBCAIE simulation in the Northern Hemisphere (in particular in the low- to mid-latitudes 0–60N). Noticeable CDNC changes (10–20%) are also simulated over Southern Hemisphere mid-latitude and polar regions. In the upper troposphere (not shown), and in parts of polar regions (Fig. ), smaller droplet concentrations are likely the result of cloud feedbacks to the perturbation.
Figure 2. Zonal mean of the CDNC (10 cm
) from (a) the CTL-coupled model simulation and (b) the percentage responses from the NOBCAIE run (1-NOBCAIE/CTL).
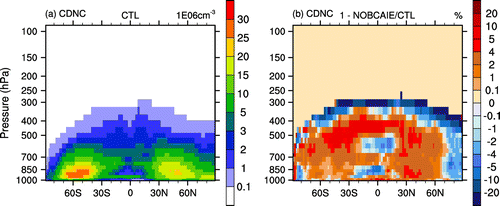
Figure 3. Zonal mean of the cloud water and the cloud cover from the CTL simulation (a), (b) and percentage changes (c) and (d) from the NOBCAIE run (1-NOBCAIE/CTL).
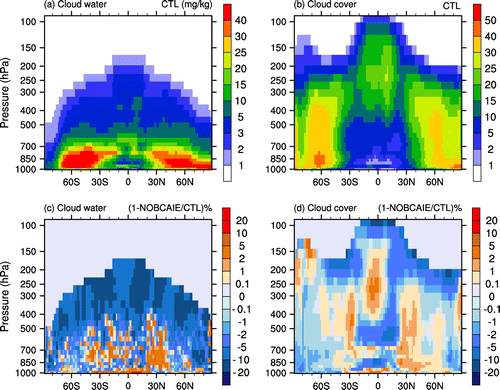
Cloud water is found to be mostly larger (by 2–10% in the tropics (30S-30
N)) in the NOBCAIE run compared to the CTL run, coincident with larger droplet number concentrations in these regions (Fig. ). However, patterns do not follow very clearly the CDNC change patterns (Fig. ). Cloud water is found to be increased in the Tropics in both Southern and Northern Hemisphere. Cloud cover changes tend to coincide with CDNC changes (Fig. c and d), with a slightly higher similarity patterns in CTL run in the boundary layer than in NOBCAIE run (Fig. ) over the tropical region (30
S–30
N). In the CTL run, the inclusion of the indirect effect due to BC aerosols leads to a higher CDNC than in the NOBCAIE run (Fig. a), and subsequently to a reduction of the auto-conversion from cloud water to rain water. This explains the cloud water increase (Fig. c) in the simulation over the tropical region (30
S–30
N), although only a small effect on cloud water is found in the global mean (Table ). Only an impact of BC on indirect effect liquid-cloud properties is implemented, not their potential role as ice nucleating particles.
The temperature response is small (within 0.5 K) everywhere, except in the Northern Hemisphere (NH) polar regions (Fig. b). The cooling is located over the NH mid-latitude industrial regions (namely, Northern India, North-East China, Europe and North-Eastern United States) and the biomass-burning region in South Africa, all of which are under the influence of heavy BC aerosol burden. The global mean temperature change was found to be
(Table ). The model shows an overall cooling response in the Northern Hemisphere. NH cools to a greater extent than SH partly owing to the higher aerosol burden in the CTL run. The comparatively small high-altitude BC concentrations in the model may influence the resulting temperature response (Baker et al., Citation2015). The reduction in high altitude BC is expected to contribute to reducing Arctic forcing due to reduction in BC deposition on snow as well as in absorption of sunlight over bright surfaces (Koch et al., Citation2011).
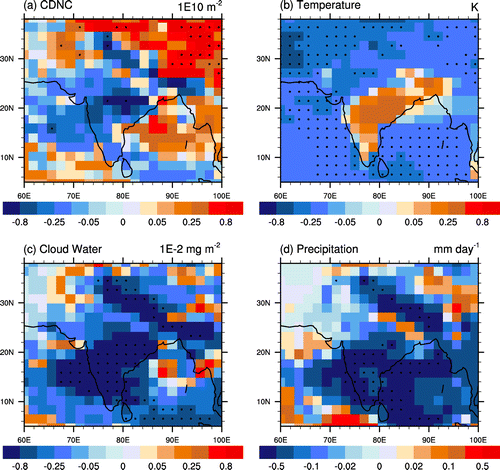
Figure 4. Spatial distribution of changes (CTL-NOBCAIE) in (a) CDNC burden () , (b) surface temperature (K), (c) vertically integrated cloud water (
) and (d) total (convective + stratiform) rainfall (
) from the coupled model simulations. Black dots indicate the grid points where the change is statistically significant at the 95% confidence level.
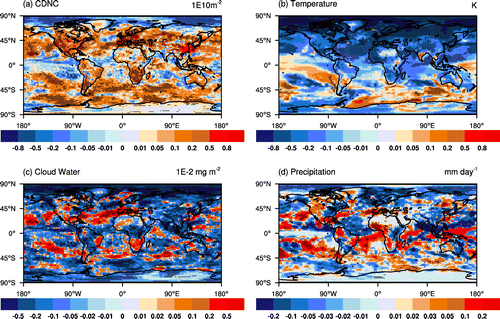
Figure 5. Global mean annual average changes in (a) surface temperature (K), and (b) rainfall () from the coupled model simulations. Error bars indicate the 95% confidence interval on the error in the mean.
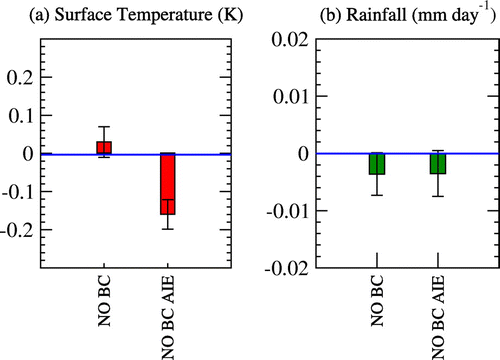
Figure 6. South-west monsoon season (JJAS) mean changes (CTL-NOBCAIE) in (a) CDNC burden (), (b) surface temperature (K), (c) vertically integrated cloud water (
) and (d) total (convective + stratiform) rainfall (
) over the South Asia region. Black dots indicate the grid points where the change is statistically significant at the 95% confidence level.
3.4. Precipitation response
Figure d shows the response of annual-mean precipitation due to BC indirect forcing. The global mean precipitation responsedue to BC indirect radiative effect is simulated at (Table ). The error indicates the 95% confidence interval on the error in the mean (
), based on 50annual means and it reflects the uncertainty of the mean due to the internal variability in the model. Small rainfall increase is simulated mostly over the mid-latitudes and tropical regions (45
S–45
N). Consistent with the negative effective forcing and reduced temperature, the overall effect is a reduction in precipitation (Table ). The overall reduction in precipitation is also driven by the Arctic response, where the CDNC and cloud water is decreased (Fig. ). The decrease in CDNC in the Arctic is linked to decreases in sea-ice (not shown) and collocated increases in TOA SW flux (Fig. S2). The precipitation response in general correlates with cloud water changes in most of the regions (Fig. ).
A similarly small global mean precipitation response (, Figs. S3 and ) was found in previously published simulations in which anthropogenic BC emissions (NOBC run) were reduced to zero (Baker et al., Citation2015), i.e. without either aerosol–radiation and aerosol–cloud interactions by anthropogenic BC (see also Table ). Smaller positive precipitation responses are found over mid-latitude and tropical regions in both NOBC and NOBCAIE experiments. The precipitation response from the NOBC run (CTL-NOBC) is found to be negative over the Indian regions (Fig. S3). These negative precipitation changes in the model are driven by circulation changes (Fig. S4). The negative precipitation changes correlate well (correlation coefficient for the spatio-temporal distribution (monthly mean values) is
, not shown) with temperature changes in the model. A smaller positive global temperature change was found in the NOBC run assessed earlier by Baker et al. (Citation2015) and briefly reported here (CTL-NOBC), while a negative temperature change resulted from NOBCAIE run (Fig. ). This is due to different radiation and cloud changes in both experiments. In summary, consistent precipitation responses resulted from both NOBC and NOBCAIE sensitivity experiments in the model.
The Indian region stands out as one of the most sensitive regions in terms of precipitation response (Fig. d). Figure shows the responses on CDNC, cloud water, surface temperature and precipitation in this area for the Indian summer monsoon period (June to September). A significant rainfall decreasing trend is simulated over most parts of the Indian region, mainly over western Ghats (Fig. d). This drying coincides with cloud water decreases and is also reflected in the annual mean. Meehl et al. (Citation2008) showed that the BC aerosols may be responsible for the observed trends of decreasing precipitation during summer monsoon season over parts of India, Bangladesh and Burma. The present study also shows a decrease of precipitation in Central and Southern India, Bangladesh and the north of the Bay of Bengal, which is similar to their results (Fig. d). Meehl et al. (Citation2008) showed a decrease in surface air temperature in areas of North-Western India, the Bay of Bengal, and the Arabian Sea regions. The current study also shows a decline in surface air temperature in these areas (Fig. b).
In the model, the precipitation response is mainly from the changes in large-scale/stratiform, rather than convective precipitation (Table ). This is because the two-moment microphysical scheme is parameterized only for stratiform clouds in the model. The inclusion of the BC aerosol indirect effect in the CTL run means that compared to NOBCAIE, cloud water and cloud cover is higher (Fig. c and d). The resulting surface cooling leads to a decrease in the column water vapour (not shown), and subsequently to smaller rainfall in the CTL run. However, the impacts of BC indirect effects on precipitation could be useful for explaining the changes in monsoon precipitation, especially in the Indian region. The changes in radiation and precipitation indicate that BC indirect effect has a noticeable influence on regional climate responses.
Further analysis is carried out to differentiate the rainfall response resulting from the increased CDNC (i.e. due to BC indirect radiative effects ) and from the SST feedbacks and consequential changes in circulation patterns. We do this here by analysing the fixed-SST simulations (only radiative effects and rapid adjustments) and the coupled-ocean simulations (allowing also for SST feedbacks). The total rainfall response is calculated as the difference between CTL and NOBCAIE runs:(3)
This includes rainfall response both due to BC indirect effects and due to induced SST-and, subsequently, circulation feedbacks. The precipitation difference between fixed SST runs can be considered due to BC indirect effects alone as follows:(4)
Under a linear response assumption, the SST feedbacks () can be expressed as ‘
minus
’:
(5)
The analysis of climate response for and
is shown in Fig. S4. The positive rainfall response in
is similar to
(i.e. due to BC indirect effects induced CDNC changes) and the negative precipitation response in
is similar to
. The decreased rainfall response was not seen in the fixed SST run because of no circulation changes via SST feedbacks involved. Consequently, there is only a negligible water vapour response in the fixed SST run. This implies that the BC aerosol-induced SST change has generally caused a greater rainfall response (could be positive or negative) among various regions than the sole aerosol effect does.
4. Conclusions
In this study, the climate responses from the BC indirect effect are examined using an ocean-coupled aerosol climate model (MPI-ESM). To assess the BC indirect effect, the CCN number concentration in the sensitivity simulation has been reduced by scaling the mass fraction of hygroscopic BC. A possible effect of BC serving as ice nucleating particles is not implemented, and as such, the effects are simulated mostly for liquid-water clouds. The BC aerosols have a noticeable impact (10%) on CDNC, up to nearly 20% in polluted BC source regions. Cloud water shows only a negligible change in the global mean. The CDNC and cloud water changes geographically (statistically significant regions (45S–45
N)) coincide well with the changes in radiation and precipitation. This implies that BC aerosols have a noticeable regional influence on clouds and radiation due to cloud feedbacks to the perturbation in the model.
The global-mean BC indirect effective radiative forcing was found to be . A very small, and insignificant, global mean precipitation (
) response was simulated because of opposite regional responses.
The key messages from the present study are as follows:
A new framework by modifying the cloud activation scheme is used for estimating the climate responses resulted from BC indirect radiative forcing. The radiation, temperature and circulation changes are included.
The stronger BC climate responses from indirect forcing is exerted over downwind region of BC sources along with the polluted BC source regions. This will be useful for making mitigation policies on transport and anthropogenic emission sectors of BC aerosols.
Future BC mitigation policies would affect CDNC and cloud distributions, that may substantially influence the global cloud radiative forcing from warm clouds.
Supplementary Data
Download PDF (1.7 MB)Acknowledgements
We thank two anonymous reviewers for their insightful and constructive comments which have led to several major improvements.
Additional information
Funding
Notes
No potential conflict of interest was reported by the authors.
Supplemental data for this article can be accessed here. [https://doi.org/10.1080/16000889.2017.1369342]
References
- Ackerman, A. S., Toon, O. B., Stevens, D. E., Heymsfield, A. J., Ramanathan, V. and co-authors. 2000. Reduction of tropical cloudiness by soot. Science 288, 1042–1047.
- Albrecht, B. A. 1989. Aerosols, cloud microphysics, and fractional cloudiness. Science 245, 1227–1230.
- Andrews, T., Forster, P. M., Boucher, O., Bellouin, N. and Jones, A. 2010. Precipitation, radiative forcing and global temperature change. Geophys. Res. Lett. 37, L14701.
- Baker, L. H., Collins, W. J., Olivié, D. J. L., Cherian, R., Hodnebrog, Ø. and co-authors. 2015. Climate responses to anthropogenic emissions of short-lived climate pollutants. Atmos. Chem. Phys. 15, 8201–8216.
- Bond, T. C., Doherty, S. J., Fahey, D. W., Forster, P. M., Berntsen, T. and co-authors. 2013. Bounding the role of black carbon in the climate system: a scientific assessment. J. Geophys. Res. Atmos. 118, 5380–5552.
- Boucher, O., Randall, D., Artaxo, P., Bretherton, C., Feingold, G. and co-authors. (2013). Clouds and Aerosols Climate Change 2013: The Physical Science Basis. Contribution of Working Group I to the Fifth Assessment Report of the Intergovernmental Panel on Climate Change, book section 7. Cambridge University Press, Cambridge, United Kingdom and New York, NY, USA. pp. 571–658.
- Cherian, R., Quaas, J., Salzmann, M. and Wild, M. 2014. Pollution trends over europe constrain global aerosol forcing as simulated by climate models. Geophys. Res. Lett. 41, 2176–2181.
- Eckhardt, S., Quennehen, B., Olivié, D. J. L., Berntsen, T. K., Cherian, R. and co-authors. 2015. Current model capabilities for simulating black carbon and sulfate concentrations in the arctic atmosphere: a multi-model evaluation using a comprehensive measurement data set. Atmos. Chem. Phys. 15, 9413–9433.
- Feichter, J., Kjellstrom, E., Rodhe, H., Dentener, F., Lelieveld, J. and co-authors. 1996. Simulation of the tropospheric sulfur cycle in a global climate model. Atmos. Environ. 30, 1693–1707.
- Giorgetta, M. A., Jungclaus, J., Reick, C. H., Legutke, S., Bader, J. and co-authors. 2013. Climate and carbon cycle changes from 1850 to 2100 in mpi-esm simulations for the coupled model intercomparison project phase 5. J. Adv. Model. Earth Syst. 5, 572–597.
- Hansen, J., Sato, M., Ruedy, R., Nazarenko, L., Lacis, A. and co-authors. 2005. Efficacy of climate forcings. J. Geophys. Res. Atmos. 110, D18104.
- Hendricks, J., Kärcher, B. and Lohmann, U. 2011. Effects of ice nuclei on cirrus clouds in a global climate model. J. Geophys. Res. Atmos. 116, D18206.
- Jacobson, M. Z. 2012. Investigating cloud absorption effects: global absorption properties of black carbon, tar balls, and soil dust in clouds and aerosols. J. Geophys. Res. Atmos. 117, D06205.
- Jungclaus, J. H., Fischer, N., Haak, H., Lohmann, K., Marotzke, J. and co-authors. 2013. Characteristics of the ocean simulations in the max planck institute ocean model (mpiom) the ocean component of the mpi-earth system model. J. Adv. Model. Earth Syst. 5, 422–446.
- Khairoutdinov, M. and Kogan, Y. 2000. A new cloud physics parameterization in a large-eddy simulation model of marine stratocumulus. Mon. Weather Rev. 128, 229–243.
- Kipling, Z., Stier, P., Schwarz, J. P., Perring, A. E., Spackman, J. R. and co-authors. 2013. Constraints on aerosol processes in climate models from vertically-resolved aircraft observations of black carbon. Atmos. Chem. Phys. 13, 5969–5986.
- Klimont, Z., Smith, S. J. and Cofala, J. 2013. The last decade of global anthropogenic sulfur dioxide: 2000–2011 emissions. Environ. Res. Lett. 8, 014003.
- Koch, D., Balkanski, Y., Bauer, S. E., Easter, R. C., Ferrachat, S. and co-authors. 2011. Soot microphysical effects on liquid clouds, a multi-model investigation. Atmos. Chem. Phys. 11, 1051–1064.
- Koch, D., Schulz, M., Kinne, S., McNaughton, C., Spackman, J. R. and co-authors. 2009. Evaluation of black carbon estimations in global aerosol models. Atmos. Chem. Phys. 9, 9001–9026.
- Kristjánsson, J. E. 2002. Studies of the aerosol indirect effect from sulfate and black carbon aerosols. J. Geophys. Res. Atmos. 107, 1–19.
- Liepert, B. G., Feichter, J., Lohmann, U. and Roeckner, E. 2004. Can aerosols spin down the water cycle in a warmer and moister world? Geophys. Res. Lett. 31, L06207.
- Lin, H. and Leaitch, W. R. (June 1997). Development of an in-cloud aerosol activation parameterization for climate modelling. In: Proceedings of the WMO Workshop on Measurement of Cloud Properties for Forecasts of Weather, Air Quality and Climate, Mexico City, 328–335.
- Lohmann, U., Stier, P., Hoose, C., Ferrachat, S., Kloster, S. and co-authors. 2007. Cloud microphysics and aerosol indirect effects in the global climate model echam5-ham. Atmos. Chem. Phys. 7, 3425–3446.
- Meehl, G. A., Arblaster, J. M. and Collins, W. D. 2008. Effects of black carbon aerosols on the indian monsoon. J. Climate 21,2869–2882.
- Ming, Y., Ramaswamy, V. and Persad, G. 2010. Two opposing effects of absorbing aerosols on global-mean precipitation. Geophys. Res. Lett. 37, L13701.
- Panicker, A. S., Pandithurai, G., Safai, P. D. and Prabha, T. V. 2016. Indirect forcing of black carbon on clouds over northeast india. Q.J.R. Meteorol. Soc. 142, 2968–2973.
- Quennehen, B., Raut, J.-C., Law, K. S., Ancellet, G., Clerbaux, C. and co-authors. 2016. Multi-model evaluation of short-lived pollutant distributions over east asia during summer 2008. Atmos. Chem. Phys. 16, 10765–10792.
- Shindell, D., Kuylenstierna, J. C. I., Vignati, E., van Dingenen, R., Amann, M. and co-authors. 2012. Simultaneously mitigating near-term climate change and improving human health and food security. Science 335, 183–189.
- Stevens, B., Giorgetta, M., Esch, M., Mauritsen, T., Crueger, T. and co-authors. 2013. Atmospheric component of the mpi-m earth system model: Echam6. J. Adv. Model. Earth Syst. 5, 146–172.
- Stier, P., Feichter, J., Kinne, S., Kloster, S., Vignati, E. and co-authors. 2005. The aerosol-climate model echam5-ham. Atmos. Chem. Phys. 5, 1125–1156.
- Stohl, A., Aamaas, B., Amann, M., Baker, L. H., Bellouin, N. and co-authors. 2015. Evaluating the climate and air quality impacts of short-lived pollutants. Atmos. Chem. Phys. 15, 10529–10566.
- Twomey, S. 1974. Pollution and the planetary albedo. Atmos. Environ. 8, 1251–1256.
- Vignati, E., Wilson, J. and Stier, P. 2004. M7: an efficient size-resolved aerosol microphysics module for large-scale aerosol transport models. J. Geophys. Res. Atmos. 109, D22202.
- Zelinka, M. D., Andrews, T., Forster, P. M. and Taylor, K. E. 2014. Quantifying components of aerosol-cloud-radiation interactions in climate models. J. Geophys. Res. Atmos. 119, 7599–7615.
- Zhang, K., O’Donnell, D., Kazil, J., Stier, P., Kinne, S. and co-authors. 2012. The global aerosol--climate model echam-ham, version 2: sensitivity to improvements in process representations. Atmos. Chem. Phys. 12, 8911–8949.