
 ?Mathematical formulae have been encoded as MathML and are displayed in this HTML version using MathJax in order to improve their display. Uncheck the box to turn MathJax off. This feature requires Javascript. Click on a formula to zoom.
Abstract
Emissions of polluted air in East Asia have gradually decreased over the last decade. Those air pollutants have been transported over long distances and influenced new particle formation (NPF) in the downstream region. We obtained 5-year data of the mobility size distribution and SO2 and particulate (PM2.5) emissions on Fukue Island (32.75°N, 128.68°E), Japan. Frequent NPF events in the 2013 campaign were observed around 60% under the transboundary transport of polluted air by northwesterly wind. In contrast to the data obtained in the last 2-year campaign (2016–2017), these NPF events (<25%) may reflect a relatively clean environment. The daily average SO2 and PM2.5 concentrations over the campaign periods are 2.3 ± 2.2 ppb and 17.6 ± 8.5 µg·m−3 (February 23 to March 7, 2013), 1.3 ± 0.9 ppb and 13.8 ± 4.7 µg·m−3 (February 27 to March 18, 2015), 0.8 ± 0.5 ppb and 14.7 ± 5.3 µg·m−3 (February 27 to March 25, 2016), and 0.5 ± 0.5 ppb and 12.1 ± 4.6 µg·m−3 (January 28 to April 19, 2017), respectively. These reductions of emissions may be due to the measures implemented by the local government in the source region to handle the adverse impacts of environmental pollution. The latest condition of atmospheric nanoparticles on Fukue Island can be used as an indicator to determine the concentration levels of regional air pollutants in East Asia.
1. Introduction
The air pollutants in East Asia that are released from various locations, such as desert, industrial, forest, urban and coastal areas, influence the environment. Primary aerosols, such as particulate matter (PM2.5 and PM1), black carbon (BC) and organic carbon (OC), as well as gaseous pollutants (SO2 and NOx), are emitted directly to the air and affect the air quality. Many researchers have reported various data about emission sources in East Asia, especially those in China (Hua et al., Citation2016; Li et al., Citation2016; Peng et al., Citation2016; Qiu et al., Citation2016; Wang et al., Citation2016; Wu et al., Citation2016; Xia et al., Citation2016; Xiong et al., Citation2016; Zhu and Chertow, Citation2016; Zheng et al., Citation2016). Xue et al. (Citation2016a) reported that the coal-fired industry in Beijing is one of the largest anthropogenic source contributors. Environmental pollution has become increasingly serious in the winter-to-spring season due to the increasing demand for indoor heating. Lang et al. (Citation2017) reported that the observed annual average PM2.5 concentration in Beijing was as high as 110 µg·m−3 in 2010 and that it tended to gradually decrease to 90 µg·m−3 in 2015. They also identified a similar trend in the annual average SO2 concentration in Beijing, which decreased from 30 to 10 µg·m−3 during the same period. Such a trend may be due to the intervention of local government in tackling further environmental damage using improved pollution control schemes rather than a business-as-usual scenario (Xue et al., Citation2016b).
PM2.5 and SO2 emitted from China and transported over long distances, as well as rapid increases in air-mass concentrations, are typically observed under high-pressure conditions in down-flow regions, such as Fukue Island, Japan, after facing the frontal passage (Kim et al., Citation2013; Citation2016). For instance, during transport, SO2 is oxidized by OH radicals into H2SO4 through photochemical processes and then converted into new secondary particles by homogeneous nucleation in the absence of pre-existing particles (Chandra et al., Citation2016). However, in the presence of pre-existing particles, some sulfuric acid will condense on them. Such competition adds more complexity to the new particle formation (NPF) and affects the particle size distribution.
Our group has conducted field observations at Fukue Island, Japan, since 2012. This site is located in the downstream region of the East-Asian plume, where local air pollution has no significant effect on the environment. During the first stage, we installed various instruments (i.e. mobility particle sizer, particle counter, black carbon and SO2 analyser and aerosol mass spectrometer) and observed NPF under the large-scale, long-range transport of polluted air masses (Seto et al., Citation2013). Then, we identified and classified NPF based on the initial size of particle formation and analysed its correlation with SO2 and PM2.5 concentrations and the chemical composition of pre-existing particles during the campaign period of 2013–2014 (Chandra et al., Citation2016). We found that the transboundary transport of precursor gas (SO2) and pre-existing particles (PM2.5) influences the formation rate of newly formed nanoparticles in Fukue Island, Japan. We investigated the NPF events in the 5-year campaign, particularly those in the winter-to-spring season, under the prevailing northwesterly winds. We focused on the decreasing sulfur dioxide (SO2) and particulate (PM2.5) emissions in East Asia in relation to the NPF.
2. Data and methods
Field observations were conducted on Fukue Island (32.75°N, 128.68°E), Japan, during the campaign period of 2013–2017 in the winter-to-spring season due to the highest emission of air pollutants occurring throughout this period. We analysed the data from 4 observation periods: February 23 to March 7, 2013; February 23 to March 18, 2015; February 27 to March 25, 2016 and January 28 to April 19, 2017. The island is located on the western coast of Kyushu Island, Japan, and it is recognized as an outflow region of air pollutants in East Asia (Takami et al., Citation2005; Seto et al., Citation2013; Chandra et al., Citation2016). The site is positioned on the northwestern side of the island, at 80 m above sea level (m a.s.l.) and approximately 1.5–4 km from the coast. The possible sources of local emissions, such as downtown regions and the airport, are located more than 10 km from the site and are obstructed by high altitudes of more than 200 m a.s.l. Therefore, the site is insignificantly affected by local anthropogenic emissions. As shown in , NPF events occurred under higher SO2 or higher SO42− concentrations. Higher organic concentrations do not necessarily represent evidence of biogenic emissions of NPF events, as indicated by Modini et al. (Citation2009). The effects of biogenic emissions on the NPF event in this study are minor.
During the first stage, in 2012, we measured the mobility size distribution between 14 and 670 nm and the particle number concentration using a Long-Scanning Mobility Particle Sizer (long-SMPS, TSI Inc.) system (Seto et al., Citation2013). NPF starts at sizes clearly below 10 nm (Kulmala et al., Citation2013); therefore, we added a Nano-SMPS (TSI Inc.) system to measure the mobility size distribution with the size range of 2.5–64 nm over the period of 2013–2015. We then replaced the Nano-SMPS with a 1 nm-SMPS (Dp > 1 nm) system composed of a nanodifferential mobility analyzer (1 nm-DMA) (model 3086, TSI, Inc.), a nano-enhancer (model 3777, TSI, Inc.), and a condensation particle counter (CPC) (model 3772, TSI, Inc.) in the 2016 campaign. We set a 3-min time resolution on every SMPS. Most recently, in the 2017 campaign, we used nano- and long-SMPS to obtain long-term field observations (82 days) and 1 nm-SMPS only for intensive observations. The PM2.5 mass concentration (measured by a Tapered Element Oscillating Microbalance (TEOM)) and chemical composition of pre-existing particles in PM1 (measured by an Aerodyne Aerosol Chemical Speciation Monitor (ACSM)) and SO2 concentration (model 43i, Thermo Scientific, Inc.) data were available from the observation system of the National Institute for Environmental Studies (NIES), Japan. The time resolutions of the TEOM and SO2 analyser are 60-min and 1-min signal averaging, respectively.
To investigate the air mass transport route reaching Fukue Island, the Hybrid Single-Particle Lagrangian Integrated Trajectory (HYSPLIT) model was used (http://www.arl.noaa.gov/HYSPLIT_info.php). The 48-h backward trajectories at the sampling altitude (80 m a.s.l.) were calculated every 1 h.
3. Results and discussion
3.1. Data trends of polluted air in the upstream and downstream regions
shows the monthly average (marked by symbols) and annual average (marked by lines) PM2.5 concentrations between 2010 and 2017. The PM2.5 concentration data in the upstream region (Beijing, Shenyang and Shanghai) were taken from the U.S. Embassy and Consulates in China (http://www.stateair.net/web/post/1/1.html) and were available online starting from January 2010 for Beijing, April 2013 for Shenyang, and January 2012 for Shanghai. Meanwhile, the PM2.5 concentration data in the downwind region of Fukue Island were measured by the Ministry of the Environment, Japan, starting from April 2013 (http://nagasaki-taiki.aa0.netvolante.jp/graph/monthly).
Fig. 1. The monthly average (marked by symbols) and annual average (marked by lines) PM2.5 concentrations between 2010 and 2017. The PM2.5 concentration data in the upstream region (Beijing, Shenyang and Shanghai) were taken from the U.S. Embassy and Consulates in China (http://www.stateair.net/web/post/1/1.html), and those in the downstream region (Fukue Island) were measured by the Ministry of the Environment, Japan (http://nagasaki-taiki.aa0.netvolante.jp/graph/monthly). The annual standard for PM2.5 in Japan (marked by red dots) is ≤15 µg·m−3.
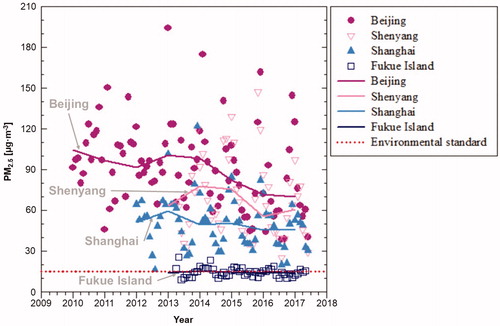
As clearly seen in , the monthly average recorded PM2.5 concentration was as high as 200 µg·m−3 in Beijing. The annual average PM2.5 concentration reached 100 µg·m−3 in 2010 and gradually decreased to 70 µg·m−3 in 2017. A slight difference in PM2.5 concentrations was observed in Shenyang and Shanghai, which recorded annual values of ∼60 and ∼50 µg·m−3, respectively. However, these concentrations are close to and within grade 2 based on the National Ambient Air Quality Standard (≤ 20 µg·m−3 for grade 1 and ≤60 µg·m−3 for grade 2, released by the Ministry of Environmental Protection of China, GB 3095-2012). Meanwhile, the annual average PM2.5 concentration at Goto station on Fukue Island was slightly stable at the level of 15 µg·m−3, which is close to the annual standard value for PM2.5 in Japan (≤15 µg·m−3; Wakamatsu et al., Citation2013) and ∼3–5 times lower than the concentration in the upstream region.
shows the SO2 concentration data in the upstream (Beijing, Liaoning and Shanghai) and downstream (Fukue Island) regions. The monthly average SO2 concentration data in Beijing, starting from August 2014, were taken from the Beijing Environmental Protection Bureau (http://www.bjepb.gov.cn/bjhrb/xxgk/ywdt/hjzlzk/dqhjzl/index.html) and the annual average SO2 concentration data from several cities (Beijing, Liaoning and Shanghai) of China in 2014–2016 reported by Song et al. (Citation2017). Meanwhile, the Ministry of the Environment, Japan, has monitored the SO2 concentrations on Fukue Island since January 2010 (http://nagasaki-taiki.aa0.netvolante.jp/graph/monthly). Notably, these emissions on Fukue Island may be influenced by local air pollution due to the station being located in the downtown area.
Fig. 2. The monthly average (marked by symbols) and annual average (marked by lines) SO2 concentration data between 2010 and 2017. The monthly average SO2 concentration data in Beijing were taken from the Beijing Environmental Protection Bureau (http://www.bjepb.gov.cn/bjhrb/xxgk/ywdt/hjzlzk/dqhjzl/index.html), and the annual average SO2 concentration data in Beijing, Liaoning and Shanghai were reported by Song et al. (Citation2017). The monthly and annual average SO2 concentrations on Fukue Island were measured by the Ministry of the Environment, Japan (http://nagasaki-taiki.aa0.netvolante.jp/graph/monthly).
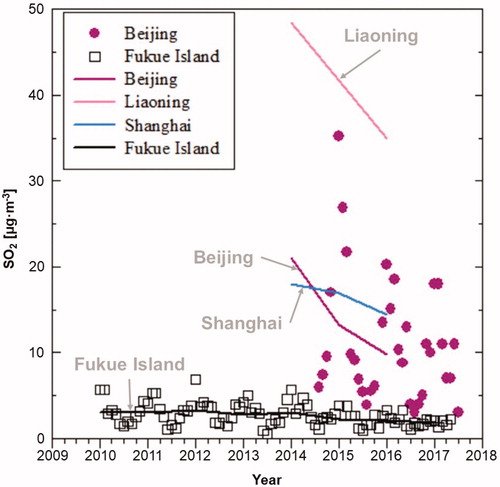
As shown in , the monthly average SO2 concentrations in Beijing ranged from 3 to 35 µg·m−3. The annual average SO2 concentrations in Beijing, Liaoning and Shanghai decreased gradually from 2014 to 2016. In Liaoning, the annual average SO2 concentration was as high as ∼50 µg·m−3 in 2014. A similar trend of SO2 concentration data was also reported by Jin et al. (Citation2016) for several cities (Beijing, Tianjin, Shanghai, Chengdu, Chongqing, Guangzhou and Shenzhen) in China. They reported that the concentrations of SO2 in 2010 varied from 10 to 60 µg·m−3 and decreased to ∼20 µg·m−3 by 2014. Meanwhile, the recorded monthly average SO2 concentrations (marked by black squares) were as high as 7 µg·m−3 in 2012 and decreased to ∼2 µg·m−3 in 2017.
3.2 Analysis of NPF
In a previous study (Chandra et al., Citation2016), we classified NPF into three types based on the initial stage of the particle formation process. represent the typical data for each type. A type-A event is a strong event when the NPF was observed to start from sub-10 nm in the morning (∼10:00) and grow into several tens of nanometres in a few hours (). As seen in , type-A was identified by a high concentration of SO2 (>1 µg·m−3) and low concentration of SO42– (<3 µg·m−3), suggesting a freshly formed air mass. The initial size of nucleation cannot be observed clearly in a type-B event (). In this type of event, the identified NPF starts from 10 nm around noon (∼13:00) under low SO2 concentrations, high SO42– concentrations and low sulfur oxidation ratio (SOR) values (). Just before the appearance of particles, the SO2 and SO42– concentrations are low, whereas the SOR is almost 1, indicating the presence of an aged air mass. We calculated the SOR as a distribution factor and expressed it as the ratio of non-sea salt sulfate (SO42–) to total sulfur (SO42– and SO2) during gas-to-particle formation using the following equation (Li et al., Citation2016):
Fig. 3. The classification of NPF and growth events on Fukue Island, Japan, divided into three types based on the initial stage of the particle formation process, that is, (a) starting from sub-10 nm (type-A), (b) starting from >10 nm (type-B) and (c) exhibiting no detectable formation or growth (type-C). These typical types were identified using SO2 and SO42– concentration data and sulfur oxidation ratio (SOR) values ((d)–(f)). The daily average PM2.5 concentration against the daily average SO2 concentration and NOAA HYSPLIT back trajectory for each day are shown in (g)–(l).
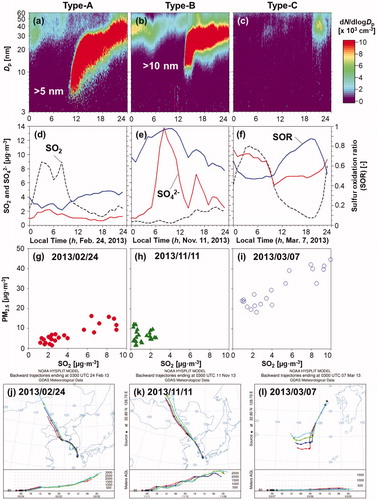
We used the hourly averaged SO42– concentration (µg·m−3) and SO2 gas concentration (ppb) data obtained from the ACSM and SO2 Analyzer, respectively. The SO2 concentration in the gas phase was converted from ppb to µg·m−3. Days characterised by no detectable formation or growth of new particles were classified as type-C (). SO2 concentrations were scattered from low to high concentrations, with high concentrations of PM2.5 ().
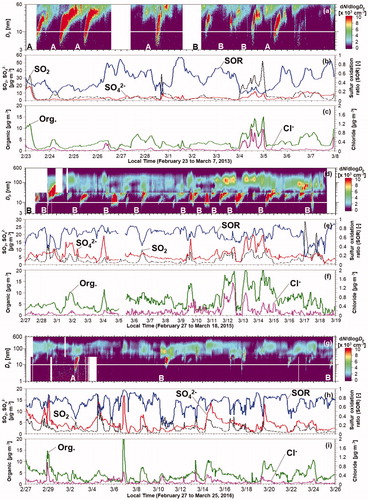
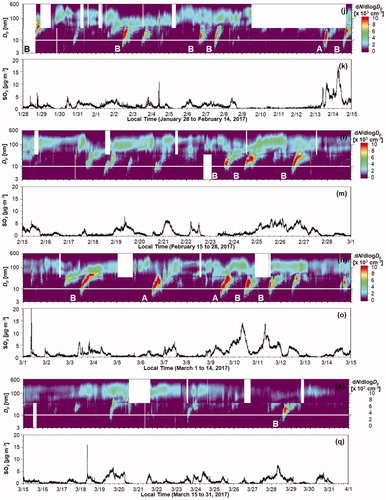
The NPF through the secondary organic aerosols from anthropogenic and/or biogenic precursors has been well observed and studied in both the field and laboratory (Baltensperger et al., Citation2005; Emanuelsson et al., Citation2013; Martinsson et al., Citation2017). We analysed the role of organic matter and chloride using ACSM data. shows the mobility size distribution measured by SMPS and the mass concentrations of organic matter and chloride measured by ACSM (PM1) on: February 23 to March 7, 2013 ((a), (b) and (c)); February 27 to March 18, 2015 ((d), (e) and (f)); February 27 to March 25, 2016 ((g), (h) and (i)); and January 28 to April 19, 2017 ((j–t)). As clearly seen in , some of the event days were identified with high concentrations of co-existing organic compounds and SO2, such as Feb. 23 and Mar. 4, 2013 and Mar. 9, 12 and 14, 2015. However, several non-event days were also observed under high concentrations of organic matter. This may be because secondary organic aerosols occurred in the upstream region and/or at high altitudes before coming to the site. Note that ACSM measured the aged air mass (PM1). Therefore, we speculate that the role of biogenic emissions in the NPF at the Fukue site is minor. We also measured the chloride contents to assess the presence of sea salt. All of the chloride concentrations are less than 2 µg·m−3. These results suggest that the ultrafine particles (Dp < 0.1 µm) were less contaminated by sea salt (<10%).
Fig. 4. Mobility size distribution (measured by SMPS), SO2 concentration (measured by SO2 Analyzer), mass concentrations of sulfate, organic and chloride (PM1; measured by ACSM) and sulfur oxidation ratio (SOR) on: February 23 to March 7, 2013 ((a), (b) and (c)); February 27 to March 18, 2015 ((d), (e) and (f)); February 27 to March 25, 2016 ((g), (h) and (i)); and January 28 to April 19, 2017 ((j)–(t)). Note that the ACSM data obtained in the 2017 campaign start from April 9, 2017.
The results of back trajectory analysis indicated that for event days (type-A and -B), air masses mostly came to Fukue Island by northwesterly wind, suggesting the transport of a polluted air mass (). However, in some cases of weak event days (type-B), the direction of the air mass changed; in other words, the air mass was transported to both the Asian continent and ocean. Meanwhile, several cases of air mass origins in type-C were identified under the conditions of short-range transport and low altitudes ().
The NPF events are identified by a sudden increase in the particle number concentration. We took the total number of particle concentrations from nano-SMPS (2.5 < Dp < 60 nm) for the 2013, 2015 and 2017 campaigns and from 1 nm-SMPS (1 < Dp < 30 nm) for the 2016 campaign. On event days, the particle number concentrations decreased to the ambient number of particles, ∼ 2 × 103 cm−3, before starting the nucleation process; then, they suddenly increased to more than 5 × 10³, sometimes exceeding 1 × 104 cm−3. The recorded total number concentrations were as high as 2.2 × 104 cm−3 in the 2013 and 2015 observation periods and decreased to less than 1.6 × 104 cm−3 in the last two years (2016–2017).
The growth rate of NPF is also an important indicator. The growth rate (GR) can be obtained by tracing the increased mode particle diameter (Dmode) during the growth of new particles (Dal Maso et al., Citation2005). The GR values of the NPF events during the campaign periods of 2013–2017 are 1.9–5.5 nm h−1, 1.1–4.1 nm h−1, 3.1–4.9 nm h−1 and 1.5–4.2 nm h−1, respectively. The influence of pre-existing particles was also calculated using the condensation sink (CS) formula from Dal Maso et al. (Citation2005). The identified CS values were as high as 2.9 × 10⁻² s−1 in 2013 and decreased to less than 1.3 × 10⁻² s−1 in 2017. In type-A events, GR and CS values decreased from 2013 to 2016. The larger GR and CS values in 2013 occurred under the conditions of higher SO2 concentrations (2.3 ± 0.8 ppb) and higher numbers of particulate concentrations (9.6 × 10³–19.3 × 103 cm−3). In 2016, the lower GR and CS values resulted in the suppression of NPF under lower SO2 concentrations (0.9 ± 0.9 ppb) and higher particulate number concentrations (15.5 × 103 cm−3). In 2017, almost the same values of GR and increased CS values compared to those in 2016 occurred under the conditions of lower SO2 (0.9 ± 0.4 ppb) and particulate number concentrations (6.3 × 10³–9.6 × 103 cm−3). In type-B events, the number concentrations and GR and CS values tended to decrease. These results suggest that the NPF mechanism and frequency varied along with drastic changes in the air quality transported from the Asian continent. We summarize the characteristics of the NPF and growth events at the Fukue site in .
Table 1. Characteristics of NPF and growth events at the Fukue site.
3.3 NPF affected by PM2.5 and SO2 concentrations
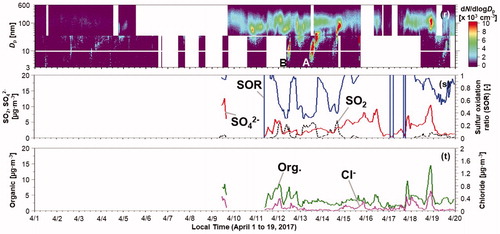
We plotted the daily average PM2.5 concentrations against the SO42– concentrations (). Note that the SO42– concentrations were measured by the ACSM, in which the transmission window of its inlet system ranges in aerodynamic diameter from 40 nm to 1 µm (PM1). Types-A, -B and -C are marked by different colours and shapes. As shows, days of each type of event were observed under low concentrations of pre-existing particles (< 20 µg·m−3), except on February 23, 2013 (when the PM2.5 concentration was 25.2 µg·m−3), March 4, 2013 (30.7 µg·m−3) and March 14, 2015 (24.6 µg·m−3). These days were identified to represent the large-scale transport of air pollutants with high concentrations of precursor gas (SO2) and pre-existing particles (PM2.5). Most of the type-A data points, however, were identified under low SO42– concentrations (< 5 µg·m−3), in contrast with type-B. This confirmed that a large fraction of SO2 was unconverted to the particle phase (sulfate). A slight difference was identified for the type-B and type-C events, which mostly occurred at high SO42– concentrations (> 5 µg·m−3), indicating that most of the sulfate was in the particle phase. Note that the PM2.5 concentration was higher in type-C events than in type-A and type-B events. This result suggested that type-A event days were observed at the regional scale under freshly formed nanoparticles and/or a mixed air mass; however, an aged air mass was identified for types-B and -C.
Fig. 5. The daily average PM2.5 concentration data plotted against the SO42– concentration data.
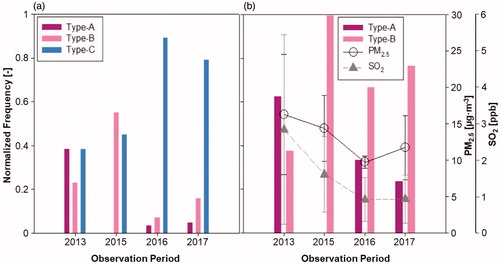
In , we show the contour plot of the mobility size distribution data from the nano- and 1 nm-SMPS obtained over four observation periods. As clearly seen in , strong NPF events were observed, and we identified 8 of 13 observation days as type-A (February 23–25, 28, and March 5) and type-B (March 2–4). In 2015, we cannot clearly observe type-A events (), and 11 event days were identified as type-B. Usually, the NPF shape formed a “banana curve” (Heintzenberg et al. (Citation2007) and Cheung et al. (Citation2011)); however, in the 2015 campaign, some event days were identified to form an arch-like shape (Yao et al. (Citation2010), Backman et al. (Citation2012), Young et al. (Citation2013), Cusack et al. (Citation2013), Skrabalova et al. (Citation2015) and Salma et al. (Citation2016)). It might be that the decrease in NPF events caused by dry ambient air decreased the vapor partial pressure over the particle surface under the conditions of low SO2 concentrations (< 1 ppb) and low solar radiation (< 600 W·m−2). Moreover, we only identified 3 event days in 28 field observation days in 2016 (). In 82 observation periods during the 2017 campaign, we observed 4 event days (4.9%) for type-A and 13 event days (15.9%) for type-B. Thus, the number of events in year-to-year observations appeared to decrease.
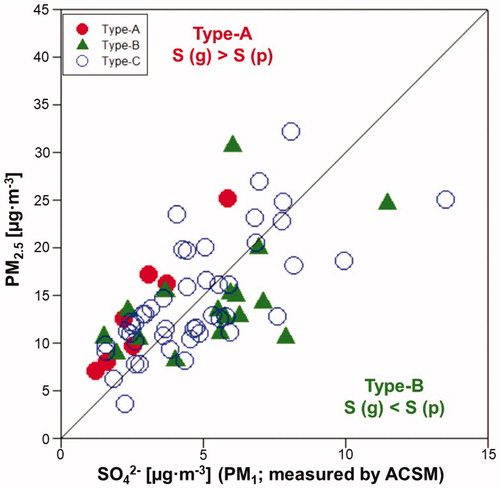
shows the normalized frequency of NPF events, which was estimated using the ratio of each event relative to all events, for every type, because the frequency of NPF events was different in every year. As is clearly shown in , the normalized frequency of NPF events has decreased. Type-A comprised ∼40% of events in 2013 and decreased to less than 5% in 2017. In 2015, more than 50% of NPF events were only type-B. In the last 2 years (2016–2017), these events comprised <20% of each campaign period. shows the normalized frequency for only the event days (type-A and type-B) and PM2.5 and SO2 concentrations for each period. In 2013, the events were dominantly type-A under high concentrations of SO2 and PM2.5. We used these concentration data (SO2 and PM2.5) from the average and standard deviation values of each campaign. However, these conditions shifted type-A events into type-B events. As is clearly shown in , the SO2 concentration decreased from ∼3 ppb in 2013 to ∼1 ppb in 2017 under slight decreases in PM2.5 concentrations. This condition significantly affected the decrease in the number of strong events in the last three years.
Fig. 6. The normalized frequency of NPF on Fukue Island, Japan, (a) on event and non-event days during the observation period and (b) only for the event days; PM2.5 and SO2 concentration data represent the average data in each campaign.
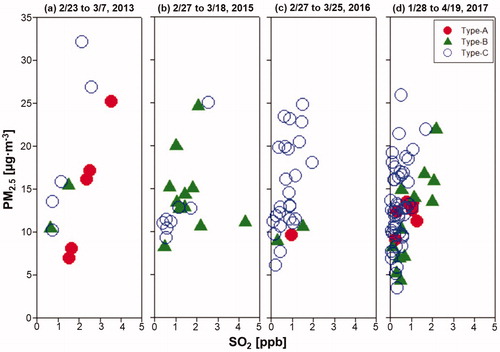
shows the daily average PM2.5 concentration against the SO2 concentrations over four periods in 5 years. In 2013, we observed large events when the SO2 concentration level was more than 1 ppb and the PM2.5 concentrations reached 35 µg·m−3. However, in the last 3 years (2015–2017), the PM2.5 concentration was relatively higher than the SO2 concentration. We did not observe large events during these years. The strong events (type-A) in the last 2 years may reflect a clean environment. This suggests that the SO2 emissions in the upstream region decreased due to the local government controlling gas emissions, for instance, through desulfurization technologies in large power plants (Kurokawa et al., Citation2013). Note that the daily average SO2 and PM2.5 concentrations in the 2013–2017 campaigns are 2.3 ± 2.2 ppb and 17.6 ± 8.5 µg·m−3, 1.3 ± 0.9 ppb and 13.8 ± 4.7 µg·m−3, 0.8 ± 0.5 ppb and 14.7 ± 5.3 µg·m−3 and 0.5 ± 0.5 ppb and 12.1 ± 4.6 µg·m−3, respectively. Therefore, the decrease in SO2 concentrations may have influenced the NPF events on Fukue Island, Japan.
Fig. 7. The daily average PM2.5 concentration data plotted against the SO2 concentration data for (a) February 23 to March 7, 2013; (b) February 27 to March 18, 2015; (c) February 27 to March 25, 2016 and (d) January 28 to April 19, 2017.
4. Conclusion
We performed the trend analysis of PM2.5 and SO2 since 2010 in the upstream (several cities in China) and downstream regions (Fukue Island, Japan) of anthropogenic substances that underwent long-range transport. The gradual decreases in the PM2.5 and SO2 concentrations between these two regions seemed to exhibit similar patterns. This condition significantly affected the number of events. In 2013, strong events were observed under high concentrations of PM2.5 and SO2. This result suggested that nucleation occurred through homogenous and heterogeneous processes. In 2015, we only observed the heterogeneous mechanism due to pre-existing particles that may have inhibited the nucleation rate. Strong events (type-A) reappeared in the last 2 years (2016–2017). A clean environmental background may have occurred due to certain policies in the upstream region. Therefore, the decreasing sulfur dioxide (SO2) and particulate (PM2.5) emissions in East Asia affected the NPF events on Fukue Island, Japan.
Additional information
Funding
References
- Backman, J., Rizzo, L. V., Hakala, J., Nieminen, T., Manninen, H. E. and co-authors. 2012. On the diurnal cycle of urban aerosols, black carbon and the occurrence of new particle formation events in springtime Sao Paulo, Brazil. Atmos. Chem. Phys. 12, 11733–11751.
- Baltensperger, U., Kalberer, M., Dommen, J., Paulsen, D., Alfarra, M. R. and co-authors. 2005. Secondary organic aerosols from anthropogenic and biogenic precursors. Faraday Discuss. 130, 265–278.
- Chandra, I., Kim, S., Seto, T., Otani, Y., Takami, A. and co-authors. 2016. New particle formation under the influence of the long-range transport of air pollutants in East Asia. Atmos. Environ. 141, 30–40.
- Cheung, H. C., Morawska, L. and Ristovski, Z. D. 2011. Observation of new particle formation in subtropical urban environment. Atmos. Chem. Phys. 11, 3823–3833.
- Cusack, M., Alastuey, A. and Querol, X. 2013. Case studies of new particle formation and evaporation processes in the western Mediterranean regional background. Atmos. Environ. 81, 651–659.
- Dal Maso, M., Kulmala, M., Riipinen, I., Wagner, R., Hussein, T. and co-authors. 2005. Formation and growth of fresh atmospheric aerosol: eight years of aerosol size distribution data from SMEAR II, Hyytiala, Finland. Boreal Environ. Res. 10, 323–336.
- Emanuelsson, E. U., Hallquist, M., Kristensen, K., Glasius, M., Bohn, B. and co-authors. 2013. Formation of anthropogenic secondary organic aerosol (SOA) and its influence on biogenic SOA properties. Atmos. Chem. Phys. 13, 2837–2855.
- Heintzenberg, J., Wehner, B. and Birmili, W. 2007. How to find bananas in the atmospheric aerosol’s: new approach for analyzing atmospheric nucleation and growth events. Tellus 59, 273–282.
- Hua, S., Tian, H., Wang, K., Zhu, C., Gao, J., and co-authors. 2016. Atmospheric emission inventory of hazardous air pollutants from China's cement plants: Temporal trends, spatial variation characteristics and scenario projections. Atmos. Environ. 128, 1–9.
- Jin, Y., Andersson, H. and Zhang, S. 2016. Air pollution control policies in China: a retrospective and prospects. Int. J. Environ. Res. Public Health 13, 1219.
- Kim, Y., Kim, S.-W., Yoon, S.-C., Park, J.-S., Lim, J.-H., and co-authors. 2016. Characteristics of formation and growth of atmospheric nanoparticles observed at four regional background sites in Korea. Atmos. Res. 168, 80–91.
- Kim, Y., Yoon, S.-C., Kim, S.-W., Kim, K.-Y., Lim, H.-C., and co-authors. 2013. Observation of new particle formation and growth events in Asian continental outflow. Atmos. Environ. 64, 160–168.
- Kulmala, M., Kontkanen, J., Junninen, H., Lehtipalo, K., Manninen, H. E. and co-authors. 2013. Direct observations of atmospheric aerosol nucleation. Science 339, 943–946.
- Kurokawa, J., Ohara, T., Morikawa, T., Hanayama, S., Janssens-Maenhout, G. and co-authors. 2013. Emissions of air pollutants and greenhouse gases over Asian regions during 2000–2008: regional Emission inventory in ASia (REAS) version 2. Atmos. Chem. Phys. 13, 11019–11058.
- Lang, J., Zhang, Y., Zhou, Y., Cheng, S., Chen, D. and co-authors. 2017. Trends of PM2.5 and chemical composition in Beijing, 2000–2015. Aerosol Air Qual. Res. 17, 412–425.
- Li, J., Li, Y., Bo, Y. and Xie, S. 2016. High-resolution historical emission inventories of crop residue burning in fields in China for the period 1990-2013. Atmos. Environ. 138, 152–161.
- Li, T.-C., Yuan, C.-S., Huang, H.-C., Lee, C.-L., Wu, S.-P. and co-authors. 2016. Inter-comparison of seasonal variation, chemical characteristics, and source identification of atmospheric fine particles on both sides of the Taiwan Strait. Sci. Rep. 6, 22956.
- Martinsson, J., Monteil, G., Sporre, M. K., Kaldal Hansen, A. M., Kristensson, A. and co-authors. 2017. Exploring sources of biogenic secondary organic aerosol compounds using chemical analysis and the FLEXPART model. Atmos. Chem. Phys. 17, 11025–11040.
- Modini, R. L., Ristovski, Z. D., Johnson, G. R., He, C., Surawski, N. and co-authors. 2009. New particle formation and growth at a remote, sub-tropical coastal location. Atmos. Chem. Phys. 9, 7607–7621.
- Peng, Y., Cui, J., Cao, Y., Du, Y., Chan, A. and co-authors. 2016. Impact of manufacturing transfer on SO2 emissions in Jiangsu Province, China. Atmosphere 7, 69.
- Qiu, X., Duan, L., Chai, F., Wang, S., Yu, Q. and co-authors. 2016. Deriving high-resolution emission inventory of open biomass burning in China based on satellite observations. Environ. Sci. Technol. 50, 11779–11786.
- Salma, I., Nemeth, Z., Weidinger, T., Kovacs, B. and Kristof, G. 2016. Measurement, growth types and shrinkage of newly formed aerosol particles at an urban research platform. Atmos. Chem. Phys. 16, 7837–7851.
- Seto, T., Kim, S., Otani, Y., Takami, A., Kaneyasu, N. and co-authors. 2013. New particle formation and growth associated with East-Asian long-range transportation observed at Fukue Island, Japan in March 2012. Atmos. Environ. 74, 29–36.
- Song, C., Wu, L., Xie, Y., He, J., Chen, X. and co-authors. 2017. Air pollution in China: status and spatiotemporal variations. Environ. Pollut. 227, 334–347.
- Skrabalova, L., Zikova, N. and Zdimal, V. 2015. Shrinkage of newly formed particles in an urban environment. Aerosol Air Qual. Res. 15, 1313–1324.
- Takami, A., Miyoshi, T., Shimono, A. and Hatakeyama, S. 2005. Chemical composition of fine aerosol measured by AMS at Fukue Island, Japan during APEX period. Atmos. Environ. 39, 4913–4924.
- Wang, K., Tian, H., Hua, S., Zhu, C., Gao, J. and co-authors. 2016. A comprehensive emission inventory of multiple air pollutants from iron and steel industry in China: temporal trends and spatial variation characteristics. Sci. Total Environ. 559, 7–14.
- Wakamatsu, S., Morikawa, T. and Ito, A. 2013. Air pollution trends in Japan between 1970 and 2012 and impact of urban air pollution countermeasures. Asian J. Atmos. Environ. 7, 177–190.
- Wu, Y., Gu, B., Erisman, J. W., Reis, S., Fang, Y. and co-authors. 2016. PM2.5 pollution is substantially affected by ammonia emissions in China. Environ. Pollut. 218, 86–94.
- Xia, Y., Zhao, Y. and Nielsen, C. P. 2016. Benefits of China's efforts in gaseous pollutant control indicated by the bottom-up emissions and satellite observations 2000-2014. Atmos. Environ. 136, 43–53.
- Xiong, T., Jiang, W. and Gao, W. 2016. Current status and prediction of major atmospheric emissions from coal-fired power plants in Shandong Province, China. Atmos. Environ. 124, 46–52.
- Xue, Y., Tian, H., Yan, J., Zhou, Z., Wang, J. and co-authors. 2016a. Temporal trends and spatial variation characteristics of primary air pollutants emissions from coal-fired industrial boilers in Beijing, China. Environ. Pollut. 213, 717–726.
- Xue, Y., Zhou, Z., Nie, T., Wang, K., Nie, L. and co-authors. 2016b. Trends of multiple air pollutants emissions from residential coal combustion in Beijing and its implication on improving air quality for control measures. Atmos. Environ. 142, 303–312.
- Yao, X., Choi, M. Y., Lau, N. T., Lau, A. P. S., Chan, C. K. and co-authors. 2010. Growth and shrinkage of new particles in the atmosphere in Hong Kong. Aerosol Sci. Technol. 44, 639–650.
- Young, L.-H., Lee, S.-H., Kanawade, V. P., Hsiao, T.-C., Lee, Y. L. and co-authors. 2013. New particle growth and shrinkage observed in subtropical environments. Atmos. Chem. Phys. 13, 547–564.
- Zheng, J., Jiang, P., Qiao, W., Zhu, Y. and Kennedy, E. 2016. Analysis of air pollution reduction and climate change mitigation in the industry sector of Yangtze River Delta in China. J. Clean. Prod. 114, 314–322.
- Zhu, J. and Chertow, M. R. 2016. Greening industrial production through waste recovery: “Comprehensive utilization of resources” in China. Environ. Sci. Technol. 50, 2175–2182.