
 ?Mathematical formulae have been encoded as MathML and are displayed in this HTML version using MathJax in order to improve their display. Uncheck the box to turn MathJax off. This feature requires Javascript. Click on a formula to zoom.
Abstract
Atmospheric broadband transmissions of clouds, aerosols, and ozone in the erythemally weighted ultraviolet (EUV, 290–320 nm), total (spectrally integrated) ultraviolet (TUV, 290–363 nm), and total global solar (GS, 305–2800 nm) spectral regions were analysed with ground-based measurements in Seoul, Korea (37.57°N, 128.98°E) from March 2004 to February 2013. The annual average total transmission expressed as a fraction of the clear-sky irradiance was 77.6% in the EUV, 73.6% in the TUV, and 72.0% in the GS spectral regions. The corresponding values for cloud transmission were 78.4%, 73.9%, and 71.7%. In overcast cloudy conditions, atmospheric transmission was reduced by 45.9%, 50.2%, and 56.6% in the three spectral regions, respectively, indicating the dominant effect of clouds. Aerosol and ozone transmissions had almost the same annual average. Annual average atmospheric transmission effectively decreases with increasing wavelength from EUV to GS regions. However, we found that there was a difference in wavelength dependence of atmospheric transmission for monthly averages, which seems related to the monthly variation of total column ozone (TCO), aerosol, and cloud amount. It is also found that there is a critical value of TCO (TCO =370 DU) for the wavelength dependence of transmission. Higher ozone amount than this turnaround value can cause an increase in transmission from the EUV to GS regions. The monthly wavelength-dependent effects may be attributable more to the different climatological characteristics of the TCO rather than aerosols and clouds.
1. Introduction
Solar radiation that is converted into heat and chemical energy is responsible for sustaining all life and motion on Earth. It is, therefore, a key factor in understanding the energy distribution in the Earth’s climate system. In particular, even though ultraviolet (UV) radiation is only a tiny part of the total solar radiation, it has significant biological effects on human, plants, and animals. Regarding human health, while exposure to UV irradiance increases vitamin D levels, it poses several health risks, such as the promotion of skin aging and skin cancers (Sivamani et al., Citation2009). Since these UV-induced biological effects depend on the wavelength of the solar radiation, it is necessary to have more information on the spectral dependence of solar radiation in specific regions’ to understand the harmful and the beneficial effects.
The main factors affecting ground-level solar irradiance are solar elevation, clouds, aerosols, and ozone. While the solar elevation can be determined accurately using geometrical and astronomical equations, the variations of solar radiation scattered and absorbed by clouds, aerosols, and ozone in the atmosphere are difficult to predict because of their complex interactions (Bano et al., Citation2013). Since the effects of clouds, aerosols, and ozone on solar radiation are also wavelength-dependent, it is essential to evaluate the transmission of clouds, aerosols, and ozone in different wavelength regions of the solar spectrum: that is, in the erythemal ultraviolet (EUV), total ultraviolet (TUV), and global solar (GS) regions.
There have been many studies of the atmospheric transmission of solar radiation. For example, Cho and Kang (Citation1984) compared atmospheric aerosol turbidity data with equivalent data obtained from 57 stations of the World Meteorological Organization (WMO) Global Background Air Pollution Network from 1972 to 1978. They showed that the value of sea-level turbidity in Seoul is quite close to the mean value in the Northern Hemisphere, even though the turbidity in Seoul is higher than at most other stations. Although there have been several previous studies of the effect of aerosol on atmospheric transmission (e.g. Anton et al., Citation2008), its wavelength dependence has not been extensively studied yet, except in model simulations (e.g. Erlick and Frederick, Citation1998a, Citation1998b; Eltbaakh et al., Citation2012). Also, cloud transmission of total UV and GS radiation has been extensively studied from a statistical point of view, with different characteristics depending on location (e.g. Ilyas, Citation1967; Iqbal, Citation1983; Frederick and Snell, Citation1990; Schafer et al., Citation1996; Kuchinke and Nunez, Citation1999; Foyo-Moreno et al., Citation2001; Sabburg and Parisi, Citation2006; Serrano et al., Citation2015). In particular, some experimental studies of the wavelength dependence of the transmission showed that clouds cause slightly less attenuation in the UV than in the visible region (e.g. Frederick and Snell, Citation1990; Krotkov et al., Citation1996; Seckmeyer et al., Citation1996; Frederick and Erlick, Citation1997; Calbó and González, Citation2005; Sabburg and Parisi, Citation2006; Lindfors and Arola, Citation2008; Park et al., Citation2016). Moreover, there has been little information on transmission through ozone relative to that through clouds and aerosols, despite the fact that ozone is one of the important factors affecting UV.
In this study, the atmospheric broadband transmission properties of clouds, aerosols, and ozone are investigated under all-sky conditions in terms of the different spectral regions of the erythemally weighted UV (EUV; 290–320 nm), total UV (TUV; 290–363 nm), and GS radiation (305–2800 nm) using observations. In addition, the influence of clouds, aerosols, and ozone on the spectrally dependent atmospheric transmission is quantitatively evaluated using solar irradiance measurements from Seoul.
2. Instrumentation and data
The Dobson and Brewer spectrophotometers used in this study were described in detail by Kim et al. (Citation2013, Citation2014) and Cho et al. (Citation2003). The Global Environment Laboratory at Yonsei University in Seoul (37.57°N, 126.98°E; 86 m a.s.l.) has been running a long-term ozone-layer monitoring program in the framework of the Global Ozone Observing System of the WMO/Global Atmospheric Watch/Global Ozone Observing System (WMO/GAW/GO3OS, Station #252) since May 1984. Daily measurements of total column ozone (TCO) and its vertical distribution are made with a Dobson spectrophotometer (Beck #124) (Komhyr, Citation1980; Komhyr et al., Citation1989; Evans and Komhyr, Citation2008) located on the rooftop of the Science Hall of Yonsei University, which enables TCO estimates to within 2% accuracy (Kim et al., Citation2005; Park et al., Citation2012). TCO measurements and the vertical ozone distribution are obtained using the Umkehr method, and instrumental calibration using mercury and standard lamp tests is performed regularly. Since 2007, major components of the operations have been automated with the aid of new hardware and visual displays (Miyagawa et al., Citation2005). This system takes full advantage of a WindowsTM (Microsoft Corp.) interface and information technology, adapted to the latest WindowsTM PC, and a flexible data-processing system designed to operate the Dobson spectrophotometer and testing devices. Thus, subjective human error and individual differences are eliminated by this automation in instrument operation and data processing. Therefore, the ozone data quality has been distinctly improved since the start of automated measurements. The detailed calibration history of the instrument was documented by Kim et al. (Citation2007).
A SCI-TEC Instruments Inc. model MKIV Brewer spectrophotometer (#148) from Seoul has also been operated routinely since October 1997 at the same site, to measure the direct UV spectral solar beam at five wavelengths (306.3, 310.1, 313.5, 316.7, and 320.1 nm) optimised for ozone, sulphur dioxide, and aerosol measurements. These direct spectral measurements are performed at intervals of 5–10 min. The aerosol optical depth (AOD) at a given wavelength is calculated as the residual optical depth after subtraction of molecular scattering, and of ozone and sulphur dioxide absorption, from the total atmospheric optical depth (Meleti and Cappellani, Citation2000; Gröbner et al., Citation2001; Cheymol and De Backer, Citation2003). The Brewer spectrophotometer is designed for 1% accuracy (Park et al., Citation2012) in direct-sun TCO measurements and it is mounted on a solar tracker to measure the direct solar beam. The Brewer instrument is also used to measure the global UV spectral irradiance (290–363 nm in 0.5 nm intervals) on horizontal surfaces. The irradiance at each wavelength is integrated to produce TUV irradiance and EUV value weighted by the McKinlay–Diffey erythemal action spectrum (McKinlay and Diffey, Citation1987). Several lamp tests are performed regularly each day to ensure that the Brewer instrument is in good condition. Wavelength calibration of the instrument is carried out before each session using an internal mercury lamp, and absolute calibration is achieved based on external lamp tests, compared with 50 W standard lamps (tungsten halogen), calibrated to the standards of the National Institute of Standards and Technology. A standard lamp is used as a reference for the relative sensitivity. In addition to these calibrations, between 2004 and 2013 the Brewer #148 was regularly recalibrated for UV, ozone, and aerosol measurements against the traveling standard Brewer #017 by the International Ozone Service, Canada, at Yonsei University, specifically on 10–16 March 2004, 24–25 February 2006, 24 October and 3 November 2007, 16 October 2009, 21 November 2011, and 7 August 2013.
This study uses daily data for GS irradiance, UV, cloud cover amount (CC), AOD (at 320.1 nm), and TCO for the period from March 2004 to February 2013. CC and the GS irradiance were obtained from the Seoul Meteorological Station of the Korea Meteorological Administration (KMA), located approximately 3 km to the east of Yonsei University and within the local scale of our study site (102–104 m) (e.g. Stewart and Oke, Citation2012). The GS irradiance was measured with a Kipp & Zonen CM21 pyranometer, covering a wavelength range of 305–2800 nm. Data were recorded over 1 min periods in units of W m−2 using Campbell Scientific CR21X data loggers, and they were archived as hourly integrals. The CC was observed visually and expressed in tenths of the sky covered by clouds, according to WMO standards. The daily CC was obtained by averaging eight times observations in a day (03:00–00:00 local standard time). The climatological (1981–2011) relative humidity (RH) was provided by the KMA.
3. Methodology
In this study, the variations of surface solar radiation (SSR) covering the GS, TUV, and EUV irradiance are considered to be functions of the solar zenith angle (Z), CC (in tenths), AOD (unitless, at 320.1 nm), and TCO (in Dobson units; DU) as expressed in EquationEquation (1)(1)
(1) . SSR values are mainly utilised in the calculation of broadband transmission:
(1)
(1)
Although the details are not specifically mentioned here, the water vapor mixing ratio (WV) was not used as a parameter to estimate SSR because the lack of major WV absorption lines in the UV and visible meant that its contribution to SSR was found to be negligible. Although WV absorption is important in the IR, its impact on GS was also negligible due to the wider spectral coverage. The WV effect is partially included in CC.
The atmospheric transmission (T) is defined as the ratio of measured SSR (SSRm) to reference SSR (SSRc). SSRc here is defined as cloudless irradiance in the broadband solar, total UV, and EUV spectral bands. Section 3.1 describes the calculation of a reference value, Section 3.2 describes the atmospheric transmission, and Section 3.3 describes the correction methodology.
3.1. Reference value for clear-sky irradiance in transmission
The estimates of the SSRc corresponding to the clear-sky irradiance, with the smallest influence of CC, AOD and with TCO values closest to the reference, are essential to calculate T. If the sun is directly overhead (Z = 0), then the SSR is equal to So where So are the direct and diffuse irradiance under cloudless skies, respectively. If Z > 0, then a unit area normal to the sun’s rays is projected on a horizontal surface. Thus, the SSR measured on a unit horizontal area is given by
(2)
(2)
To estimate the reference values for the transmission, a clear-sky model was constructed based on harmonic analysis (e.g. Wilks, Citation2011), using a cosine function enveloping the maximum readings in the plot of daily SSR data (). This is in contrast to previous studies that used a radiative-transfer model (e.g. Schafer et al., Citation1996; Sabburg and Parisi, Citation2006; Park et al., Citation2016). The model can be expressed as:
(3)
(3)
where
is SSRc at time t (the day of year),
is the average value of
, n = 365, A is amplitude and
is the phase angle. Based on real SSR measurements, EquationEquation (3)
(3)
(3) enables us to develop a reference SSR model showing the possible daily maximum SSR through the year. Then a reference SSR value, SSRc, can be acquired at each day for EUV, TUV, and GS broadband. Details of the harmonic analysis for a clear-sky model in EquationEquation (3)
(3)
(3) are included in .
Fig. 1. Annual cycles of the daily integrated SSR for the maximum possible clear-sky solar irradiance (reference value) and the all-sky average irradiance for (a) EUV, (b) TUV, and (c) GS total spectrum from March 2004 to February 2013. The solid and dashed lines show the envelope curves of the data maxima and the curves of the all-sky average values, respectively.
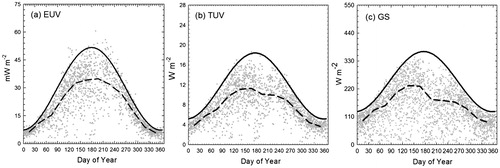
Table 1. Results of the harmonic analysis for the clear-sky model (EquationEquation 3(3)
(3) ).
shows the annual cycles of daily mean SSR values in the EUV-, TUV-, and GS-ranges observed in Seoul from March 2004 to February 2013. The envelope cosine curve obtained from EquationEquation (3)(3)
(3) is superimposed on each panel. This curve encompassing all daily data points indicates the maximum possible clear-sky irradiance to obtain the SSRc. The maximum irradiance matches the upper envelope curve of the data (i.e. in theory T should range from 0 to 1, although values may exceed 1; see section 4.5), with a few data points above the line that coincide with partly cloudy conditions and relatively high solar elevation, where scattering and multiple reflections from the edges of the scattered clouds cause enhancements over clear-sky values (e.g. Madronich, Citation1993; Mims III and Frederick, Citation1994; Kim et al., Citation2013; Nunez et al., Citation2016). The modelled clear-sky (maximum possible) solar irradiance was used to calculate the SSRc for the atmospheric transmission.
3.2. Atmospheric transmission
The atmospheric transmission (T) is normalised and defined as the ratio of the measured SSR (SSRm) under the influence of specific meteorological parameters to the corresponding radiation for a clear sky, following previous studies (e.g. Frederick and Steele, Citation1995; Schafer et al., Citation1996; Kuchinke and Nunez, Citation1999; Josefsson and Landelius, Citation2000):
(4)
(4)
where T′ is the atmospheric slant transmission. The i index represents the selected broadband ranges such as EUV, TUV, or GS of the SSR. Note that in other studies cloud transmission has been examined with different definitions such as an attenuation factor (Frederick and Erlick, Citation1997) or a cloud modification factor (Calbó and González, Citation2005).
In this study, we calculated the daily total transmission using the 9-year time series of measurements. First, we obtained a daily slant transmission (T′) from daily representative measurements. Second, we converted this slant-column value to the total-column transmission using Z. Local noon time, which corresponds to the highest solar elevation Z0, is taken as the standard time for this conversion process. The relation between the slant transmission (T′) and the zenith transmission (T) is
(5)
(5)
where m refers to the relative optical air mass (≈ sec Z0), and cos (Z0) can be expressed using various geometrical factors as,
(6)
(6)
where
,
, and
are the hour angle, the latitude, and the solar declination, respectively (e.g. Iqbal, Citation1983). As a result, the daily m is obtained at local noon (
= 0) in this study. Then finally, atmospheric transmission is represented in the zenith direction (i.e. T = T′1/m) and, hereafter, we use this definition of atmospheric transmission.
3.3. SSR data corrections for cloud, aerosol, and ozone transmissions
To calculate the individual transmissions of cloud, aerosol, and ozone, other factors should be identical to the reference condition. As SSRc represents the climatological maximum SSR with the highest solar elevation at each day of the year, we can assume that the atmosphere is not perturbed by clouds (CC) and aerosol (AOD), and the total column ozone amount (TCO) is the climatological mean. To calculate cloud (TCC), aerosol (TAOD), and ozone (TTCO) transmission, the influence of other factors (e.g. AOD and TCO in the TCC calculation, CC and TCO in the TAOD calculation, and CC and AOD in TTCO calculation) should be removed. This is achieved using the following procedure. EquationEquation (7)(7a)
(7a) is the expression for
(i, j), where ‘j’ indicates the associated meteorological parameters to denote CC, AOD, or TCO, and i is the wavelength range:
(7a)
(7a)
(7b)
(7b)
(7c)
(7c)
where Z0 is the solar zenith angle at local noon, and
,
and
indicate the climatological average CC, AOD and TCO values at each day of the year.
Apart from the factor of interest, the other factors are considered to be subject to constant atmospheric conditions, and we use climatological mean values at each day of the year. As a result, all daily SSR data are corrected as EquationEquation (8)(8a)
(8a) .
(8a)
(8a)
(8b)
(8b)
(8c)
(8c)
For the correction process, a radiation amplification factor (RAF) (e.g. Madronich, Citation1993; Booth and Madronich, Citation1994; Kim et al., Citation2014) is utilised to relate the respective sensitivities of CC, AOD, and TCO to the SSR variability. The RAFs (i.e. the sensitivity coefficients) are multiplied by the fractional difference between the other factors on the relevant day and the climatological value. The RAFs used in this study () are obtained from the previous study based on long-term ground-based measurements (Kim et al., Citation2014). The annual mean correction ratios of to
for EUV, TUV, and GS regions are presented in . Therefore, cloud, aerosol, and ozone transmission (TCC, TAOD, and TTCO) can be expressed as EquationEquation (9)
(9a)
(9a) and then converted to total-column atmospheric transmission using EquationEquation (5)
(5)
(5) .
(9a)
(9a)
(9b)
(9b)
(9c)
(9c)
Table 2. RAFs used in EquationEquation (8)(8a)
(8a) (Kim et al. Citation2014).
Table 3. Annual mean correction ratios of the corrected SSR (EUV, TUV, and GS) to the measured SSR.
4. Results and discussion
4.1. Climatology of solar radiation and associated parameters
illustrates the annual cycles of the climatological monthly mean surface solar irradiance (SSI) for the EUV, TUV, and GS regions together with the associated meteorological parameters (CC, AOD at 320.1 nm, and TCO) under all sky conditions in Seoul from March 2004 to February 2013. In , EUV irradiance varied in the range from 5.8 ± 1.1 (December) to 34.9 ± 8.2 mW m−2 (July), with an annual average value of 21.1 ± 4.6 mW m−2. The TUV value varied from 3.6 ± 0.6 (December) to 11.3 ± 2.7 W m−2 (June) with an annual average of 7.7 ± 1.6 W m−2, whereas the GS irradiance varied from 85.9 ± 19.1 (December) to 232.7 ± 53.8 W m−2 (May) with an annual average of 159.1 ± 37.9 W m−2. The seasonal variations are characterised by maximum values in May for the GS irradiance, in June for the TUV, and in July for EUV irradiance, whereas minimum values for all three bands are observed in December.
Fig. 2. Annual cycles of monthly mean (a) SSI (GS, TUV, and EUV irradiances), number of data to the left vertical axis, and (b) CC, AOD (at 320.1 nm), TCO, and RH, over the period from March 2004 through February 2013.
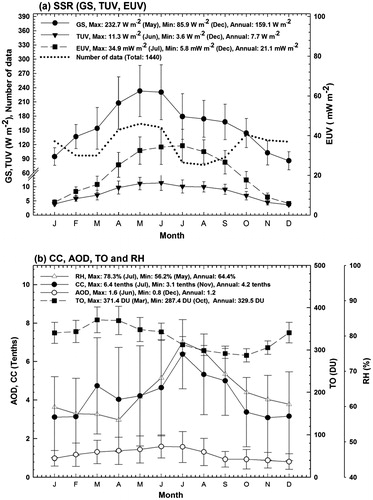
The monthly difference in the occurrence of the maximum GS, TUV, and EUV radiation can be explained by the increased atmospheric water vapor level during the pre-rainy season characterised by relatively high CC and RH (). Water vapor significantly reduces the solar longwave irradiance at the surface through radiative absorption, but allows the shortwave (i.e. UV) irradiance to reach the ground, resulting in a decrease of GS but an increase of UV in summer. The contribution of the TUV to the GS (TUV/GS) varied from 4.1 to 5.7% (annual average 4.8%) on a monthly basis, while that of the EUV (EUV/GS) ranged from 6.7 10−3% to 19.5
10−3% (annual average 12.3 × 10⁻³%).
The clear-sky model gives annual averages of possible maximum irradiances (clear-sky irradiance) of 248.0 and 11.8 W m−2 for GS and TUV, respectively, but 29.4 mW m−2 for the EUV. The annual ranges of EUV, TUV, and GS irradiances from the minimum in December to the maximum in June were between 8.0 and 51.1 mW m−2, 5.3 and 18.2 W m−2, and 132.4 and 364.4 W m−2, respectively (). The difference between estimated clear-sky irradiance and the daily maximum irradiance was very small in general in the EUV, TUV, and GS regions except in summer. GS had a lower correlation coefficient and larger intercept than TUV and EUV, as GS includes longer wavelengths and is thus more affected by relative humidity or water vapor than other wavelength regions. Therefore, daily maximum clear-sky irradiance was smaller than expected in summer.
The annual cycles of the monthly average CC, AOD (320.1 nm), and TCO are presented in . The CC varied between 3.1 ± 2.2 (November) and 6.4 ± 1.8 tenths (July) with an average annual value of 4.2 ± 2.2 tenths CC, and similarly the AOD pattern varied in the range from 0.8 ± 0.4 (December) to 1.6 ± 0.6 (June) with an annual average of 1.2 ± 0.6. The TCO varied from 287.4 ± 15.8 (October) to 371.4 ± 30.3 DU (March) with an annual average value of 329.5 DU.
4.2. Total, cloud, aerosol, and ozone transmissions
The ratio of all-sky measurements (SSRm) to the corresponding values calculated from the clear-sky model (EquationEquation 3(3)
(3) ) (SSRc) provides estimates of the daily transmission in the EUV, TUV, and GS regions based on EquationEquation (4)
(4)
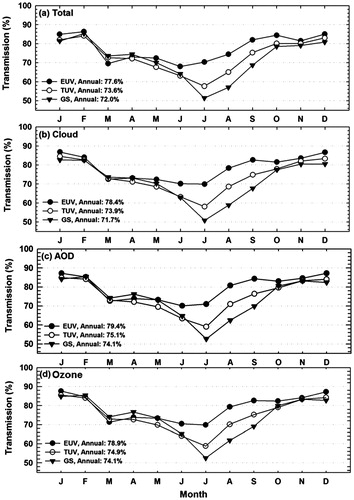
(4) . The annual cycles of the total, cloud, aerosol, and ozone transmissions are presented in . The transmission is expressed as a fraction of the clear-sky irradiance. As shown in for the total transmission, the EUV transmission ranged between 68.0% (June) and 86.3% (February) with an annual average of 77.6%, the TUV transmission ranged from 57.6% (July) to 84.1% (February) with an annual average value of 73.6%, and the GS transmission spanned the range from 51.4% (July) to 85.3% (February) with an annual average of 72.0%.
Fig. 3. Annual cycles of (a) total, (b) cloud, (c) aerosol, and (d) ozone transmission in the EUV, TUV, and GS irradiances.
To calculate the individual cloud, aerosol, and ozone transmissions, the SSR (EUV, TUV, and GS) values were corrected for one factor while the other two were kept constant. Thus cloud transmission was calculated under constant AOD and TCO atmospheric conditions, using EquationEquation (8)(8b)
(8b) , and a similar procedure applied for aerosol transmission under constant CC and TCO atmospheric conditions, and for ozone transmission under constant CC and AOD atmospheric conditions. Then, from the corrected SSR values, the individual transmission of clouds, aerosols, and ozone was also calculated, and the results obtained are shown in , respectively. The annual patterns of monthly average cloud transmission for the EUV, TUV, and GS regions () reached their minimum of 69.9%, 58.0%, and 50.8% in July with an annual average of 78.4%, 73.9%, and 71.7%, respectively, with the maximum CC during the rainy season. The corresponding maximum cloud transmissions of 86.8%, 84.5%, and 82.6% were in January in all three spectral regions. As shown in , the aerosol transmission ranged from 70.1% (June) to 87.2% (January) with an annual average of 79.4% in the EUV, from 59.1% (July) to 84.9% (January) with an annual average of 75.1% in the TUV, and from 52.7% (July) to 85.4% (February) with an annual average of 74.1% in the GS. This represents increased scattering at shorter UV wavelengths than at longer wavelengths. Cho and Kang (Citation1984) investigated aerosol characteristics using the WMO/National Oceanic and Atmospheric Administration/Environmental Protection Agency (NOAA/EPA) atmospheric turbidity data (1972–8) measured at 57 WMO air-pollution network stations, including Seoul. Their results showed that over this period the monthly average and minimum AOD at 500 nm at sea level in the Northern Hemisphere are 0.18 and 0.01, respectively, corresponding to AOD transmissions of 66.0% and 80.0%. The annual values of the monthly average and minimum AOD in Seoul are 0.19 and 0.103, corresponding to aerosol transmissions of 65% and 79%, respectively. Therefore, the transmissions in Seoul are quite close to the northern Northern Hemispheric sea-level averages, even though the Seoul values are higher than the equivalent values at over the 57 stations. As shown in , the ozone transmission ranged from 69.8% (July) to 87.6% (January) with an annual average of 78.9% in the EUV, from 58.8% (July) to 85.5% (January) with an annual average of 74.9% in the TUV, and a range of 52.5% (July) to 85.4% (February) with an annual average of 74.1% in the GS region. Consequently, the annual averages of atmospheric transmission have similar values in the different spectral regions. It is comparable results as expected from with the range of the correction ratio between 1.02 and 0.99.
4.3. Transmission grouped by CC, AOD, and TCO values
To evaluate cloud transmission grouped by CC values, the corrected SSR using the AOD and TCO from EquationEquation (8a)(8a)
(8a) is grouped into six categories, ‘clear sky’ (0 tenths), 1–2, 3–4, 5–6, 7–8 tenths, and overcast (9–10 tenths) in the EUV, TUV, and GS regions. The cloud transmissions in the EUV, TUV, and GS regions were analysed for all groups. Similarly, for the aerosol transmissions, the corrected SSR using the CC and TCO are grouped into seven categories defined by AODs of 0–0.4 for clean and 2.5–4.0 for high aerosol loadings with intervals of 0.4. For ozone transmission, the corrected SSR using the CC and AOD are assigned to eight groups between 310 DU and 400 DU for TCO with intervals of 15 DU.
As listed in , the cloud transmission decreases with increasing CC such that the transmission for overcast-sky conditions (9–10 tenths CC) resulted in 54.1%, 49.8%, and 43.4% for the EUV, TUV, and GS regions, respectively. Typical transmissions in the EUV, TUV, and GS regions were 69.2%, 61.6%, and 56.0% for 7–8 tenths CC, 74.9%, 69.2%, and 64.5% for 5–6 tenths CC, and 79.3%, 75.5%, and 73.8% for 3–4 tenths CC, respectively. Under clear-sky conditions, CC <1.0, the transmission shows the opposite spectral dependence with 87.4%, 86.8%, and 89.6% in the three spectral regions, respectively. The wavelength dependence of transmission caused by clouds reflects the fact that the dependency tends to be larger with overcast-clouds. The results of this study are similar to those of Schafer et al. (Citation1996), who reported the dependence of cloud transmission at Z = 50° at Black Mt., NC, USA (35.66°N, 82.38°W; 951 m a.s.l.). The average transmissions in the TUV irradiance were 29.6% for overcast skies, 61.4% for 8–9 tenths CC, 74.7% for 6–7 tenths CC, and 78.8% for scans measured during 4–5 tenths CC.
Table 4. EUV, TUV, and GS transmissions (%) grouped by CC amount, AOD, and TCO.
The aerosol transmissions in the EUV, TUV, and GS regions in cloudy atmospheres were studied based on the SSR values corrected using the CC and TCO as listed in . The aerosol transmissions were 91.3%, 89.0%, and 91.6% for AOD <0.5 conditions, and 56.7%, 53.6%, and 51.7% for high aerosol loadings (2.5–4.0), in the three spectral regions, respectively. Therefore, high aerosol loadings reduced the transmission by 43.3%, 46.4%, and 48.3%, respectively, compared with the clear-sky atmosphere in the three spectral regions.
The ozone transmissions in the EUV, TUV, and GS regions were 82.0%, 75.0%, and 71.7% for TCO 310 DU and 70.2%, 79.0%, and 82.5% for TCO
400 DU, respectively. Unlike the cloud and aerosol transmissions, it can be confirmed that the spectral dependence of ozone transmission varies depending on the ozone amount group.
4.4. Wavelength dependence of the atmospheric transmission
The annual and monthly atmospheric transmissions in the EUV, TUV, and GS regions with the associated meteorological parameters are presented in . It is clear that the annual average total, cloud, aerosol, and ozone transmissions decrease effectively with increasing wavelength from EUV through the TUV and GS regions of the solar spectrum. These results are consistent with those of previous studies (e.g. Seckmeyer et al., Citation1996; Frederick and Erlick, Citation1997). However, the monthly spectral dependency of atmospheric transmission in March shows opposite patterns to those of the annual average and the monthly averages from July to January. The wavelength dependence of atmospheric transmission is relatively weaker in March while stronger from July to January and in August in particular. It can be inferred that, of the three meteorological parameters considered here, the high monthly TCO of 371 DU is responsible. This spectral dependence of transmission can be seen in . Similar results of wavelength-dependent transmission are reported in several previous studies. Krotkov et al. (Citation1996) and Frederick and Erlick (Citation1997) attributed this wavelength-dependent effect on cloud transmission to the interaction between scattering by cloud drops and molecular scattering in their vicinity. Seckmeyer et al. (Citation1996) also showed that the wavelength dependence of the cloud transmission is attributed to both wavelength-dependent scattering and re-distribution of the radiation within the clouds, or more likely by a combination of both mechanisms. They also explained that clouds have smaller effects on spectral dependence than ozone, which is consistent with the results of this study.
Table 5. Annual averages and seasonal wavelength dependences in total, cloud, aerosol, and ozone transmission (%) increase and decrease with wavelength from EUV through the TUV and GS regions of the solar spectrum.
As listed in , the cloud and aerosol transmissions decrease with increasing wavelength from the EUV through the TUV and GS regions for groups except for CC <1 and AOD <0.5 conditions. Under clear-sky atmospheric conditions, there is no systematic wavelength dependence of cloud and aerosol transmission. We also found that ozone transmission decreases with increasing wavelength for TCO <340 DU as well as average annual transmission. However, the wavelength dependence of ozone transmission is the opposite for groups characterised by TCO >370 DU, resulting in a critical TCO of 370 DU. In this study, we found that the wavelength dependence of atmospheric transmission is dominantly attributed to the amount of TCO.
4.5. Enhancement effects on clouds and aerosols
In this study, enhancements higher than 100% in cloud transmission, expressed as a fraction of the clear-sky value, have been observed; these correspond to values above the curves of the all-sky average values, as shown in . The enhancements occur in 5.6% (85/1525), 1.9% (28/1468), and 1.4% (21/1461) of all scans in the EUV, TUV, and GS regions, respectively, with more significant numbers of enhanced scans occurring at shorter wavelengths of the EUV irradiance. The results can be interpreted in terms of the accumulation of the strong direct beam and more significant reflections from the edges of partial cloud cover (e.g. Lubin and Frederick, Citation1991; Mims III and Frederick, Citation1994; Jung et al., Citation2011). The cloud enhancements can be explained by the spectral dependence of the scattering. Molecular scattering is more efficient at shorter wavelengths, resulting in a greater diffuse component in the UV than in GS irradiance.
5. Summary and conclusions
In this study, the atmospheric broadband transmission of the EUV (290–320 nm), TUV (290–363 nm), and total GS (305–2800 nm) irradiances was investigated using measurements made in Seoul, Korea, for 9 years from March 2004 to January 2013. In terms of annual average, the total transmissions expressed as a fraction of the clear-sky irradiance were 77.6%, 73.6%, and 72.0%, respectively, in the EUV, TUV, and GS irradiance under all-sky conditions. The cloud transmission under constant aerosol and ozone atmospheric conditions was 78.4%, 73.9%, and 71.7% in the EUV, TUV, and GS spectral regions. In particular, overcast clouds substantially reduced the transmission, by 45.9%, 50.2%, and 56.6% in the three spectral regions, respectively. The annual aerosol transmission under reference cloud and ozone atmospheric conditions was 79.4%, 75.1%, and 74.1%, in the EUV, TUV, and GS regions, respectively. Particularly high aerosol loadings with AOD of 2.5–4.0 can reduce the transmission by 43.3%, 46.4%, and 48.3% in the spectral regions, respectively. The ozone transmissions in the EUV, TUV, and GS regions had almost the same annual values as aerosol transmissions, under constant cloud and aerosol atmospheric conditions. As a result, the annual average total, cloud, aerosol, and ozone transmissions are comparable under all-sky conditions. The annual average transmissions decrease effectively with increasing wavelength from EUV through the TUV, to the GS region. However, on a monthly scale, the wavelength dependence of transmission in March, which shows an increase with wavelength, is opposite to that of annual average and monthly transmissions during the period July to January due to the high TCO of more than 370 DU. It is noticed that there is nonsystematic wavelength dependence under clear-sky atmospheric conditions and a critical TCO value of 370 DU, causing the wavelength dependence of atmospheric transmission. Consequently, the wavelength dependence is caused by different climatological characteristics mainly in relatively dry, high aerosols and especially in high TCO. Further study is required using radiative transfer models to clarify these experimental results obtained for spectral aerosol and ozone transmissions.
Also, enhanced occurrences of cloud transmission greater than 100% were observed in 5.6%, 1.9%, and 1.4% of about 1500 scans in the EUV, TUV, and GS regions, respectively, with enhanced scans occurring more frequently for the shorter wavelengths of the EUV irradiance.
Disclosure statement
No potential conflict of interest was reported by the authors.
Additional information
Funding
References
- Anton, M., Serrano, A., Cancillo, M. L. and García, J. A. 2008. Relationship between erythemal irradiance and total solar irradiance in South-Western Spain. J. Geophys. Res. 113, D14208. DOI:10.1029/2007JD009627.
- Bano, T., Singh, S., Gupta, N. and John, T. 2013. Solar global ultraviolet and broadband global radiant fluxes and their relationships with aerosol optical depth at New Delhi. Int. J. Climatol. 33, 1551–1562. DOI:10.1002/joc.3534.
- Booth, C. R. and Madronich, S. 1994. Radiation amplification factors: Improved formulation accounts for large increases in ultraviolet radiation associated with Antarctic ozone depletion. Antarct. Res. Ser. 62, 39–42. DOI:10.1029/AR062.
- Calbó, J. and González, J. A. 2005. Empirical studies of cloud effects on UV radiation: A review. Rev. Geophys. 43, RG2002. DOI:10.1029/2004RG000155.
- Cheymol, A. and De Backer, H., 2003. Retrieval of the aerosol optical depth in the UV‐B at Uccle from Brewer ozone measurements over a long time period 1984–2002. J. Geophys. Res. Atmos. 108, D003758. DOI:10.1029/2003JD003758.
- Cho, H. K. and Kang, M. S., 1984. A comparison of the atmospheric turbidity in Seoul with those in other stations in the WMO Global Background Air Pollution Monitoring Network. Asia-Pacific J. Atmos. Sci. 20, 59–72.
- Cho, H. K., Kim, J., Oh, S. N., Kim, S.-K., Seon-Kyun, B. and co-authors. 2003. A climatology of stratospheric ozone over Korea. Korean J. Atmos. Sci. 6, 97–112.
- Eltbaakh, Y. A., Ruslan, M. H., Alghoul, M. A., Othman, M. Y., Sopian, K. and co-authors. 2012. Solar attenuation by aerosols: an overview. Renew. Sustain. Energy Rev. 16, 4264–4276. DOI:10.1016/j.rser.2012.03.053.
- Erlick, C. and Frederick, J. E., 1998a. Effects of aerosols on the wavelength dependence of atmospheric transmission in the ultraviolet and visible: 1. A “single‐scattering‐separate” delta‐Eddington model. J. Geophys. Res. 103, 11465–11472.
- Erlick, C. and Frederick, J. E. 1998b. Effects of aerosols on the wavelength dependence of atmospheric transmission in the ultraviolet and visible: 2. Continental and urban aerosols in clear skies. J. Geophys. Res. D Atmos. 103, 23275–23285. DOI:10.1029/98JD02119.
- Evans, R. D. and Komhyr, W. D. 2008. Operations Handbook—Ozone observations with a Dobson spectrophotometer. World Meteorological Organization Global Atmosphere Watch GAW No.183. WMO/TD-No 1469.
- Foyo-Moreno, I., Alados, I., Olmo, F. J., Vida, J. and Alados-Arboledas, L., 2001. On the use of a cloud modification factor for solar UV (290–385 nm) spectral range. Theor. Appl. Climatol. 68, 41–50. DOI:10.1007/s007040170052.
- Frederick, J. E. and Erlick, C., 1997. The attenuation of sunlight by high-latitude clouds: spectral dependence and its physical mechanisms. J. Atmos. Sci. 54, 2813–2819. DOI:10.1175/1520-0469(1997)054<2813:TAOSBH>2.0.CO;2.
- Frederick, J. E. and Snell, H. E., 1990. Tropospheric influence on solar ultraviolet radiation: the role of clouds. J. Clim. 3, 373–381. DOI:10.1175/1520-0442(1990)003<0373:TIOSUR>2.0.CO;2.
- Frederick, J. E. and Steele, H. D., 1995. The transmission of sunlight through cloudy skies: an analysis based on standard meteorological information. J. Appl. Meteor. 34, 2755–2761. DOI:10.1175/1520-0450(1995)034<2755:TTOSTC>2.0.CO;2.
- Gröbner, J., Vergaz, R., Cachorro, V. E., Henriques, D. V., Lamb, K. and co-authors. 2001. Intercomparison of aerosol optical depth measurements in the UVB using Brewer Spectrophotometers and a Li‐Cor Spectrophotometer. Geophys. Res. Lett. 28, 1691–1694.
- Ilyas, M., 1967. Effect of cloudiness on solar ultraviolet radiation reaching the surface. Atmos. Environ. (1967) 21, 1483–1484. DOI:10.1016/0004-6981(67)90098-4.
- Iqbal, M. 1983. An Introduction to Solar Radiation. Elsevier, Amsterdam.
- Josefsson, W. and Landelius, T., 2000. Effect of clouds on UV irradiance: as estimated from cloud amount, cloud type, precipitation, global radiation and sunshine duration. J. Geophys. Res. Atmos. 105, 4927–4935. DOI:10.1029/1999JD900255.
- Jung, Y., Cho, H. K., Kim, J., Kim, Y. J. and Kim, Y. M., 2011. The effects of clouds on enhancing surface solar irradiance. Atmosphere 21, 131–142.
- Kim, J., Cho, H.-K., Lee, Y.-G., Oh, S. N. and Baek, S.-K. 2005. Updated trends of stratospheric ozone over Seoul. Atmosphere 15, 101–118.
- Kim, J., Cho, H.-K., Mok, J., Yoo, H. D. and Cho, N., 2013. Effects of ozone and aerosol on surface UV radiation variability. J. Photochem. Photobiol. B, Biol. 119, 46–51. DOI:10.1016/j.jphotobiol.2012.11.007.
- Kim, J., Park, S. S., Moon, K. J., Koo, J.-H., Lee, Y. G., and co-authors 2007. Automation of Dobson Spectrophotometer (No.124) for ozone measurements. Atmosphere 17, 339–348.
- Kim, W., Kim, J., Park, S. S. and Cho, H.-K., 2014. UV sensitivity to changes in ozone, aerosols, and clouds in Seoul, South Korea. J. Appl. Meteorol. Climatol. 53, 310–322. DOI:10.1175/JAMC-D-13-052.1.
- Komhyr, W. D. 1980. Operations Handbook—Ozone Observations with a Dobson Spectrophotometer. NOAA Environmental Research Laboratories, Air Resources Laboratory, Boulder.
- Komhyr, W. D., Grass, R. D. and Leonard, R. K., 1989. Dobson spectrophotometer 83: a standard for total ozone measurements, 1962–1987. J. Geophys. Res. 94, 9847–9861.
- Krotkov, N., Geogdzhaev, I., Chubarova, N. Y., Bushnev, S., Khattatov, V. and co-authors. 1996. A new database program for spectral surface UV measurements. J. Atmos. Oceanic Technol. 13, 1291–1299. DOI:10.1175/1520-0426(1996)013<1291:ANDPFS>2.0.CO;2.
- Kuchinke, C. and Nunez, M. 1999. Cloud transmission estimates of UV-B erythemal irradiance. Theor. Appl. Climatol. 63, 149–161. DOI:10.1007/s007040050100.
- Lindfors, A. and Arola, A. 2008. On the wavelength-dependent attenuation of UV radiation by clouds. Geophys. Res. Lett. 35, L05806. DOI:10.1029/2007GL032571.
- Lubin, D. and Frederick, J. E., 1991. The ultraviolet radiation environment of the Antarctic Peninsula: the roles of ozone and cloud cover. J. Appl. Meteor. 30, 478–493. DOI:10.1175/1520-0450(1991)030<0478:TUREOT>2.0.CO;2.
- Madronich, S. 1993. The atmosphere and UV-B radiation at ground level. In: Environmental UV Photobiology. (eds. A. R. Young, J. Moan, L. O. Björn, W. Nultsch) Springer, New York, pp. 1–39.
- McKinlay, A. and Diffey, B., 1987. A reference action spectrum for ultraviolet induced erythema in human skin. CIE J. 6, 17–22.
- Meleti, C. and Cappellani, F., 2000. Measurements of aerosol optical depth at Ispra: analysis of the correlation with UV-B, UV-A, and total solar irradiance. J. Geophys. Res. Atmos. 105, 4971–4978. DOI:10.1029/1999JD900459.
- Mims, F. M. III and Frederick, J. E., 1994. Cumulus clouds and UV-B. Nature 371, 291–291. DOI:10.1038/371291a0.
- Miyagawa, K., Kim, J. and Cho, H. K. 2005. Intercomparison of Dobson ozone spectrophotometer in Yonsei University, Korea. J. Aerol. Obs. 65, 93–98.
- Nunez, M., Marin, M. J., Serrano, D., Utrillas, M. P., Fienberg, K. and co-authors. 2016. Sensitivity of UVER enhancement to broken liquid water clouds: a Monte Carlo approach. J. Geophys. Res. Atmos. 121, 949–964. DOI:10.1002/2015JD024000.
- Park, S. S., Jung, Y. and Lee, Y. G., 2016. Spectral dependence on the correction factor of erythemal UV for cloud, aerosol, total ozone, and surface properties: a modeling study. Adv. Atmos. Sci. 33, 865–874. DOI:10.1007/s00376-016-5201-4.
- Park, S. S., Kim, J., Cho, H. K., Lee, H., Lee, Y. and co-authors. 2012. Sudden increase in the total ozone density due to secondary ozone peaks and its effect on total ozone trends over Korea. Atmos. Environ. 47, 226–235. DOI:10.1016/j.atmosenv.2011.11.011.
- Sabburg, J. M. and Parisi, A. V., 2006. Spectral dependency of cloud enhanced UV irradiance. Atmos. Res. 81, 206–214. DOI:10.1016/j.atmosres.2005.11.011.
- Schafer, J., Saxena, V., Wenny, B., Barnard, W. and De Luisi, J. 1996. Observed influence of clouds on ultraviolet-B radiation. Geophys. Res. Lett. 23, 2625–2628.
- Seckmeyer, G., Erb, R. and Albold, A. 1996. Transmittance of a cloud is wavelength-dependent in the UV-range. Geophys. Res. Lett. 23, 2753–2755.
- Serrano, D., Marin, M. J., Nunez, M., Utrillas, M. P., Gandia, S. and co-authors. 2015. Wavelength dependence of the effective cloud optical depth. J. Atmos. Sol. Terr. Phys. 130–131, 14–22. DOI:10.1016/j.jastp.2015.05.001.
- Sivamani, R. K., Crane, L. A. and Dellavalle, R. P. 2009. The benefits and risks of ultraviolet tanning and its alternatives: the role of prudent sun exposure. Dermatol. Clin. 27, 149–154. DOI:10.1016/j.det.2008.11.008.
- Stewart, I. D. and Oke, T. R. 2012. Local climate zones for urban temperature studies. Bull. Am. Meteorol. Soc. 93, 1879–1900. DOI:10.1175/BAMS-D-11-00019.1.
- Wilks, D. S. 2011. Statistical Methods in the Atmospheric Sciences. Academic Press, Oxford.