
Abstract
Particulate matter smaller than 2.5 μm in diameters (PM2.5) often experiences explosive growth (mass concentration at least doubled in several to 10 h) in winter aerosol pollution episodes (HPEs) in Beijing. Whether a threshold value exists for such PM2.5 explosive growth is uncertain. Here, we used PM2.5 mass concentration, surface and vertical meteorological factors including winds, temperature, relative humidity (RH), and radiation in winter (Jan., Feb., and Dec.) from 2013 to 2017 to confirm the existence of the threshold for PM2.5 explosive growth and determine the threshold value. We found that the positive feedback from aerosols to near-ground radiative cooling to anomalous inversion is effectively triggered under slight or calm winds when the near-ground PM2.5 mass reaches a certain threshold. A threshold value for PM2.5 explosive growth (100 μg m−3) is determined by analyzing 30 cumulative stages (CSs) during 28 HPEs. Keeping the PM2.5 mass concentration transported from the south of Beijing below this value would avoid the majority of PM2.5 explosive growth during the 30 CSs. As a reference for the government to further set the emission reduction target, a more stringent threshold value (∼71 μg m−3) is established by differentiating the lighter HPEs from the heavier HPEs.
1. Introduction
Beijing has suffered heavy aerosol pollution episodes (HPEs) frequently in winter since 2013 (Ding and Liu, Citation2014; Zhang et al., Citation2015b, Citation2018). As a crucial component of aerosol pollution, fine particulate matter with diameters smaller than 2.5 μm (PM2.5) reduces atmospheric visibility and affects human health, which causes widespread environmental and health problems (Bai et al., Citation2007; Chen et al., Citation2013). The formation of aerosol pollution with high PM2.5 mass concentration has been studied by many researchers through field observations, laboratory experiments, and model simulation (Liu et al., Citation2013; Zhang et al., Citation2013, Citation2014; Wang et al., Citation2015; Zheng et al., Citation2015). The atmospheric circulation and dynamic mechanisms were investigated during HPEs since 1980, which indicates that the descending motion in the mid-lower troposphere would reduce boundary layer (BL) height and generate an inversion to some degree to trap pollutants (Wu et al., Citation2017). Since secondary aerosols dominate the total aerosol mass (Zhang et al., Citation2013), the contributions of liquid-phase and heterogeneous reactions to secondary aerosols have been widely investigated (Zhang et al., Citation2013; Wang et al., Citation2014; Zhang et al., Citation2015a; Zheng et al., Citation2015; Fu and Chen, Citation2017; Tie et al., Citation2017). Previous research has established that the aqueous reaction in which SO2 oxidized by NO2 on fine aerosols with high relative humidity is key to facilitate sulfate formation (Cheng et al., Citation2016; Wang et al., Citation2016).
During the HPEs often occurs PM2.5 explosive growth (mass concentration at least doubled in several hours to 10 h), which has attracted considerable interest. Recent evidence suggests that PM2.5 explosive growth in the cumulative stage (CS) is dominantly caused by anomalous inversion enhanced by radiative cooling effects of existing aerosols under slight or calm winds to inhibit vertical turbulence diffusion and decrease BL height (Zhong et al., Citation2017; Zhong et al., Citation2018). To improve overall air quality across the country over a five-year period, China issued ‘Action Plan for the Prevention and Control of Air Pollution’ in September 2013. After strictly regional emission reduction measures in Beijing and its vicinity (BIV), annual mean PM2.5 mass concentration in Beijing has dropped by a third over the past 5 years from 90 μg m−3 in 2013 to 58 μg m−3 in 2017. To further mitigate aerosol pollution, it is necessary to avoid PM2.5 explosive growth, which substantially worsens aerosol pollution. Therefore, there has been growing interest in whether a threshold for PM2.5 explosive growth exists during HPEs as a reference to reduce emissions. So far, very little research has been carried out on such a threshold value. It is still not known whether a threshold exists, not to mention to determine the exact threshold value. Therefore, in this article, the following issues will be addressed: (1) to confirm the existence of the threshold for PM2.5 explosive growth; (2) to determine the exact threshold value as a reference for the government to reduce emissions.
2. Methods
In this study, the following data were used. (1) Hourly surface irradiance datasets, including vertical-surface (to the direction of solar radiation) direct irradiance and global irradiance from 25 December 2017 to 2 January 2017 at the observatory (54511) in Beijing’s southern urban area. The datasets are provided by the National Meteorological Information Center of the China Meteorological Administration (CMA). For the convenience of further investigation, we abbreviated vertical-surface (to the direction of solar radiation) direct irradiance to direct irradiance. (2) Hourly ground-level meteorological observations from automatic weather stations (AWSs) provided by the National Meteorological Information Center of CMA during the same period as the radiation data. (3) Atmospheric vertical profiles twice daily at 0800 Beijing time (BJT) and 2000 BJT, including winds, relative humidity (RH), and temperature, measured by an L-band radiosonde radar during the winter (Jan., Feb., and Dec.) from 2013 to 2017 at the observatory (54511). The observatory is located on the southern edge of the urban area of Beijing, so it could be used to represent urban vertical meteorological conditions due to the regional change characteristics of air masses. (4) Hourly PM2.5 mass concentration obtained by state-controlled stations of the Ministry of Environmental Protection in Beijing, Baoding, and Shijiazhuang during the winter (Jan., Feb., and Dec.) from 2013 to 2017. Since the PM2.5 mass concentration in Beijing from 1 to 17 January 2013 were not included, we used the PM2.5 observations from CMA to supplement it. We averaged PM2.5 mass concentrations in urban stations to represent urban pollution conditions.
3. Results and discussion
3.1. Confirm the existence of the threshold for PM2.5 explosive growth in winter HPEs
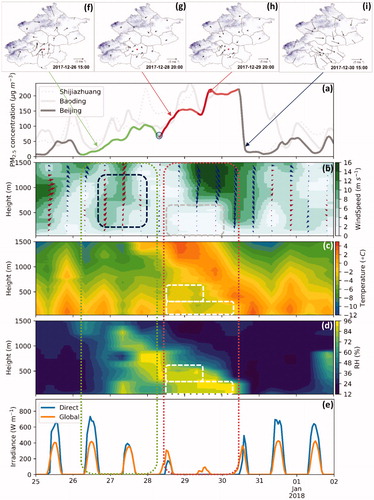
By analyzing Beijing’s HPEs in January 2013, February 2014, December 2015, and December 2016 to 10 January 2017, several reports have shown that winter HPEs in Beijing are generally divided into the transport stage (TS), during which pollutants transported from the south of Beijing induce aerosol pollution formation in the urban area of Beijing, and the cumulative stage (CS), whose PM2.5 explosive growth results from anomalous inversion enhanced by radiative cooling effects of aerosols under favorable slight or calm winds (Zhong et al., Citation2017, Citation2018). These studies illustrate aerosol pollution formation and PM2.5 explosive growth mechanisms, which are further confirmed by the HPE that occurred from 26 to 30 December 2017. As illustrated in , during the TS from 26 to 27 December, relative strong southerly winds () that carried warm, humid, and polluted air masses transported pollutants and water vapor to Beijing in both the lower BL and upper BL, which caused aerosol pollution formation with PM2.5 increasing from ∼10 to ∼90 μg m−3 and created requisite humid conditions conducive to accumulate pollutants. During the CS from 28 to 29 December with favorable slight or calm winds, global and direct surface irradiance substantially decreased () because transported PM2.5 in the lower BL scattered more solar radiation back to space. The radiative cooling effect of aerosols was further enhanced by ambient water vapor () through accelerating aqueous and heterogeneous reactions and facilitating aerosol hygroscopic growth, which might produce more cloud or fog drops. Induced by surface cooling, near-ground temperature reduction led to anomalous inversion (), which inhibited turbulence diffusion and reduced BL height to accumulate water vapor () and pollutants (). This vicious cycle from elevated PM2.5 to surface radiation reduction to worsening weather conditions resulted in PM2.5 explosive growth in the CS from 28 to 29 December despite of strictly executing atmospheric pollution control. During the transitional period from the TS to the CS concurrently with weakening winds, when the near-ground PM2.5 in the BL reaches a certain threshold, the positive feedback from aerosols to near-ground radiative cooling to anomalous inversion is effectively triggered, which subsequently results in explosive rising of PM2.5. Therefore, it can be assumed that the surface PM2.5 mass concentration at the start time of the CS (, dotted) represents the threshold of PM2.5 explosive growth to some degree.
Fig. 1. Temporal variations in PM2.5 mass concentration, surface radiation, and surface and vertical distributions of meteorological factors from 25 December 2017 to 1 January 2018 (a) PM2.5 mass concentration (gray or colored line: Beijing; light gray line: Baoding; gray dot: Shijiazhuang); (b) winds (vectors) and wind velocity (shadings; units: m/s); (c) temperature (shadings; units:°C); (d) RH (shadings; units: %); (e) direct (of the vertical surface to the direction of solar radiation) radiant exposure and global radiant exposure; (f, g, h, i) surface wind distribution in Beijing (the shading represents topography). (Green boxes or lines: the transport stage; blue boxes: relative strong southerly winds; red boxes or lines: the cumulative stage; white or gray boxes: the meteorological characteristics of the cumulative stage).
3.2. Characteristics of the HPEs with CSs in winter from 2013 to 2017
Because the CSs with PM2.5 explosive growth in HPEs are dominated by stable stratification characteristic of slight or calm winds and inversion, we selected 28 HPEs during the wintertime (Dec., Jan., and Feb.) from 2013 to 2017 based on these two striking features of CSs (). As shown in , these HPEs range in duration from 3 to 11 days with the mean duration ∼5 days, and in the PM2.5 peak value from ∼200 to ∼800 μg m−3 with the mean peak value ∼400 μg m−3. Closer inspection of the table shows 30 CSs appear during the 28 HPEs with start time clearly documented.
Table 1. Characteristics of HPEs with the CS in winter (Jan., Feb, and Dec) from 2013 to 2017.
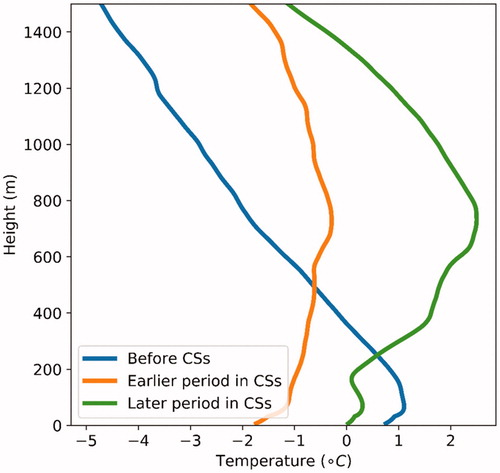
To investigate to the radiative cooling effects of aerosols on the vertical temperature profile generally, the vertical profiles before the 30 CSs, during the earlier period in the 30 CSs, and during the later period in the 30 CSs were averaged respectively. Comparing the temperature profile before the CSs with that during the earlier stage of CSs (), we found that weak inversion appeared below 800 m during the earlier stage of CSs. What stands out in the figure is that from the earlier stage to the later stage of CSs, the inversion was further reinforced with the temperature difference over 2 °C from the surface to ∼800 m, particularly striking at ∼200 m, which indicates the radiative cooling effects of increased aerosols further enhance inversion. Interestingly, temperature inversion appeared below 80 m before the CSs and during the earlier period in the CSs, for which a possible explanation might be the negative surface net radiation at night due to long-wave radiation emitting. It is possible that the synoptic or mesoscale change in meteorology might affect the temperature profile. Thus, further research with respect to using a model is needed to rule out the impact of synoptic or mesoscale change in meteorology and quantify the radiative cooling effects of aerosols on the temperature profile.
Fig. 2. Mean profiles of temperature before the CS, during the earlier period in the CS, and during the later period in the CS respectively in all the 30 CSs.
3.3. Determine the exact threshold value for PM2.5 explosive growth in the CSs
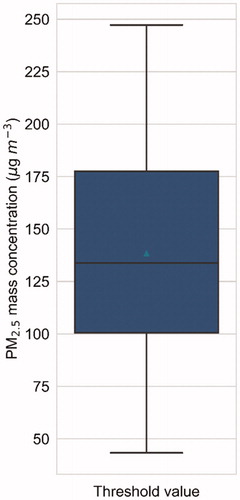
One source of uncertainty is that the threshold value for PM2.5 explosive growth in one case might reflect a selection effect to some degree. Therefore, to reduce possible threshold bias caused by one or several cases and improve the accuracy of the threshold for PM2.5 explosive growth, we further selected the PM2.5 mass concentration at the start time of the 30 CSs in noted 28 HPEs and analyzed their statistical characteristics. As depicted in , the upper quartile of the 30 initial PM2.5 mass concentration values is ∼176 μg m−3, which suggests that PM2.5 explosive growth is very likely to occur under favorable weak winds when transported PM2.5 from the south of Beijing is more than this value. Much lower than the upper quartile, the median of the 30 initial PM2.5 mass concentration values is ∼130 μg m−3, which suggests that the PM2.5 reduction of 40 μg m−3 would reduce about one quarter PM2.5 explosive growth in the CSs within 28 HPEs by weakening the positive feedback between aerosol pollution and worsening weather conditions. Strikingly, the lower quartile of the 30 initial PM2.5 mass concentration values is about 100 μg m−3, which indicates that to decrease PM2.5 mass concentration below 100 μg m−3 would avoid the majority of PM2.5 explosive growth in the 30 CSs by effectively weakening the vicious cycle from elevated PM2.5 to surface radiation reduction to worsening weather conditions. Therefore, it can be speculated that 100 μg m−3 is the exact threshold value for PM2.5 explosive growth in the CS. Because the elevated PM2.5 before the CS is mainly caused by pollutants transported from the south of Beijing, PM2.5 mass concentration established by TS needs to be below 100 μg m−3, which is a practical target for the government to achieve through stringent atmospheric pollution control at the first step ().
Fig. 3. Threshold values for PM2.5 explosive growth in all 30 CSs.
3.4. Differentiate the threshold value in heavier HPEs from that in lighter HPEs
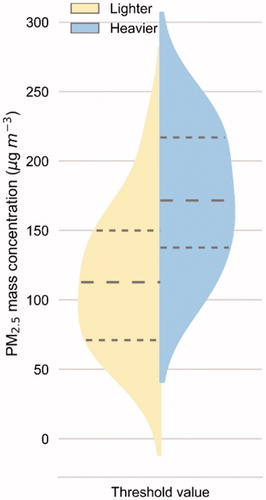
If the government achieved the initial emission reduction target to reduce PM2.5 mass concentration established by the TS below 100 μg m−3, a more stringent threshold value should be determined to reduce more PM2.5 explosive growth in the CSs. Therefore, we selected the HPEs in the months with the highest mass concentration each year from 2013 to 2017, including January in 2013, February in 2014, December in 2015, and December 2016 to 10th January 2017 (consistently with the period in (Zhong et al., Citation2018)), and termed them heavier HPEs; we referred to the rest HPEs as lighter HPEs. The initial PM2.5 mass concentration in the CSs in heavier HPEs were differentiated from those in lighter HPEs. As illustrated in , it’s not difficult to understand that initial PM2.5 mass concentration in heavier HPEs were much higher than that in lighter HPEs, because higher transported PM2.5 concentration would enhance the noted positive feedback between rising aerosols and worsening weather conditions to aggravate aerosol pollution. Because the lower quartile of initial PM2.5 mass concentration in the lighter HPEs is ∼71 μg m−3, it can be suggested that PM2.5 mass concentration established by TS needs to be below 71 μg m−3, which is the further emission reduction target for the government to achieve through more stringent atmospheric pollution control at the second step. In accordance with the present results, previous studies have demonstrated that the threshold value for aerosol extinction (in relation to radiative cooling effects of aerosols) ranging from 55 to 77 μg m−3 (Kong et al., Citation2017). Noted that one source of uncertainty is the limited estimate for high RH’s effects on the threshold for PM2.5 mass concentration because high RH also exerts remarkably impact on the vicious cycle from elevated PM2.5 to surface radiation reduction to worsening weather conditions. Therefore, further studies, which take RH and other variables into account, will need to be undertaken.
Fig. 4. Threshold values for PM2.5 explosive growth during the CSs in lighter HPEs (left) and heavier HPEs (right) respectively.
4. Conclusions
In this study, we found that the HPE from 25 December 2017 to 1 January 2018 in Beijing is generally divided into the transport stage (TS) and the cumulative stage (CS). During the CS, PM2.5 explosive growth appeared, which is mainly caused by anomalous inversion due to radiative cooling effects of existing aerosols under favorable weak winds. Because when the near-ground PM2.5 in the boundary layer (BL) reaches a certain threshold, the positive feedback from aerosols to near-ground radiative cooling to anomalous inversion is effectively triggered, we confirm that the surface PM2.5 mass concentration at the start time of the CS represents the threshold of PM2.5 explosive growth. To improve the accuracy of the threshold for PM2.5 explosive growth and avoid selection effects caused by only one or several cases, 28 HPEs with 30 CSs during the winter from 2013 and 2017 were further selected. Building on the PM2.5 mass concentration at the start time of the 30 CSs, 100 μg m−3 (the lower quartile value) is determined to be the exact threshold, because the majority of PM2.5 explosive growth in the 30 CSs would be avoided with initial PM2.5 mass in the CS below this value by effectively weakening the vicious cycle from elevated PM2.5 to surface radiation reduction to worsening weather conditions. To further mitigate aerosol pollution, a more stringent threshold (∼71 μg m−3) was established by differentiating the initial PM2.5 mass concentration during the CSs in heavier HPEs from those in lighter HPEs. It can be suggested that PM2.5 mass concentration established by the TS needs to be reduced below 100 μg m−3 at the first step and 71 μg m−3 at the second step, as a reference for the government to set the emission reduction target. Noted that due to the impact of high RH on aerosol hygroscopic growth and secondary aerosol formation, further studies, which take the effects of RH and other variables on the threshold value into account, will need to be undertaken. In addition, more research with respect to using a model is needed to quantify the radiative cooling effects of aerosols and rule out the impact of synoptic or mesoscale change in meteorology.
Supplemental Material
Download MS Word (837.8 KB)Disclosure statement
No potential conflict of interest was reported by the authors.
Additional information
Funding
References
- Bai, N., Khazaei, M., van Eeden, S. F. and Laher, I. 2007. The pharmacology of particulate matter air pollution-induced cardiovascular dysfunction. Pharmacol. Ther. 113, 16–29. doi:10.1016/j.pharmthera.2006.06.005.
- Chen, Y., Ebenstein, A., Greenstone, M. and Li, H. 2013. Evidence on the impact of sustained exposure to air pollution on life expectancy from China’s Huai river policy. Proc. Natl. Acad. Sci. USA 110, 12936–12941. doi:10.1073/pnas.1300018110.
- Cheng, Y., Zheng, G., Wei, C., Mu, Q., Zheng, B. and co-authors. 2016. Reactive nitrogen chemistry in aerosol water as a source of sulfate during haze events in China. Sci. Adv. 2, e1601530. doi:10.1126/sciadv.1601530.
- Ding, Y. H. and Liu, Y. J. 2014. Analysis of long-term variations of fog and haze in China in recent 50 years and their relations with atmospheric humidity. Sci. China Earth Sci. 57, 36–46. doi:10.1007/s11430-013-4792-1.
- Fu, H. and Chen, J. 2017. Formation, features and controlling strategies of severe haze-fog pollutions in China. Sci. Total Environ. 578, 121–138. doi:10.1016/j.scitotenv.2016.10.201.
- Kong, L., Xin, J., Liu, Z., Zhang, K., Tang, G. and co-authors. 2017. The PM2.5 threshold for aerosol extinction in the Beijing megacity. Atmos. Environ. 167, 458–465.
- Liu, X. G., Li, J., Qu, Y., Han, T., Hou, L. and co-authors. 2013. Formation and evolution mechanism of regional haze: a case study in the megacity Beijing, China. Atmos. Chem. Phys. 13, 4501–4514. doi:10.5194/acp-13-4501-2013.
- Tie, X., Huang, R.-J., Cao, J., Zhang, Q., Cheng, Y. and co-authors. 2017. Severe pollution in China amplified by atmospheric moisture. Sci. Rep. 7, 15760. doi:10.1038/s41598-017-15909-1.
- Wang, G., Zhang, R., Gomez, M. E., Yang, L., Levy Zamora, M. and co-authors. 2016. Persistent sulfate formation from London Fog to Chinese haze. Proc. Natl. Acad. Sci. USA. 113, 13630–13635. doi:10.1073/pnas.1616540113.
- Wang, H., Xue, M., Zhang, X. Y., Liu, H. L., Zhou, C. H. and co-authors. 2015. Mesoscale modeling study of the interactions between aerosols and PBL meteorology during a haze episode in Jing–Jin–Ji (China) and its nearby surrounding region—Part 1: Aerosol distributions and meteorological features. Atmos. Chem. Phys. 15, 3257–3275. doi:10.5194/acp-15-3257-2015.
- Wang, Y. S., Li, Y., Wang, L. L., Liu, Z. R., Dongsheng, J. I. and co-authors. 2014. Mechanism for the formation of the January 2013 heavy haze pollution episode over central and eastern China. Sci. China Earth Sci. 57, 14–25. doi:10.1007/s11430-013-4773-4.
- Wu, P., Ding, Y. and Liu, Y. 2017. Atmospheric circulation and dynamic mechanism for persistent haze events in the Beijing–Tianjin–Hebei region. Adv. Atmos. Sci. 34, 429–440. doi:10.1007/s00376-016-6158-z.
- Zhang, R. H., Li, Q. and Zhang, R. N. 2014. Meteorological conditions for the persistent severe fog and haze event over eastern China in January 2013. Sci. China Earth Sci. 57, 26–35.
- Zhang, R., Wang, G., Guo, S., Zamora, M. L., Ying, Q. and co-authors. 2015. Formation of urban fine particulate matter. Chem. Rev. 115, 3803–3855. doi:10.1021/acs.chemrev.5b00067.
- Zhang, X., Sun, J., Wang, Y., Li, W., Zhang, Q. and co-authors. 2013. Factors contributing to haze and fog in China. Chin. Sci. Bull. (Chinese Version) 58, 1178. doi:10.1360/972013-150.
- Zhang, X. Y., Wang, J. Z., Wang, Y. Q., Liu, H. L., Sun, J. Y. and co-authors. 2015. Changes in chemical components of aerosol particles in different haze regions in China from 2006 to 2013 and contribution of meteorological factors. Atmos. Chem. Phys. 15, 12935–12952. doi:10.5194/acp-15-12935-2015.
- Zheng, B., Zhang, Q., Zhang, Y., He, K. B., Wang, K. and co-authors. 2015. Heterogeneous chemistry: a mechanism missing in current models to explain secondary inorganic aerosol formation during the January 2013 haze episode in North China. Atmos. Chem. Phys. 15, 2031–2049. doi:10.5194/acp-15-2031-2015.
- Zhong, J., Zhang, X., Wang, Y., Sun, J., Zhang, Y. and co-authors. 2017. Relative contributions of boundary-layer meteorological factors to the explosive growth of PM 2.5 during the red-alert heavy pollution episodes in Beijing in December 2016. J. Meteorol. Res. 31, 809–819. doi:10.1007/s13351-017-7088-0.
- Zhong, J., Zhang, X., Dong, Y., Wang, Y., Liu, C. and co-authors. 2018. Feedback effects of boundary-layer meteorological factors on cumulative explosive growth of PM2.5 during winter heavy pollution episodes in Beijing from 2013 to 2016. Atmos. Chem. Phys. 18, 247–258. doi:10.5194/acp-18-247-2018.