
Abstract
Long-term Aqua and Terra MODIS (MODerate resolution Imaging Spectroradiometer) Collections 5.1 and 6.1 (c051 and c061, respectively) aerosol data have been combined with AERONET (AERosol RObotic NETwork) ground-based sun photometer observations to examine trends in aerosol optical thickness (AOT, at 550 nm) over Northern Europe for the months April to September. For the 1927 and 1559 daily coincident measurements that were obtained for c051 and c061, respectively, MODIS AOT varied by 86 and 90%, respectively, within the predicted uncertainty of one standard deviation of the retrieval over land (ΔAOT = ±0.05 ± 0.15·AOT). For the coastal AERONET site Gustav Dalen Tower (GDT), Sweden, larger deviations were found for MODIS c051 and c061 (79% and 75%, respectively, within predicted uncertainty). The Baltic Sea provides substantially better statistical representation of AOT than the surrounding land areas and therefore favours the investigations of trends in AOT over the region. Negative trends of 1.5% and 1.2% per year in AOT, based on daily averaging, were found for the southwestern Baltic Sea from MODIS c051 and c061, respectively. This is in line with a decrease of 1.2% per year in AOT at the AERONET station Hamburg. For the western Gotland Basin area, Sweden, negative trends of 1.5%, 1.1% and 1.6% per year in AOT have been found for MODIS c051, MODIS c061 and AERONET GDT, respectively. The strongest trend of –1.8% per year in AOT was found for AERONET Belsk, Poland, which can be compared to –1.5% per day obtained from MODIS c051 over central Poland. The trends in MODIS and AERONET AOT are nearly all statistically significant at the 95% confidence level. The strongest aerosol sources are suggested to be located southwest, south and southeast of the investigation area, although the highest prevalence of pollution events is associated with air mass transport from southwest.
1. Introduction
Global warming is primarily a problem of too much carbon dioxide (CO2) in the atmosphere. However, anthropogenic emissions of aerosols impact the Earth’s radiation balance and climate as well (IPCC, Citation2013). The overall impacts from aerosols is a cooling of the Earth system. CO2 is relatively stable in the atmosphere (with a residence time of about 100 years), and therefore evenly distributed over remote areas of the Earth. Anthropogenic aerosols feature substantially shorter residence times in the lower atmosphere (∼1 week) and cause mainly local or regional effects. At present day, the full impact of increased greenhouse gas concentrations on global temperature is not known as man-made aerosols mask the heating of the planet to an uncertain degree. Although the direct and indirect aerosol effects (in the cloud-free and cloudy atmosphere, respectively) have been known for decades, the estimates of the impacts of aerosols on the radiation balance are still associated with large uncertainties (IPCC, Citation2013). Even so, second to greenhouse gases, man-made aerosols have caused the largest anthropogenic forcing during the industrial era (Boucher et al., Citation2013). Characterizing global aerosol distributions and their changes over time is necessary for understanding present climate conditions and future climate change (e.g. IPCC, Citation2013), particularly as even natural aerosols have a large contribution to uncertainty in indirect forcing (Carslaw et al., Citation2013).
Anthropogenic emissions of aerosols and precursors have increased significantly since pre-industrial times (Lamarque et al., Citation2010; Granier et al., Citation2011; Smith et al., Citation2011). However, air quality mitigation measures in Europe and North America from the 1980s onwards have led to regional reduction in anthropogenic emissions; e.g. SO2 emissions in Europe have declined with 73% between 1980 and 2004 (Vestreng et al., Citation2007; Hand et al., Citation2012). Granier et al. (Citation2011) report that anthropogenic emissions of NOx, CO and black carbon (BC) have decreased in Europe between 1980 and 2010 by 30%, 58% and 55%, respectively. From the Long-range Transmission of Air Pollutants inventory a decrease in SO2 emissions for Europe from 21.65 Tg in 2000 to 16.68 Tg in 2010 has been estimated, which means a reduction of 23% (de Meij et al., Citation2012). The reduction in SO2 for Europe given by EMEP for the period 1990–2010 is as much as 64% (–29.02 Tg). For BC emissions the IPCC inventory shows a reduction of 11% (–0.114 Tg) in Europe between 1900 and 2000. However, between 2000 and 2010 a small increase of 3% (0.028 Tg) is found for this species. In the same report, the NOx emissions are about 10% lower (–1.45 Tg) in 2010 compared to 2000. This reduction is suggested to be due to improved technology applied in road transport (e.g. catalytic converters and improved energy efficiency). For NH3 emissions, the EMEP inventory shows a decrease with 2.5% between 2000 and 2010. This reduction is probably the outcome of the actions to combat eutrophication problems in northwestern Europe (de Meij et al., Citation2012). Furthermore, general there is a tendency that PM2.5 levels measured in Europe have decreased over the period 2000–2014 (Guerreiro et al., Citation2016).
NASA has developed a suite of satellites known as the Earth Observation System to monitor important climate drivers, including the characterization of global aerosol properties and their changes over time. Two of these satellites are the twin MODerate resolution Imaging Spectroradiometer (MODIS, Salomonson et al., Citation1989) that provide measurements of the global distribution of aerosols from two polar orbiting satellites: Terra since 2000 and Aqua since 2002 (Remer et al., Citation2008). The swath width of 2330 km enables daily near-global coverage with MODIS, allowing for near-real-time monitoring of aerosol loading in the form of aerosol optical thickness (AOT) (Koren and Kaufman, Citation2004; Al-Saadi et al., Citation2005). The length of the MODIS AOT time series enables the investigation of temporal trends in aerosol burden. For example, Koukouli et al. (Citation2010) found a negative trend in MODIS Aqua and Terra (MODISA and MODIST, respectively) Collection 5 AOT, with respect to the period 2000–2007, for the Southern Balkan/Eastern Mediterranean region. The latitudinal distribution of relative AOT tendencies derived from Level 3 MODIS global monthly AOT for the period 2000–2006 also shows negative trends within the range from –5.7% to about –3% per year at mid and high latitudes in the northern hemisphere (Kishcha et al., Citation2007). Based on data from both monthly MODIS Level 2 and 3 products (Collection 5), and from Aerosol Robotic Network (AERONET, Holben et al., Citation1998), de Meij et al. (Citation2012) found significant negative trends in AOT for Europe for the period 2001–2009. Finally, sun-photometer data from 20 AERONET sites in Europe also show a decline in AOT: 11% over the period 2000–2009 (Turnock et al., Citation2015).
At the same time, an artificial tendency in the MODIST Collection 5 AOT Level 2 product has been found over land, caused by a drift in the radiometric calibration (Levy et al., Citation2010; Zhang and Reid, Citation2010; Levy et al., Citation2013). Additionally, for the ocean Collection 5 retrievals a significant offset between MODISA and MODIST AOT has been found by Remer et al. (Citation2008). Levy et al. (Citation2013) therefore introduced calibration changes in Collection 6 due to the biases found with Collection 5. Even so, Levy et al. (Citation2013) were not able to assess how the revised calibration will impact global trends and divergence of AOT derived from MODIS Terra and Aqua. Levy et al. (Citation2010) state that global trends are difficult to quantify, due to complicated sampling patterns for different aerosol types and surface conditions. On the other hand, it is plausible that regional trends can be compared with ground-based or other satellites measurements (e.g. Papadimas et al., Citation2008; Karnieli et al., Citation2009).
In the present study, 13 and 15 years (2003–2015 and 2003–2017, respectively) of MODIS level 2 AOT data, derived with Collection 5.1 (c051) and Collection 6.1 (c061), respectively, have been used to estimate trends from daily and monthly (April–September) AOT for Northern Europe. For MODIST also the years 2000, 2001 and 2002 are included in the investigation. The satellite derived time series of AOT have been compared to trends in AOT derived from AERONET measurements in the same region. Tesche et al. (Citation2016) show that cloud-free conditions, required for passive remote sensing, only make up 20–40% of the daytime observations for the months from April to September in eastern middle Sweden. Therefore, we have investigated if the AOT availability is higher over the Baltic Sea compared to the surrounded land areas and what this means for the representativity of the data. Additionally, days with available MODIS AOTs obtained with c051 for Northern Europe have been compared to results obtained with c061. The availability in AOTs derived from one of the satellite platforms Aqua and Terra has as well been compared to AOTs derived from MODISA and MODIST observation combined over the investigation area. Collocated comparisons with AERONET have been performed to validate MODIS AOT. Finally, MODIS AOT has been combined with back trajectories calculations to investigate transport of polluted and clean air masses. The aim with the latter is to indirectly identify locations of aerosol sources that may have caused the changes found in AOT over Northern Europe.
2. Data and methods
2.1. MODIS aerosol retrievals
The MODIS Aqua and Terra Collection c051/c061 Level 2 standard 10-km products have been used here for best quality retrievals (quality flag = 3) of AOT over land and ocean. Data were obtained through NASA Goddard Space Flight Center’s Atmosphere Archive and Distribution System (http://ladsweb.nascom.nasa.gov). Detailed descriptions of the MODIS dark target algorithms for retrievals of AOT over land and ocean can be found in Remer et al. (Citation2005), Levy et al. (Citation2007), Levy et al. (Citation2010) and Levy et al. (Citation2013). After corrections for water vapor, ozone and CO2 have been applied, the next step in the algorithm is to organize the reflectance at six wavelengths into 100 km2 boxes of 20 × 20 pixels at 500 m horizontal resolution. The ocean algorithm requires that all 400 pixels in the box are identified as ocean pixels. If any land is encountered the entire box is handled by the land algorithm. A test is used to filter out shallow-water pixels contaminated by underwater sediment (Li et al., Citation2003). Other tests filter out ice/snow pixels (Li et al., Citation2005), bright land scenes, and sun glint over water. The cloud screening is performed individually for the 400 pixels (Gao et al., Citation2002; Martins et al., Citation2002). Pixels that remain in a 10 km2 box after the screening procedure are sorted according to their 858-nm brightness. The brightest and darkest 25% of the pixels over ocean are discarded, thereby leaving 50% of the cloud-free data for the retrieval. Over land, the brightest 50% and darkest 20% of the pixels are discarded, which means that AOT is retrieved if at least 10 of the 400 pixels in the original box remain after masking and filtering. The remaining pixels are assumed to represent conditions suitable for aerosol retrievals (Remer et al., Citation2012). The 1354 pixel wide MODIS granule, in fact, represents a 2330 km-wide swath at the surface. The tenth granule has an output size of 135 by 204 pixels, and the pixel size increases towards the swath edges. The MODIS land and ocean retrievals give AOT at 550 nm with expected error envelopes of ΔAOT = ±0.05 ± 0.15 *AOT (Levy et al., Citation2010) and ΔAOT = +0.04 + 0.1 *AOT, ΔAOT = −0.02 − 0.1 *AOT (Levy et al., Citation2013), respectively, which arise from combined errors in assumed boundary conditions (e.g. surface reflectance, instrument calibration) and type of aerosol model (such as in single scattering albedo). In validation of MODIS against AERONET the expected error envelopes containing at least 67% (approximately one standard deviation) of the collocated AOT matches (Levy et al., Citation2013). The local equatorial crossing times are approximately 10:30 a.m. (descending node) and 01:30 p.m. (ascending node) local time for Terra and Aqua, respectively.
The aim in developing MODIS c061 was to improve the MODIS dark target aerosol product without a complete overhaul, thus, the basic theory, science and logic of the algorithm remain similar to c051 (Levy et al., Citation2013). However, coding bugs have been fixed, assumptions in the c051 algorithm have been reconsidered and diagnostic information has been added. As for the previous transition of going from Collection 4 to c051, the use of MODIS AOT data for determining aerosol climatology and trends impacts due to upstream calibration was also needed to be quantified (Levy et al., Citation2013). Although the aerosol algorithm was to remain unchanged from c051 to c061, the global aerosol product would be different, since the inputs are different. The new c061 product not only represents an update to the aerosol algorithm but also an update to all MODIS algorithms, including the calibration and cloud masking algorithms that produce the inputs to the aerosol algorithm (Levy et al., Citation2013). Note that MODIS AOT Level 2 standard 10-km products data derived with the c051 algorithm are only available up to 2015.
shows the investigation areas that have been selected here to investigate AOT over Northern Europe. All MODIS Aqua and Terra AOTs within the large white dashed box in the figure, and that correspond to the months April to September of the periods listed in are included in the investigation. To combine AOTs from MODIS Aqua and Terra we have introduced a common grid that consists of 0.25 latitude ∗ 0.25 longitude pixels within the investigation areas. The three smaller areas denoted with white solid boxes in have been selected to investigate trends in MODIS AOT. The marine areas of these boxes have been selected as there are more AOTs available over the Baltic Sea than over land (Section 4.3) and the positions are directly or nearly connected to the current ground-based AERONET stations. The European Centre for Medium Range Weather Forecasts (ECMWF) land-sea mask was used to exclude land pixels in the calculation of MODIS median AOT.
Fig. 1. Two granules with AOT (550 nm) at 10-km resolution, retrieved from MODIS c051 Aqua observations at 11:25 and 11:30 UTC on 22 September 2006. The large white dashed box denotes the main investigation area (mIA), for which MODIS AOT available within this area and corresponding to April to September of the period 2003–2015 are used in the present study. The three smaller white solid boxes denote areas of the wGB, swBS and cP, for which trends in MODIS monthly AOT have been estimated with respect to the period 2003–2015. The red circles denote the AERONET stations GDT, Hamburg (H) and Belsk (B). The orange triangles denote locations in wGB (HwGB) and swBS (HswBS), which are used as starting locations for 5-days back trajectories calculated with the HYSPLIT model. See for additional information.
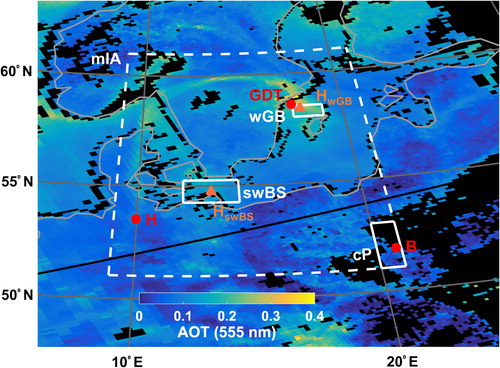
Table 1. Complementary information to Fig. 1 concerning the current investigation areas and present objectives (investigation periods are shown in ).
Table 2. Linear trends obtained from MODIS and AERONET daily and monthly seasonally adjusted AOTs.
2.2. AOT from sun photometer measurements
MODIS AOT retrieved over land has been compared to AERONET (version 3) level 2.0 data (quality assured) from Hamburg (53.6°N, 10.0°E), Germany, and Belsk (51.8°N, 20.8°E), Poland, for the periods 2003–2016 and 2002–2016 (not 2003), respectively. In addition, over the ocean MODIS AOT has been compared to AERONET (version 3) level 2.0 data from Gustav Dalen Tower (GDT; 58.6°N, 17.5°E), Sweden, for the period 2005–2017. For GDT data for April, May, August and September are not available for all years investigated, while for Belsk the data set covers only the period from April to July in 2012.
Information about the CIMEL sun photometers operated at these sites can be found at http://aeronet.gsfc.nasa.gov. AERONET data used for this study include AOT at 500 nm as well as the Ångström exponent α (440/675 nm). These values were recorded every 15 minutes and automatically cloud screened (Smirnov et al., Citation2000). AERONET-derived estimates of spectral AOT are expected to be accurate within < ±0.01 for wavelengths larger than 440 nm (e.g. Holben et al., Citation1998).
Sun photometer data from the considered sites have been used as well to investigate trends in AOT, but also to validate MODIS AOT. For Belsk and Hamburg the Ångström power law was used to convert AERONET AOT at 500 nm to the wavelength of 550 nm, for which AOT is retrieved from MODIS observations. The AOT at GDT is retrieved directly at 550 nm. Nine satellite pixels around each site were used in the validation of MODIS AOT, although only cases with an availability of at least five AOT values were included in the comparison. The ground-based sun photometer measurements have been averaged over 2.5 hours around the time of each satellite overpass. The relative (normalized) root mean square deviation (RMSDrel) was determined for collocated satellite and ground-based AOT values, averaged according to the procedure described in (Mishchenko et al., Citation2010).
2.3. HYSPLIT trajectory model
Hourly 5-days back trajectories were calculated using the HYSPLIT model (Draxler and Hess, Citation2003) for April to September of the period 2003–2017. The back trajectories start at 500 m asl from western Gotland Basin (wGB, 58.38°N, 17.88°E) and southwestern Baltic Sea (swBS, 54.75°N, 13.25°E). The trajectory calculations are based on meteorological data from the NCEP/NCAR reanalysis at 2.5° resolution (http://ready.arl.noaa.gov/archives.php). Complementary information about the current coordinates of the investigations areas, as well as of the AERONET and HYSPLIT sites, investigation periods and a summary of the present objectives are found in .
2.4. Method to investigate trends in AOT
Trends in AOT have been estimated with respect to MODISA and MODIST observations separated and combined over the investigation area. A screening procedure has been introduced here for the MODIS observations to assure a sufficient number of AOT values are available for representing a full day in the estimations of trends. Days with the number of AOT values equal and lower than 5% (5th percentile) of all available AOTs within the investigation area and corresponding to the investigation period have been excluded. For MODISA c051 and c061 as well as AERONET Hamburg the trends have been estimated with respect to daily and monthly median AOT for April to September of the periods 2003–2015, 2003–2017 and 2003–2016, respectively. For MODIST also the years 2000, 2001 and 2002 are included in the investigation.
Temporal autocorrelation can be a confounding factor when analysing trends in time series data (Weatherhead et al., Citation1998; von Storch and Zwiers, Citation1999). Temporal autocorrelation, if present, would effectively reduce the number of independent observations in a given time series. Autocorrelation has been taken in consideration in the trend analyses by using a stable seasonal adjustment on the current time series of AOT (Brockwell and Davis, Citation2002). In addition, temporal autocorrelation has been taken in consideration as well by calculating the autocorrelation function (Box et al., Citation1994) for all cases investigated in the present study. The method described in von Storch and Zwiers (Citation1999) was used to calculate adjusted values for the degrees of freedom in our samples. Using this method, the adjusted degrees of freedom were substantially lower than the number of samples, particularly for the trends estimated based on daily AOTs: more than one order in magnitude. The significance of the trends were tested based on a z-test and the adjusted degrees of freedom values.
Some degree of correlation, R2 = 0.31 and R2 = 0.16, is found in the time series of MODIS c061 daily AOT between swBS and wGB as well as between swBS and cP, respectively. Simultaneously, significant differences in the availability in AOT between the investigation areas occur: 79% and 52% daily coverage for wGB and cP, respectively, with respect to swBS, This means that dealing with spatial autocorrelation is not fully relevant here due to widely differing data coverage and has therefore not been taken in consideration in the present investigation.
2.5. Method to investigate spatial transport pattern of polluted and clean air masses
To investigate spatial patterns of air mass transport we used 5-day back-trajectories with daily starts at 09:00, 10:00, 11:00, 12:00 and 13:00 UTC, for April to September of the period 2003–2017. The coordinates of the back-trajectory hourly positions, were projected to a polar grid with the origin located at the trajectory receptor location within swBS box (). The probability of occurrence is defined as the number of trajectories that have passed a cell divided by the total number of trajectories used. In the case, that a trajectory crossed a grid cell more than once only one hit was registered. The fraction of hits of the days corresponding the lowest percentile (25th) and highest percentile (75th) of the MODIS c061 AOTs (AOT25 = 0.12 and AOT75 = 0.25, respectively) were compared in order to investigate the spatial transport patterns of cleaner and more polluted air masses. The corresponding areas for MODIS daily AOT estimates are swBS ().
Furthermore, the contribution of each of 16 azimuthal sectors to the total long-term AOT at wGB and swBS was calculated. This was done by linking MODIS c061 daily AOT with the fraction of time that each of 5-day back-trajectories of that day was present in each sector. Only trajectory heights that were within the mixed layer were accounted for, since the source of the particulate matter that affects AOT is assumed to be at the surface. The mean AOT for each sector, weighted by the residence time of the trajectory points in each sector, was also calculated. This was done in order to reveal the directional dependence of AOT in each of the two investigation sites.
3. Results
3.1. Comparison of MODIS AOT against AERONET measurements
and show comparisons of MODISA and MODIST AOT, with respect to c051 and c061, against AOT derived from AERONET observations at Belsk/Hamburg (inland sites) and GDT (coastal site), respectively.
Fig. 2. MODIS Aqua and Terra AOT versus AERONET AOT, for which the collocated values were obtained for April to September of the periods 2002–2015 (2003 is not included) and 2003–2016 for the stations Belsk and Hamburg, respectively, according to (a) c051 (2016 is not included) and (b) c061. The dashed lines in the figures represent predicted uncertainties (expected error envelopes) of the MODIS retrievals over land. R2, RMSDrel and N denote the correlation coefficient, relative mean square deviation and number of collocated pairs, respectively. The solid and dotted lines denote the linear fit and 1-to-1 line, respectively.
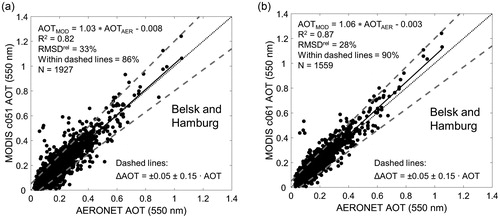
Fig. 3. Same as Fig. 2, while with respect for the AERONET station GDT, for April–September of the period 2005–2015. The predicted uncertainties of the MODIS retrievals are for observations over the ocean.
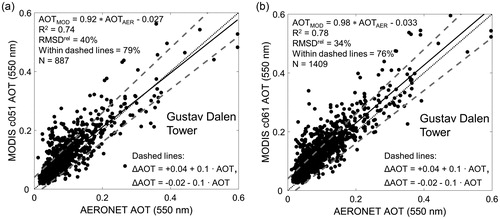
shows that MODIS AOT, for both c051 and c061, are well within the expected error envelopes when compared to AOT derived from sun-photometer measurements at Hamburg and Belsk. The figure also shows that as many as 24% more matches are available for c051 compared to c061 even though the latter collection also includes data from 2016. When comparing c051 AOT against AERONET, 89% of 901 collocated matches are found to be within the predicted uncertainties for MODISA, while there are only 83% for MODIST (1026 collocated matches). For c061 applied on MODISA and MODIST observations, 92% (687 collocations) and 88% (872 collocations) of matches, respectively, are found to be within the predicted uncertainties. shows a larger deviation in AOT between MODIS and the sun photometer at GDT compared to the validation over land. When comparing c051 AOT against AERONET for MODISA and MODIST separated 80% and 78% of matches (382 and 505 collocations, respectively), respectively, are found to be within the predicted uncertainties. For c061, 80% and 70% of matches are found to be within the predicted uncertainties for MODISA and MODIST, respectively (728 and 681 collocations, respectively). Furthermore, shows a factor of 1.6 higher number of collected points for c061 than c051 for this coastal site. In Section 3.2 we will show the advantage of using measurements from both MODISA and MODIST to estimate AOT over the investigation area.
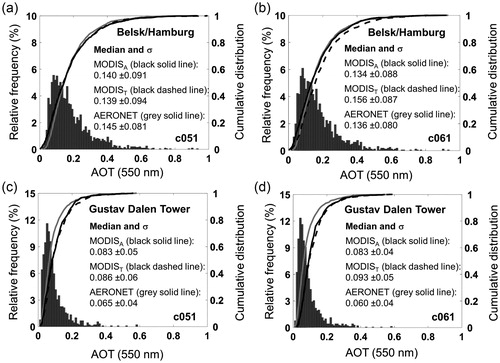
shows relative frequency histograms of AERONET AOT and cumulative distribution curves of MODIS and AERONET AOT, subdivided according to the ground-based stations Belsk/Hamburg and GDT as well as for c051 and c061. The cumulative distribution curves shown in the figures have been subdivided according to MODISA and MODIST. For Belsk/Hamburg the difference in median AOT of the cumulative distribution between satellite and ground-based remote sensing is relatively small, although larger deviation is found for c061 applied on MODIST. For GDT larger deviation between MODIS and AERONET is found.
Fig. 4. Relative frequency histogram of AERONET AOT (550 nm) and cumulative distribution of MODIS Aqua AOT (black solid line), MODIS Terra AOT (black dashed line) and AERONET AOT (grey solid line) of the results in Figs. 2 and 3, subdivided according to (a) Belsk & Hamburg and c051, (b) Belsk & Hamburg and c061, (c) GDT and c051 and (d) GDT and c061. The text in the figures shows median and standard deviation (σ).
3.2. Influences of cloud formation and sun glint effects on the availability in AOTs
shows MODIS Terra and Aqua AOT c061 scenes, respectively, over Northern Europe for 2 July 2014. shows the corresponding visible composite images, in which cloudy and cloud-free areas can be identified. AOTs derived from MODIS Terra observations over the North Sea around 10:30 UTC are denoted with the red dotted oval in . For the same area shows that MODISA that passed this area around 12:20 UTC in the same day has not produced any AOTs. This is likely due to sun glint effects, specular reflection of light from water surfaces, which means that AOTs from MODISA were screened out. This problem arises when sunlight is reflected off the water surface at the same angle that the satellite sensor views. For MODISA this appears along and near the nadir view (left hand side of the satellite track). The orange solid oval suggests that the opposite occurs over the Baltic Sea: sun glint in MODIS Terra observations occurs on the right hand side of the nadir view. Thus, using combined observations from both MODISA and MODIST over the current marine area means that the availability in daily AOTs increases by as much as40% compared to using data from just one of the two platforms ().
Fig. 5. MODIS c061 AOT scenes over Europe for 2 July 2014, obtained from overpasses by (a) Terra at 10:30 UTC and (c) Aqua at 12:20 UTC. Panels (b) and (d) show the corresponding MODIS visible composite pictures. The areas denoted by the red dashed and the orange solid ovals are discussed in the text.
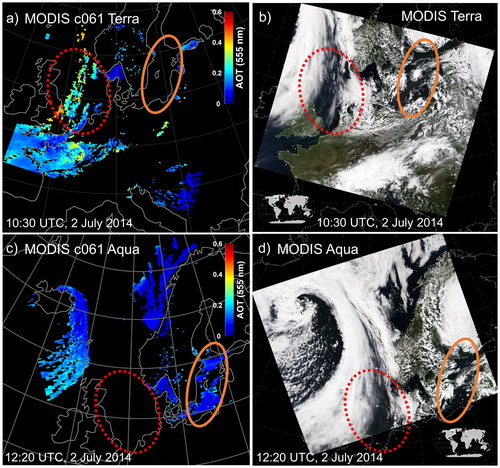
Table 3. Mean number of days (in %) with MODIS and AERONET available AOTs, with respect to time periods listed in .
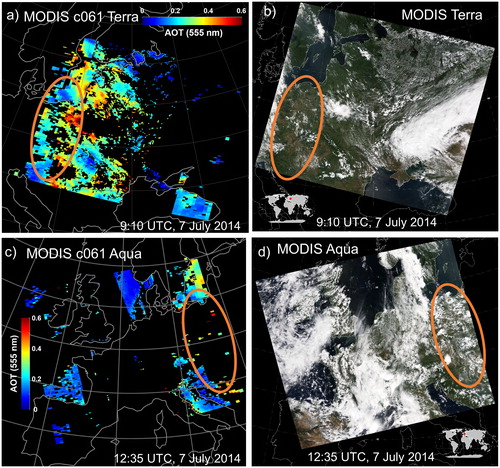
visualizes the effect of formation of convective clouds over land on the AOT retrieval. The MODISA overpass at 1235 UTC shows increased cloud coverage in the marked area (orange solid oval) compared with the nearly cloud-free MODIST scene from 09:10 UTC earlier that day. For such condition, it can thus be expected that MODIST associated with earlier overpasses over the current investigation area lead to a better AOT coverage than for MODISA.
Fig. 6. MODIS c061 AOT scenes over Europe for 7 July 2014, obtained from overpasses by (a) Terra at 9:10 UTC and (c) Aqua at 12:35 UTC. Panels (b) and (d) show the corresponding MODIS visible composite pictures. The areas denoted by the orange solid ovals are discussed in the text.
3.3. Availability in AOTs derived from MODIS aqua and terra observations
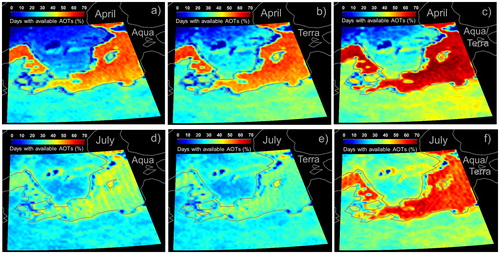
shows the mean number days with available MODIS AOTs (in %), derived with c051, over the investigation area for April and July of the period 2003–2015. The results are subdivided according to AOTs derived from individual MODISA and MODIST observations as well as from a combination of the two data sets. The figures show that the major part of the investigation area is associated with higher availability in AOTs for the combined data set. Even so, the figure shows that very low number of days with available AOTs appears over Sweden, particularly for MODISA observations in April. The latter may be due to the development of shallow convective clouds between the overpasses by Terra and Aqua. Nevertheless, along parts of the coastal land higher number of days with available AOTs is found. Better statistics are suggested also for two belts in the east-west direction located in the middle part of eastern Sweden, which is most clearly shown in . Furthermore, shows that substantially higher numbers of days with available AOTs are found over water rather than over land. This is not valid, however, along the coasts and for the Danish islands.
Fig. 7. Percentage of days with available AOTs (c051) for April (top panels) and July (bottom panels) for the main investigation area. The left, centre and right panels show the MODIS Aqua, Terra and combined datasets, respectively.
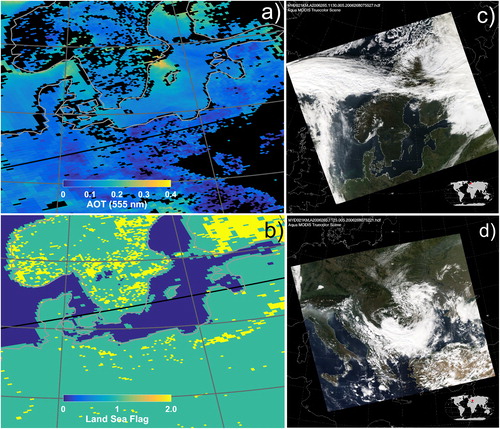
When comparing the findings in with results obtained with MODIS c061 large differences in AOT are found between the two collections for the retrievals over land. shows that the majority of the land areas are associated with significantly higher number of daily AOT for c051 compared to c061. However, along a large part of the coastline (including over GDT), over the large Swedish inland lakes and between the Danish islands the opposite appears. In addition, large difference in available AOTs appears when comparing MODIS c051 and c061 scenes corresponding to 22 September 2006 (, respectively). By comparing these results with MOD03 c061 land sea mask (), e.g. for Southern Sweden and Northern Germany, it is obvious that this updated screening plays a role for the difference found in the statistical representation of AOT. The MODIS visible composite pictures in suggests cloud free conditions over these areas.
Fig. 8. Differences between c051 and c061, in percentage of days with available MODIS Aqua/Terra AOTs, for April (a) and July (b) of the period 2003–2015 and the main investigation area. The grey circles denote the AERONET stations GDT, Hamburg (H) and Belks (B).
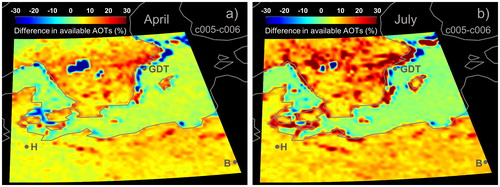
Fig. 9. (a) Two granules with AOT (550 nm) at 10-km resolution, retrieved from MODIS c061 Aqua observations at 11:25 and 11:30 UTC on 22 September 2006. (b) Land sea flag (based on MOD03 c061 land sea mask), where 0 = ocean, 1 = land and 2 = coastal (coastal, Ephemeral and shallow inland water). (c and d) MODIS visible composite picture corresponding to 11:30 and 11:25 UTC, respectively, on 22 September 2006. Note that the scenes in (a) and (b) cover the Northern Europe, while a larger part of Europe is covered by the pictures combined in (c) and (d). The scenes in (a) and (b) cover the same area as the one shown in Fig. 1.
Since the majority of the aerosols that contribute to AOT in the investigation area are probably accumulation-mode particles (Levy et al., Citation2010), relatively small spatial variations are expected for Northern Europe (e.g. Tesche et al., Citation2016). This, together with the finding that Baltic Sea provides better statistical representation of AOT than the surrounding land, support a focus on specific regions over the Baltic Sea in order to estimate trends in AOT (Section 3.5) as well as to investigate transport patterns of clean and polluted air masses (Section 3.6).
3.4. MODIS c051 monthly AOT fields
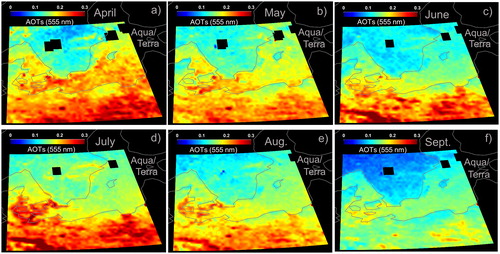
shows MODIS c051 Aqua/Terra monthly averaged AOT fields over the investigation area, for the period 2003–2015. Note that the number of days used for this averaging varies considerably between the different regions, as indicated in . The representativeness of the mean AOD over land in the northern part of the area of interest may therefore be limited. A better balance of the number of days with available AOT over land and water for July compared to the other months (not shown) seems to produce more coherent AOT fields at lower and higher latitudes (). Despite differences in AOT availability, suggests a north-south gradient in AOT. The latter is presumably because the abundance of aerosol sources are located south of the present investigation area. Mean AOT values that are substantially higher than a typical value corresponding to a background aerosol (∼0.1) are also found, particularly in the southern part of the investigation area. However, the figures indicate that anthropogenic aerosols seem to influence the investigation area to a lesser degree in September compared to the other months investigated. Lower humidity and consequently lower hygroscopic growth of the aerosols in fall may also play a role.
Fig. 10. Fields of monthly mean AOTs, obtained for MODIS c051 Aqua and Terra combined with respect to the period 2003 – 2015, for (a) April, (b) May, (c) June, (d) July, (e) August and (f) September. The fields belong to the main investigation area. Note that lacking of AOT data, denoted with black, occurs for the largest inland lake in Sweden, Vättern and Stockholm archipelago (upper right in the figure).
3.5. Trends in satellite and ground-based derived AOT
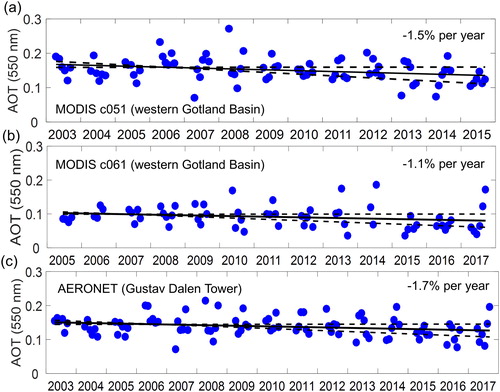
Time series of monthly median AOT over the periods 2003–2015 and 2003–2017, obtained with c051 and c061, respectively, applied on MODISA/T observations over the swBS as well as AERONET measurements at Hamburg, are shown in . For MODIST trends in AOT have been estimated also based on the years 2000, 2001 and 2002. The solid and dashed lines denote linear fits and corresponding 95% confidence intervals for the slope, respectively. Trend values (in % per year) estimated for monthly AOT with respect to the present investigation period are also shown. Similarly, show the AOT trends for central Poland (cP) and wGB with the sun-photometer measurements at Belsk and GDT, respectively.
Fig. 11. Time series of monthly median AOT (blue circles) for (a) MODIS c051 and (b) MODIS c061 over the swBS, as well as for (c) AERONET site in Hamburg. Trend values in percent per year have been obtained from the slopes of the black solid lines. The dashed lines denote the 95% confidence interval for the slope. More statistic results are present in Tables 2 and 3.
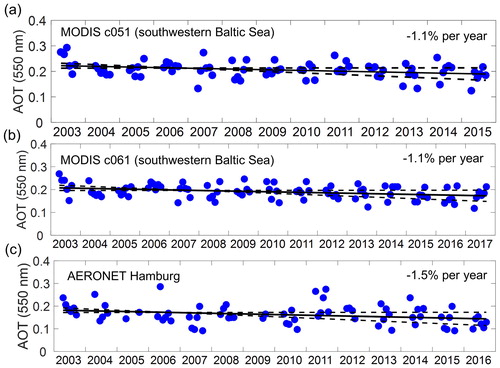
Fig. 12. Same as Fig. 11, but for MODIS derived AOTs over cP and the AERONET site in Belsk.
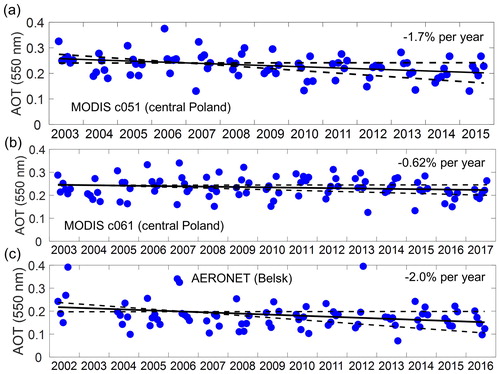
Fig. 13. Same as Fig. 11, but for MODIS derived AOTs over wGB and the AERONET GDT site.
In addition, presents a summary of statistics obtained from the results shown in , with additional information on the separate analysis of MODISA and MODIST as well as on trends derived from daily AOT values. Regression statistics based on daily medians instead of monthly median values means higher degrees of freedom. Since bias caused by calibration degradation has been found for MODIS Terra c051 (Section 4.2) no values of the slope and y-intercept are presented in for this platform. shows that negative AOT trends are found for all cases and the majority of these are statistically significant at the 95% confidence level. The trends estimated over the three investigation areas are in line with negative trends found at the AERONET stations, although the differences between the MODIS trends estimated for cP area are very large. Note that GDT is associated with substantially lower availability in daily AOT in April, May, August and September due to missing data in some years. The data-coverage threshold included in this study was selected to avoid too low numbers of AOT values for representing a day (Section 2.4). This somewhat reduced the overall availability in daily AOT values. By including and excluding the threshold for all MODIS cases () gives RMSDrel and RMSD of 13% and 0.16% per year, respectively. Thus, the difference is relatively small, but not negligible.
A summary of the data availability for each month and dataset is given in . and confirm that the number of days with available AOTs are on the whole higher for c051 than c061, and it is particularly large for retrievals of AOT over land.
3.6. Air mass transport and aerosol sources
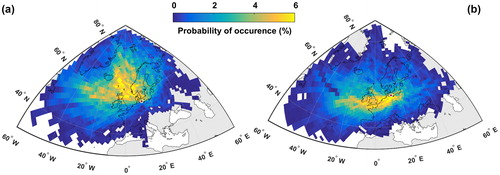
A small ensemble of 5-day back-trajectory was calculated for each day with available MODISA/T c061 AOTs for the swBS region. The receptor point is indicated in . displays a probability map of the trajectories crossing the grid cells during the period of interest. Panel a) comprises only trajectories from the days of the lower quartile of AOT (<0.11), while panel b) is based on the highest quartile (AOT >0.25). This provides an insight into the difference in the general transport patterns between the days with the lowest and highest AOT. Both panels imply that westerly and north westerly winds are dominant over the investigation area, but for cleaner days, the air masses were mainly transported over the North Atlantic and Scandinavia before reaching swBS. The trajectories associated with higher AOT have a significant southwestern component. This is an indication that anthropogenic aerosol sources located in Western Europe, including the English Channel, likely influence the swBS. The higher probability of occurrence west of Great Britain does not imply that the Atlantic is an important contributor to the swBS AOT. It is more likely an indication of the position of the trajectory points before crossing the source regions.
Fig. 14. Probability of occurrence derived from Hysplit 5-days back-trajectories for the swBS region in combination with MODIS c061 daily AOT for April to September of the period 2003–2015. Panels (a) and (b) encompass only the trajectories with MODIS AOTs lower and higher than the 25th and 75th quartiles, respectively. The coordinates of the end points of the trajectories are presented in .
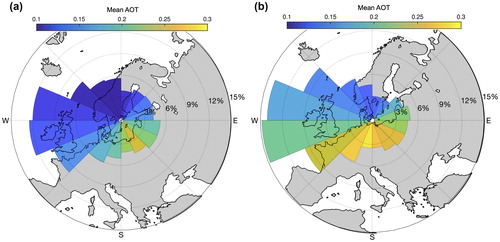
shows the directional dependence of the mean MODIS AOT for swBS and wGB. It is based on the residence time of the trajectories in each sector and the MODIS c061 AOT for both Aqua and Terra. The colour-shading indicates that the southerly sectors for both locations are associated with the highest mean AOT, which is around double of the mean AOT associated with the northern sectors. It is also clear that the mean AOT is higher in all corresponding swBS versus wGB sectors. This is likely due to swBS being closer the continental Europe and busy shipping lanes (Aulinger et al., Citation2016), where air masses with higher AOT arrive from. Furthermore, the length of the sectors in indicates their contributions to the total long-term AOT at both locations. Despite not being associated with the highest mean AOT, the high frequency of air-masses arriving from the two sectors around the western line dominates, and yields a contribution of 25%–30% to the total AOT in a long-term perspective. The north-eastern sectors contribute the least to the total AOT because trajectories arriving from these sectors are quite infrequent, and they are also associated with relatively low AOT loading.
Fig. 15. Relation between sector of air mass origin and MODIS c061 AOT for (a) wGB (b) swBS. The colour shades indicate the mean AOT for each sector, and the sector lengths indicates the contribution to the total AOT during the investigation period.
4. Discussion and conclusions
4.1. Validation and availability of MODIS AOT
AOT derived with c051 and c061 from MODIS observations over Northern Europe, for April–September, has been validated against AOT obtained from sun photometer measurements at two land sites and one coastal station. MODISA/T 550-nm AOTs derived with c051 vary within the expected uncertainties of the MODIS retrievals over land (ΔAOT = ±0.05 ± 0.15 * AOT) for 86% of the 1927 compared cases, although the best agreement occurs for MODIS Aqua (89%). Values of R2 = 0.86 and RMSDrel = 31% were found for the MODIS c051 and ground-based collocated cases. The present results are in agreement with Glantz and Tesche (Citation2012) who included 20 AERONET stations in Europe in the validation of MODIS c051 and Tesche et al. (Citation2016) who focussed on long-term MODIS observations over the Stockholm region. In a global validation of the MODIS c051 dark-target aerosol products against AERONET, Levy et al. (Citation2010) conclude that MODIS compares best (negligible bias and good correlation), for light aerosol loading (AOT <0.15), over sites that are both moderately ‘dark’ and moderately ‘green’. Such generally vegetated sites occur over the Eastern United States and Southern Africa, but also over Western Europe. For heavy aerosol loading (AOT >0.4) the best agreement occurs among others for Western Europe, where the fine-mode aerosol dominate (Levy et al., Citation2010).
MODISA/T 550-nm AOTs derived with c061 was found to vary within the expected uncertainties of the MODIS retrievals over land for 90% of the compared cases. Values of R2 = 0.89 and RMSDrel = 27% were found for this collection. However, MODIST 550-nm median AOT derived with c061 over land was found to be 15% higher than AERONET median AOT. In addition, it was found here that collocated matches over land between MODIS and AERONET are substantially higher for c051 than c061. Using c061 and MODIS 3-km in the study by Tesche et al. (Citation2016) also reduces the available AOTs over Sweden compared to MODIS c051. The MODIS c061 retrieval uses more aggressive tests for spatial variability of reflectance and normalized difference vegetation index (NDVI) to mask clouds and inland water bodies (Levy et al., Citation2013). Livingston et al. (Citation2014) recommend exploring whether different thresholds on cloud and NDVI masks can expand the MODIS aerosol data set in condition of smoke plumes, without a risk for contamination by clouds and highly reflecting surfaces. The present study suggest that the consequences of this new NDVI mask introduced should be further investigated also for situations with lower aerosol loadings.
MODISA/T 550-nm AOTs derived with c051 and c061 were found to vary within the expected uncertainties of the MODIS retrievals (ΔAOT = +0.04 + 0.1 AOT, ΔAOT = –0.02 – 0.1 AOT) over the coastal site GDT in the wGB, Sweden, for 79% and 75%, respectively, of the compared cases. A reason for the lower agreement in AOT between MODIS and this AERONET station is probably due to the location of the GDT (Mélin, Citation2011; Levy et al., Citation2013; Mélin et al., Citation2013): ∼30 km from the east coast of Sweden, with a minor archipelago in between.
By combining AOT derived from both MODISA and MODIST the present results show that the availability in daily AOT increases substantially compared to using data from only one of the platforms. The present results also show that the number of days with available AOT is substantially higher over the Baltic Sea (away from the coastlines) compared to the nearby land areas. The latter is confirmed in by comparing mean number of days with available AOTs between the AERONET stations GDT (ocean) and Hamburg/Belsk (land) for June and July. Higher availability in AOTs over the Baltic Sea is likely due to fewer clouds formed over water compared to the surrounding land.
In the present study it was found however that lower availability of MODIS AOTs occurs along many parts of the coastlines and between islands (e.g. in Denmark). An improper representation of the coastline by MODIS c051 has also been found in the study by Tesche et al. (Citation2016). Higher availability of MODIS AOT over the present areas was in any case found for c061 than c051. Even so, Mélin et al. (Citation2013) suggest that further improvements of the atmospheric correction in coastal waters may require an additional level of detail to describe the complex aerosol mixtures more accurately, and specific water bio-optical models for an appropriate representation of the boundary condition.
Furthermore, very low numbers of days with available AOTs were found over Sweden, particularly in April. Even so, along some of the coastlines higher numbers of days with available AOTs were found. Higher availability in AOT was also found for two belts in the east-west direction located in the middle part of eastern Sweden. Better AOT statistics for the northern belt is likely due to the location of the third largest lake in Sweden, called Mälaren. Better AOT statistics corresponding to these two belts and along the land coast are confirmed by available sun hours over land (not shown). The latter is obtained based on pyrheliometer measurements combined with daily model calculation carried out by the Swedish Meteorological and Hydrological Institute.
When comparing number of days with available AOTs between MODIS c051 and c061, a substantially higher availability was found for retrievals over land with the former collection (). The difference exceed 15% in April and July for a large part of the land area south of the Baltic Sea, while it is even larger over Sweden. Caroll et al. (Citation2017) shows that the updated land mask in c061 identifies a lot more smaller inland water bodies. This finding in combination with the more aggressive tests for spatial variability of reflectance and normalized difference vegetation index (NDVI) to mask clouds and inland water bodies (Levy et al., Citation2013), introduced in c061, likely explain this difference in AOT statistics. Simultaneously as this large difference in data coverage occurs between the two collections, the validation against AERONET shows only a slightly better agreement for MODIS c061. These findings suggest that the c061 algorithm needs to be further developed so that more of inland pixels adjacent to water bodies can be included in the retrievals of AOT. If accuracy in the retrievals of AOT for mixed pixels can be obtained we believe that passive remote sensing with MODIS can be even more useful to estimate long-term trends in AOT.
4.2. Trends in MODIS c051/c061 and AERONET AOT
Changes have been made with MODIS c061 considering the algorithm used in the retrievals of AOT, but also to address problems with calibration degradation in previous collections. A drift in c051 AOT was found for MODIST land retrievals (Remer et al., Citation2008; Levy et al., Citation2010). Levy et al. (Citation2010) validated this collection against AERONET AOT and found an overestimation of about 0.005 prior to 2004 and an underestimation of the same magnitude afterwards for MODIST. This is likely caused by a drift in the radiometric calibration (Zhang and Reid, Citation2010; Levy et al., Citation2013). For the ocean, c051 retrievals a minor offset has also been found between MODISA and MODIST AOT (about 0.015 higher for the latter platform, Remer et al., Citation2008). Thus, these biases associated with c051 applied on MODIST AOT observations may, at least partly, explain the differences found here in AOT between the two platforms and collections. This suggest that results obtained with MODS c061 should be given priority. However, since the present study also found large differences in the availability in AOT between the two collections trends in AOT obtained with MODIS c051 are presented as well.
Trends in MODIS and AERONET AOT have been investigated with respect to the months April–September. Since better availability in daily AOTs occurs over the Baltic Sea compared to the surrounded land areas this finding has been used to estimate changes in MODIS AOT for the period 2000–2017. Negative trends within the ranges 0.84%–1.70% and 1.10%–1.40% per year in AOT based on daily values were found for the swBS with MODIS c051 and c061, respectively. This can be compared to a decrease of 1.50% per year in AOT at the AERONET Hamburg station. On the whole stronger negative trends in AOT are found over the cP area and wGB for MODIS c051 and AERONET. However, the absolute values of AOT are substantially lower for AERONET GDT compared to MODIS AOT, which may be due to missing data in some years at this station, particularly for April. Particularly over cP, weaker negative trends in AOT are obtained with MODIS Collection 6.1. The negative trends estimated with MODIS c051, c061 and AERONET are nearly all statistically significant at the 95% confidence level. The present decrease in AOT during the current investigation period results in a reduction of the direct aerosol cooling effect during the high-insolation period in Northern Europe. The representation of MODIS AOT data are poor over Northern Europe during the low-light months from October to March, which means that these month are not included in the present investigation. Thus, this induces uncertainties in the present trend estimates. Even so, in subsequent investigations we plan to estimate if the decrease in AOT here has contributed to the “extra” warming that is observed over northern Europe. For the swBS and wGB areas ECMWF mean surface temperature has increased by as much as 1.8° and 1.9°, respectively, over the period 1979–2017 (April–September).
The negative trends estimated in the present study are in line with a decline in AOT with 1.1% per year that has been obtained from observations at 20 AERONET stations in Europe within the period 2000–2009 (Turnock et al., Citation2015). Substantially stronger trends in AOT (555 nm), –1.8%, –2.1% and –1.9% per year, are obtained from Multi-angle Imaging SpectroRadiometer (MISR) observations over the swBS, cP and wGB, respectively, with respect to the period 2000–2016. However, the daily data coverage is very low for MISR due to the narrow swath width. For example, for the swBS and period from April 2000 to May 2017 (April to September) this means an availability in MSR daily AOT as low as 12%. The MISR AOT can be accessed through Giovanni (https://giovanni.gsfc.nasa.gov/giovanni/).
Moreover, aerosols with a dry diameter <2.5 µm present in the boundary layer normally contribute significantly to the total attenuation. The total mass of these particles, PM2.5, is commonly measured for air-quality monitoring and can be accessed through EBAS (http://ebas.nilu.no). At several Swedish sites (e.g. Vavihill, Aspvreten, Norr-Malma) we found that PM2.5 has been declining by 3%–5% per year over the last decade. The numbers slightly vary depending on the site and the recorded period. Similar declines are seen in rural sites in Northern Germany (Waldhof) and Poland (Diable Gora). This indicates that at least part of the present negative trend in AOT in Northern Europe is due to a cleaner boundary layer.
Elevated aerosol layers that may induce uncertainties in the present AOT trends have not been investigated in the present study. At least over middle Sweden, it has however been found from spaceborne CALIPSO lidar observations that elevated aerosol layers associated with long-range transport events are rarely present (Tesche et al., Citation2016). The same has been observed from aerosol lidar measurements in Stockholm, Sweden, which were available between 2011 and 2014 (Baars et al., Citation2016). Furthermore, the contribution from stratospheric AOT on the column AOT was low an increased during the period 2002–2011 (Glantz et al. Citation2014), which means that volcanic aerosols (Vernier et al., Citation2011) do not contribute to the negative trends found here.
4.3. Transport of polluted and clean air masses
Finally, by combining 5-days back-trajectories with MODISA/T AOT derived with c061 transport of clean and polluted air masses have been investigated. The results show that swBS is associated with higher mean AOTs compared to wGB for all transport directions. For both investigation areas, the cleanest situations appear when air masses are transported over Scandinavia, including the surrounding seas. However, the higher AOTs found for swBS, compared to wGB, also for northerly winds, may be due to local ship emissions. The strongest aerosol sources are suggested to be located southwest, south and southeast of the investigation area, although the highest prevalence of these events is associated with the former direction.
To quantitatively identify aerosol sources is beyond the scope of this paper. Even so, beside Western Europe the present results suggest that aerosols from commercial ships cannot be excluded as an important source of aerosols for Northern Europe (Aulinger et al., Citation2016). The English Channel is one of the busiest shipping lanes in the world. Strong sources of aerosols, although not so frequently occurring, are also suggested to be located east of the investigation area. Moving the site for the back-trajectories to Minsk in Belarus, east of the investigation area, and combining it with the 75th percentile of AOT suggest a substantially higher frequency of transport of air masses with high aerosol content from east (not shown). This is likely explained by agricultural or forest fires in Ukraine or Russia (Stohl et al., Citation2007; Cook et al., Citation2008; Glantz et al., Citation2009).
Acknowledgments
We thank the PIs of the AERONET sites used in this study for maintaining their stations. We acknowledge the MODIS mission scientists and associated NASA personnel for the production of the data used in this research effort. The authors are also thankful for the use of ECMWF data sets. We wish to thank the anonymous reviewer for the helpful comments. Finally, the authors are very thankful for the use of in situ aerosol data that are measured by the Department of Analytical Chemistry and Environmental Science (ACES) at Stockholm University.
Disclosure statement
No potential conflict of interest was reported by the authors.
References
- Al-Saadi, J., Szykman, J., Pierce, R. B., Kittaka, C., Neil, D. and co-authors. 2005. Improving national air quality forecasts with satellite aerosol observations. Bull. Amer. Meteor. Soc. 86, 1249–1261. doi:10.1175/BAMS-86-9-1249.
- Aulinger, A., Matthias, V., Zeretzke, M., Bieser, J., Quante, M. and co-authors. 2016. The impact of shipping emissions on air pollution in the North Sea region – Part 1: Current emissions and concentrations. Atmos. Chem. Phys. 16, 739–758. doi:10.5194/acp-16-739-2016.
- Baars, H., Kanitz, T., Engelmann, R., Althausen, D., Heese, B. and co-authors. 2016. An overview of the first decade of PollyNET: An emerging network of automated Raman-polarization lidars for continuous aerosol profiling. Atmos. Chem. Phys. 16, 5111–5137. doi:10.5194/acp-16-5111-2016.
- Boucher, O., Randall, D., Artaxo, P., Bretherton, C. and co-authors. 2013. Clouds and aerosols. In: Climate Change 2013: The Physical Science Basis. Contribution of Working Group I to the Fifth Assessment Report of the Intergovernmental Panel on Climate Change (eds. T.F. Stocker, D. Qin, G. -K. Plattner, M. Tignor, S. K. Allen, J. Doschung, A. Nauels, Y. Xia, V. Bex, and P. M. Midgley). Cambridge University Press, Cambridge, pp. 571–657. doi:10.1017/CBO9781107415324.016.
- Box, G. E. P., Jenkins, G. M. and Reinsel, G. C. 1994. Time Series Analysis: Forecasting and Control. 3rd ed. Upper Saddle River, NJ, Prentice-Hall.
- Brockwell, P. J. and Davis, R. A. 2002. Introduction to Time Series and Forecasting. 2nd ed. New York, NY, Springer.
- Caroll, M. L., DiMiceli, C. M., Townshend, J. R. G., Sohlberg, R. A., Elders, A. I. and co-authors. 2017. Development of an operational land water mask for MODIS Collection 6, and influence on downstream data products. International Journal of Digital Earth 10, 207–218. doi:10.1080/17538947.2016.1232756.
- Carslaw, K. S., Lee, L. A., Reddington, C. I., Pringle, K. J., Rap, A. and co-authors. 2013. Large contribution of natural aerosols to uncertainty in indirect forcing, Nature, 503. doi:10.1038/nature12674.
- Cook, A., Willis, P., Webster, H. and Harrison, M. 2008. UK Air Quality Forecasting: A UK Particulate Episode from 24th March to 2th April 2007. Report AEAT/ENV/R/2566 Issue 1. AEA Technology plc, AEA Energy & Environment, Oxfordshire, UK.
- de Meij, A., Pozzer, A. and Lelieveld, J. 2012. Trend analysis in aerosol optical depths and pollutant emission estimates between 2000 and 2009. Atmos. Environ 51, 75–85. doi:10.1016/j.atmosenv.2012.01.059.
- Draxler, R. R. and Rolph, G. D. 2003. HYSPLIT (HYbrid Single-Particle Lagrangian Integrated Trajectory) Model Access via NOAA ARL READY. Website. NOAA Air Resources Laboratory, Silver Spring, MD. Online at: http://www.arl.noaa.gov/ready/hysplit4.html
- Gao, B., Yang, P., Han, W., Li, R. and Wiscombe, W. 2002. An algorithm using visible and 1.38-mu m channels to retrieve cirrus cloud reflectances from aircraft and satellite data. IEEE Trans. Geosci. Remote Sensing 40, 1659–1668. doi:10.1109/TGRS.2002.802454.
- Glantz, P., Johansson, C., Kokhanovsky, A. and von Hoyningen-Huene, W. 2009. Estimating PM2.5 over southern Sweden using spaceborne optical measurements. Atmos. Environ 43, 5838–5846. doi:10.1016/j.atmosenv.2009.05.017.
- Glantz, P. and Tesche, M. 2012. Assessment of two aerosol optical thickness retrieval algorithms applied to MODIS Aqua and Terra data in Europe. Atmos. Meas. Tech. 5, 1727–1740. doi:10.5194/amt-5-1727-2012.
- Glantz, P. B., Herber, A., Iversen, A., Karlsson, T. and Co-Authors, J. 2014. Remote sensing of aerosols in the Arctic for an evaluation of global climate model simulations. J. Geophys. Res. Atmos. 119(13), 8169–8188. doi:10.1002/2013JD021279.
- Granier, C., Bessagnet, B., Bond, T., D’Angiola, A., Denier van der Gon, H. and co-authors. 2011. Evolution of anthropogenic and biomass burning emissions of air pollutants at global and regional scales during the 1980–2010 period. Clim. Change 109, 163–190. doi:10.1007/s10584-011-0154-1.
- Guerreiro, C., Ortiz, A. G., de Leeuw, F., Viana, M. and Horálek, J. 2016. Air Quality in Europe – 2016 Report, EEA Report 26. European Environment Agency, Copenhagen, Denmark.
- Hand, J. L., Schichtel, B. A., Malm, W. C. and Pitchford, M. L. 2012. Particulate sulfate ion concentration and SO2 emission trends in the United States from the early 1990s through 2010. Atmos. Chem. Phys. 12, 10353–10365. doi:10.5194/acp-12-10353-2012.
- Holben, B. N., Eck, T. F., Slutsker, I., Tanré, D., Buis, J. P. and co-authors. 1998. AERONET – A federated instrument network and data archive for aerosol characterization. Remote Sens. Environ. 66, 1–16. doi:10.1016/S0034-4257(98)00031-5.
- IPCC. 2013. Climate Change 2013. In: The Physical Science Basis. Contribution of Working Group I to the Fifth Assessment Report of the Intergovernmental Panel on Climate Change (eds. T. F. Stocker, D. Qin, G.-K. Plattner, M. Tignor, S. K. Allen, J. Boschung, A. Nauels, Y. Xia, V. Bex and P. M. Midgley). Cambridge University Press, Cambridge, UK1535 pp. doi:10.1017/CBO9781107415324.
- Karnieli, A., Derimian, Y., Indoitu, R., Panov, N., Levy, R. and and co-authors. 2009. Temporal trend in anthropogenic sulfur aerosol transport from central and eastern Europe to Israel. J. Geophys. Res. 114, D00D19. doi:10.1029/2009JD011870.
- Kishcha, P., Starobinets, B. and Alpert, P. 2007. Latitudinal variations of cloud and aerosol optical thickness trends based on MODIS satellite data. Geophys. Res. Lett. 34, L05810. doi:10.1029/2006GL028796.
- Koren, I. and Kaufman, Y. J. 2004. Direct wind measurements of Saharan dust events from Terra and Aqua satellites. Geophys. Res. Lett. 31, L06122. doi:10.1029/2003GL019338.
- Koukouli, M. E., Kazadzis, S., Amiridis, V., Ichoku, C., Balis, D. S. and co-authors. 2010. Signs of a negative trend in the MODIS aerosol optical depth over the Southern Balkans. Atmos. Environ. 44, 1219–1228. doi:10.1016/j.atmosenv.2009.11.024.
- Lamarque, J.-F., Bond, T. C., Eyring, V., Granier, C., Heil, A. and co-authors. 2010. Historical (1850–2000) gridded anthropogenic and biomass burning emissions of reactive gases and aerosols: Methodology and application. Atmos. Chem. Phys. 10, 7017–7039. doi:10.5194/acp-10-7017-2010.
- Levy, R. C., Mattoo, S., Munchak, L. A., Remer, L. A., Sayer, A. M. and co-authors. 2013. The Collection 6 MODIS aerosol products over land and ocean. Atmos. Meas. Tech. 6, 2989–3034. doi:10.5194/amt-6-2989-2013.
- Levy, R. C., Remer, L. A., Kleidman, R. G., Mattoo, S., Ichoku, C. and co-authors. 2010. Global evaluation of the Collection 5 MODIS dark-target aerosol products over land. Atmos. Chem. Phys. 10, 10399–10420. doi:10.5194/acp-10-10399-2010.
- Levy, R. C., Remer, L. A., Mattoo, S., Vermote, E. F. and Kaufman, Y. J. 2007. Second-generation operational algorithm: Retrieval of aerosol properties over land from inversion of Moderate Resolution Imaging Spectroradiometer spectral reflectance. J. Geophys. Res. Atmos. 112, D13211. doi:10.1029/2006JD007811.
- Li, R. R., Kaufman, Y. J., Gao, B. C. and Davis, C. O. 2003. Remote sensing of suspended sediments and shallow coastal waters. IEEE T. Geosci. Remote 41, 559–566.
- Li, R. R., Remer, L., Kaufman, Y. J., Mattoo, S., Gao, B. C. and co-authors. 2005. Snow and ice mask for the MODIS aerosol products. IEEE Geosci. Remote Sensing Lett. 2, 306–310. doi:10.1109/LGRS.2005.847755.
- Livingston, J. M., Redemann, J., Shinozuka, Y., Johnson, R., Russell, P. B. and co-authors. 2014. Comparison of MODIS 3 km and 10 km resolution aerosol optical depth retrievals over land with airborne sunphotometer measurements during ARCTAS summer 2008. Atmos. Chem. Phys. 14, 2015–2038. doi:10.5194/acp-14-2015-2014.
- Martins, J. V., Tanré, D., Remer, L., Kaufman, Y., Mattoo, S. and co-authors. 2002. MODIS Cloud screening for remote sensing of aerosols over oceans using spatial variability. Geophys. Res. Lett. 29, 8009. doi:10.1029/2001GL013252.
- Mélin, F. 2011. Comparison of SeWiFS and MODIS time series of inherent properties for the Adriatic Sea. Ocean Sci. 7, 351–361. doi:10.5194/os-7-351-2011.
- Mélin, F., Zibordi, G., Carlund, T., Holben, B. N. and Stefan, S. 2013. Validation of SeaWiFS and MODIS Aqua/Terra aerosol products in coastal regions of European marginal seas. Oceanologia 55, 27–51. doi:10.5697/oc.55-1.027.
- Mishchenko, M. I., Liu, L., Geogdzhayev, I. V., Travis, L. D., Cairns, B. and Lacis, A. A. 2010. Toward unified satellite climatology of aerosol properties, 3. MODIS versus MISR versus AERONET. J. Quant. Spectrosc. Ra. 111, 540–552.
- Papadimas, C. D., Hatzianastassiou, N., Mihalopoulos, N., Querol, X. and Vardavas, I. 2008. Spatial and temporal variability in aerosol properties over the Mediterranean basin based on 6-year (2000 - 2006) MODIS data. J. Geophys. Res. 113, D11205. doi:10.1029/2007JD009189.
- Remer, L. A., Kaufman, Y. J., Tanre, D., Mattoo, S., Chu, D. A. and co-authors. 2005. The MODIS aerosol algorithm, products, and validation. J. Atmos. Sci. 62, 947–973. doi:10.1175/JAS3385.1.
- Remer, L. A., Kleidman, R. G., Levy, R. C., Kaufman, Y. J., Tanré, D. and co-authors. 2008. Global aerosol climatology from the MODIS satellite sensors. J. Geophys. Res. Atmos. 113, D14S07. doi:10.1029/2007JD009661.
- Remer, L. A., Mattoo, S., Levy, R. C., Heidinger, A., Pierce, R. B. and co-authors. 2012. Retrieving aerosol in a cloudy environment: aerosol product availability as a function of spatial resolution. Atmos. Meas. Tech. 5, 1823–1840. doi:10.5194/amt-5-1823-2012.
- Salomonson, V. V., Barnes, W. L., Maymon, P. W., Montgomery, H. E. and Ostrow, H. 1989. MODIS: Advanced facility instrument for studies of the Earth as a system. IEEE Trans. Geosci. Remote Sensing 27, 145–153. doi:10.1109/36.20292.
- Smirnov, A., Holben, B. N., Eck, T. F., Dubovik, O. and Slutsker, I. 2000. Cloud screening and quality control algorithms for the AERONET database. Remote Sens. Environ. 73, 337–349. doi:10.1016/S0034-4257(00)00109-7.
- Smith, S. J., van Aardenne, J., Klimont, Z., Andres, R. J., Volke, A. and co-authors. 2011. Anthropogenic sulfur dioxide emissions: 1850–2005. Atmos. Chem. Phys. 11, 1101–1116. doi:10.5194/acp-11-1101-2011.
- Stohl, A., Berg, T., Burkhart, J. F., Fjæraa, A. M., Forster, C. and co-authors. 2007. Arctic smoke – record high air pollution levels in the European Arctic due to agricultural fires in Eastern Europe in spring 2006. Atmos. Chem. Phys. 7, 511–534. doi:10.5194/acp-7-511-2007.
- Tesche, M., Glantz, P. and Johansson, C. 2016. Spaceborne observations of low surface aerosol concentrations in the Stockholm region. Tellus B 68, 28951. doi:10.3402/tellusb.v68.28951.
- Turnock, S. T., Spracklen, D. V., Carslaw, K. S., Mann, G. W., Woodhouse, M. T. and co-authors. 2015. Modelled and observed changes in aerosols and surface solar radiation over Europe between 1969 and 2009. Atmos. Chem. Phys. 15, 9477–9500. doi:10.5194/acpp-15-9477-2015.
- Vernier, J., Thomason, L., Pommereau, J.-P., Bourassa, A., Pelon, J. and co-authors. 2011. Major influence of tropical volcanic eruptions on the stratospheric aerosol layer during the last decade. Geophys. Res. Lett. 38, L12807. doi:10.1029/2011GL047563.
- Vestreng, V., Myhre, G., Fagerli, H., Reis, S. and Tarrasón, L. 2007. Twenty-five years of continuous sulphur dioxide emission reduction in Europe. Atmos. Chem. Phys. 7, 3663–3681. doi:10.5194/acp-7-3663-2007.
- von Storch, H. and Zwiers, F. W. 1999. Statistical Analysis in Climate Research. Cambridge University Press, Cambridge, UK.
- Weatherhead, E. C., Reinsel, G. C., Tiao, G. C., Meng, X.-L., Choi, D. and co-authors. 1998. Factors affecting the detection of trends: Statistical considerations and applications to environmental data. J. Geophys. Res. 103, 17149–17161.
- Zhang, J. and Reid, J. S. 2010. A decadal regional and global trend analysis of the aerosol optical depth using a data-assimilation grade over-water MODIS and Level 2 MISR aerosol products. Atmos. Chem. Phys. 10, 10949–10963. doi:10.5194/acp-10-10949-2010.