
Abstract
Cirrus clouds play a significant role in the Earth’s energy balance and in the hydrological cycle of the atmosphere. Here, a high-performance Micro Pulse Lidar was continuously used to investigate cirrus cloud formation and characteristics at Ali (32.50°N, 80.08°E; 4279 m), in the western Tibetan Plateau from 25 July to 23 September 2016, a time frame that spanned the prevalence and degeneration period of the Asian summer monsoon (ASM). The cirrus clouds frequently occurred with sharp fluctuations in the vertical distribution from 8 to 14 km above ground level (AGL) during the ASM period. In contrast, cirrus clouds were remarkably reduced and consistently existed near 10 km in September, when the ASM began subsiding due to the lack of a driving force that triggers ice formation. Approximately half of the cirrus clouds were caused by deep convective activity during the ASM period, which held one-third of total cirrus clouds during the whole measurement period. These anvil cirrus clouds have a liquid origin and are characterised by optically thicker clouds with Cloud Optical Depth values greater than 0.2, high depolarisation ratios and high lidar ratios. These observations indicate that, in agreement with other studies at mid-latitudes and in the Arctic, liquid origin cirrus could be associated with thicker, larger and more complex nonspherical ice crystals in comparison to in situ formed cirrus. Cold perturbations were responsible for the formation and evolution of the remaining two-thirds of cirrus clouds. These clouds were mostly associated with in situ formation of ice crystals, in the slow updrafts in the tropical transition layer over the Tibetan Plateau.
1. Introduction
Cirrus clouds are predominantly composed of non-spherical ice crystal particles (e.g., Lynch et al., Citation2002) that appear frequently in the tropical transition layer (TTL) region. Cirrus clouds are one of the largest sources of uncertainty in the Earth’s energy balance due to albedo and greenhouse effects (McFarquhar et al., Citation2000, Zerefos et al., Citation2003, Boucher et al., Citation2013). Additionally, cirrus clouds are crucial to the atmospheric hydrological cycle via the stratosphere–troposphere exchange of water vapour. Recent research shows that increased stratospheric water vapour is linked mainly to the occurrence of cirrus clouds in the TTL (Randel and Jensen, Citation2013).
The net radiation effect of cirrus clouds depends strongly on their microphysical parameters, including ice crystal number, size, and shape (Liou, Citation1986; Zhang et al., Citation1999; Gallagher et al., Citation2012), in addition to macroscopic cloud properties, such as optical thickness, ice water content (IWC), and geometric extent (Kienast-Sjögren et al., Citation2016; Schnaiter et al., Citation2016). Thin cirrus clouds usually contribute to a positive radiative forcing in the upper-level troposphere, whereas thick cirrus clouds may produce cooling (Stephens and Webster, Citation1981; Fu and Liou, Citation1993; Fahey and Schumann, Citation1999; Fu et al., Citation2002). Microphysical properties of cirrus clouds, including number density, and the size and shape of ice crystals, affect cloud lifetimes in the TTL region (Jensen and Toon, Citation1994). The special properties of cirrus clouds are determined by certain cirrus formation types. For example, heterogeneous ice nucleation (mostly immersion freezing) can occur already just below 0 °C and plays a pivotal role in the formation of liquid origin cirrus clouds in the sub tropics, likely because of moderate updrafts in comparison to tropical deep convection and the high loading of heterogeneous INs in the subtropical upper troposphere (UT) (Cziczo et al., Citation2013). In in situ origin cirrus, heterogeneous freezing (here mostly deposition freezing) can occur at RHi ∼ 100% (DeMott et al., Citation2003a), but most often the freezing RHi are higher, varying between 110% and close to the homogeneous freezing threshold. One essential condition for homogeneous freezing is that the relative humidity must be strongly supersaturated with respect to ice (RHi = 130% to 150%) at T = 235–190 K.
Liquid origin and in situ origin indicate whether cirrus clouds are formed at lower altitudes by the freezing of existing water droplets at water saturation, or alternatively via the freezing of solution droplets or heterogeneous nucleation at the respective ice supersaturation, but below water saturation (Krämer et al., Citation2016). More specifically, in in situ originated cirrus clouds, the ice crystals form directly from the gas phase (at T < 235 K) via different ice nucleation mechanisms (heterogeneous or homogeneous), depending on the prevailing strength of updrafts. In slow updrafts, cirrus clouds are particularly thin and have lower IWC and ice crystal number concentration values (Nice), but also exhibit larger ice crystals due to limited ice nuclei (IN) concentrations in the atmosphere (Rogers et al., Citation1998). Exceptions occur in locations with abnormally abundant IN, such as in outflow regions of dust storms (DeMott et al., Citation2003a), where heterogeneous formation primarily occurs. In contrast, thicker cirrus clouds form in fast updrafts with higher IWCs (and Nice), and their formation is mostly homogeneous. Cirrus clouds with liquid origin form when ice crystals nucleated (at T > 235 K) by heterogeneous freezing of liquid drops that are then subsequently transported to higher altitudes. When the updrafts are high enough, homogeneous ice nucleation of supercooled liquid drops (at around T = 235 K) can occur (Krämer et al., Citation2016; Luebke et al., Citation2016; Wernli et al., Citation2016).
The Asian summer monsoon (ASM) system transports abundant anthropogenic aerosol precursor emissions from Asia, coupled with rapid vertical transport to the UT, followed by confinement within the upper-level ASM anticyclone (Fu et al., Citation2006; Park et al., Citation2009; Randel et al., Citation2010). Satellite observations have illustrated that significantly high concentrations of some chemical components (H2O, CO, CH4, C2H6, C2H2, NOx, N2O, and HCN) are found in the ASM anticyclone of the UTLS during the ASM period (Park et al., Citation2004, Citation2007, Citation2008, Citation2009; Kar et al., Citation2004; Li et al., Citation2005; Randel and Park, Citation2006; Xiong et al., Citation2009; Randel et al., Citation2010), in addition to the highest aerosol concentrations (Vernier et al., Citation2011; Thomason and Vernier, Citation2013). Gao et al. (Citation2003) examined seasonal variation of water vapour and cirrus clouds over the Tibetan Plateau and observed that the mean high cloud reflectance over the plateau reaches its maximum in April and its minimum in November. Further, Chen and Liu (Citation2005) observed that a substantial number of cirrus clouds in March and April were generated by relatively warm and moist air being slowly lifted over a large area via topographic lifting. Moreover, satellite observations have indicated that cirrus clouds are associated with outflow from deep convection that frequently occurs over the Tibetan Plateau (Li et al., Citation2005; Fu et al., Citation2006; Jin, Citation2006). As in subtropical regions, the deep convection activities are predominant over the Tibetan Plateau during the ASM period. These processes, along with topographic lifting and abundant aerosols and their precursors in UTLS, could act together to promote ice formation, resulting in frequent cirrus cloud occurrence.
Optical image observations from satellites provide valuable information on cirrus clouds, but they have limited temporal and vertical spatial resolution. This limitation underscores the need for local active remote sensing, such as lidar, which is one of the most useful instruments for cirrus cloud investigation, due to its capability to detect high and optically thin cirrus clouds (Wang et al., Citation2005; Noel et al., Citation2007). Key microphysical parameters of cirrus clouds include the extinction coefficient, extinction-to-backscatter ratio, cloud-base height, and cloud geometric depth (Sunilkumar and Parameswaran, Citation2005). Cloud-top and tropopause relationships from Cloud–Aerosol Lidar and Infrared Pathfinder Satellite Observations (CALIPSO; http://www-calipso.larc.nasa.gov/) (Pan and Munchak, Citation2011) measurements and a case study of cirrus cloud properties from balloon-borne optical particle counters (Tobo et al., Citation2007) have been recently reported for the Tibetan Plateau. Nevertheless, vertically and temporally resolved measurements of cirrus cloud properties are still scarce over the plateau. He et al. (Citation2013) investigated the geometric and optical properties of cirrus clouds over Naqu (31.29°N, 92.04°E, 4507 m above sea level; asl) within the northern Tibetan Plateau, and found that deep convective activity and Rossby waves are important dynamic processes that control variation of cirrus clouds. In particular, both anvil cirrus outflowing from convective cumulonimbus clouds and large-scale strong cold perturbations in the UT can play key roles in cirrus cloud formation. However, the nucleation mechanisms and contributions of ASM anticyclones to cirrus cloud occurrences were not investigated due to the lack of appreciable and reliable water vapour sounding in the UTLS region, and a relatively short measurement period.
In the present study, micropulse lidar (MPL) observations of cirrus clouds were performed for more than 1400 h in Ali, within the western Tibetan Plateau, and about 100 radiosondes were launched. The experiment was conducted between July and September 2016, such that the underlying dataset spans the prevalence and degenerating period of the summer monsoon. The temporal variation in cirrus clouds and their mechanisms of formation were examined over the Tibetan Plateau using the newly available 2-month lidar cirrus cloud dataset obtained from the Variation of Land-atmosphere Coupled Systems and its Global Climate Effect over the Tibetan Plateau project. Using the most comprehensive lidar- and radiosonde-based cirrus cloud statistics for the Tibetan region, the obvious optical characteristics of cirrus clouds were connected to different formation mechanisms. The article is organised as follows. Section 2 describes the experimental procedures and methods of data analysis. In Section 3, the process of cirrus cloud formation and the optical properties of observed cirrus layers are discussed. Finally, Section 4 summarises the findings.
2. Experiments and methods
The field experiment was conducted at Ali (32.50°N, 80.08°E; 4279 m asl), which is located in the western Tibetan Plateau, from July 25 to September 23, 2016.
2.1. Micro pulse lidar
A micro-pulse lidar (MPL-4B, Sigma Space Corp., USA) was co-located with the balloon launch site. The MPL is a backscatter lidar and uses an Nd: YVO4 laser with an output power of 12 μJ at 532 nm and a repetition rate of 2500 Hz. The vertical resolution and integration time of the MPL lidar observations are 30 m and 30 s, respectively. The diameter of the receiving telescope is 20 cm, and the field of view (FOV) is 0.1 mrad. The relatively small FOV reduces background noise and renders the multiple scattered signals from optically thin cirrus clouds negligible. The receiver channels are designed to detect the depolarisation of backscattered light.
Only clouds above 8.0 km high (AGL) were considered to avoid the possible influence of water clouds on our analysis. We used the cloud mask algorithm of Clothiaux et al. (Citation1998) to identify cloud boundaries from the lidar backscatter profiles, and subsequently applied the algorithm of Comstock and Sassen (Citation2001) to calculate cloud extinction coefficients, α (km−1) with a precision of 0.01 km−1, and the lidar ratio (LR, sr) of cirrus clouds. The visible cirrus cloud optical depth (COD) calculation involves integrating the values of the lidar cloud between the cloud base, Hb, and the top, Ht. The uncertainty in the optical depth and the column lidar ratio that is introduced by the multiple scattering correction is estimated as 10%, and is due to the unknown effective size of cirrus particles (Chen et al., Citation2002). The upper limit of COD from lidar detected cirrus is set to 1 to exclude significant uncertainty in the optical depth due to the multiple scattering effect following the scheme of Chen et al. (Citation2002). The depolarisation ratio (DPR) of 532 nm is defined as the ratio of the perpendicular component of the backscatter signal to the parallel component, with respect to the polarisation plane of the emitted laser beam. This parameter is used to derive the phase of the cloud and subsequently identify the type of ice crystals present within the cloud. The DPR equals zero for spherical particles. Cirrus clouds are mostly composed of nonspherical ice crystals that will result in significant depolarisation. High-altitude cirrus clouds are mostly thin and their optical attenuation is weak. Consequently, the laser pulse can penetrate the cirrus cloud completely and the signal transition from the top of the cirrus cloud to clear air can be detected. However, lidar signal is occasionally heavily attenuated, or missing, due to thick clouds at low altitude, resulting in failure to detect cirrus (if at all possible) above them using lidar, thereby resulting in less accurate determination of cirrus cloud numbers.
2.2. Balloon-borne sonde observations
Ninety-six L-band (GTS1) electronic radiosondes (Nanjing Bridge Machinery Co., Ltd., China) were launched during the field campaign to provide vertical profiles of pressure, temperature, and humidity up to 20–25 km (AGL). The radiosondes were released at the lidar field site at Ali twice daily at 0000 and 1200 UTC (LST-8). Daily vertical distributions of temperature and the levels of tropopause were consequently recorded.
2.3. Satellite observations
National Oceanic and Atmospheric Administration (NOAA) satellites provide outgoing longwave radiation (OLR) data for the top of the atmosphere. OLR data are calculated daily by the Climate Diagnostic Center (CDC) division of NOAA (Liebmann and Smith, Citation1996), and the horizontal resolution is 2.5° by 2.5°. The missing values are computed by applying spatial and temporal interpolations. The OLR measurements in this dataset are calculated by converting channel radiances from 10 to 12 μm, as measured by the Advanced High-Resolution Radiometer aboard the NOAA operational polar orbiting satellites. The daily mean is the average of one daytime and one nighttime measurement. The OLR emitted by high, cold, and deep convective clouds is much lower than that by warmer, lower clouds or by the surface. Values less than 200 W m−2 typically indicate deep convection (Fujiwara et al., Citation2009). Deep convection, in turn, indicates regions with extensive lifting of air that may play roles in the formation of cirrus clouds.
The CALIPSO measures the vertical distribution of aerosols and clouds, in addition to their optical and physical properties using near-nadir-viewing geometry with two-wavelength (532 and 1064 nm) polarisation-sensitive lidar (Winker et al., Citation2009). This study utilised version 3.01 of the level-1 aerosol data that have a vertical and horizontal resolution of 60 m and 1,000 m, respectively. The data represent the altitude region between 8.2 and 20.2 km, from which the total backscatter in this layer is obtained by integrating the backscatter efficient. Cloudy pixels with a mean volume DPR greater than 5% are removed.
3. Results
3.1. Cirrus cloud formation mechanisms
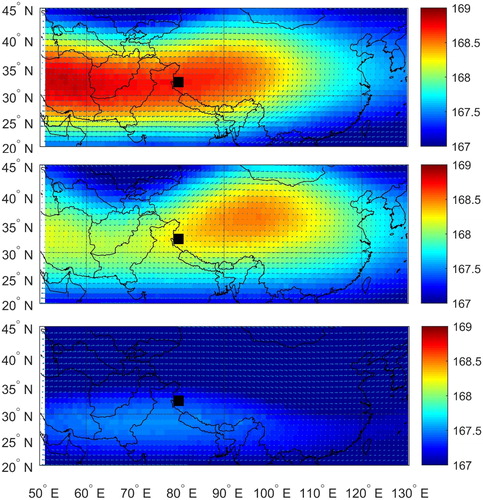
shows the distribution of monthly averaged geopotential height and wind field at 100 hPa over central Asia between July and September. The obvious anticyclone and high barometric pressure indicate that the ASM anticyclone is present over the Tibetan Plateau in July and moves eastward, with the edge of the ASM anticyclone located at the experimental site in August. The ASM anticyclone decays significantly in September with a weak high pressure center over northern India. The frequent, deep convective activities are associated with the ASM anticyclone.
Fig. 1. The distribution of monthly averaged geopotential height (in gpm) and wind field at 100 hPa over central Asia in (a) July, (b) August, and (c) September. The observation site is indicated by a black square.
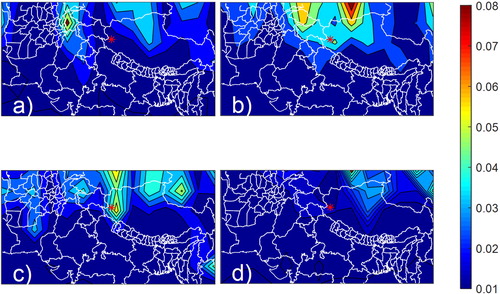
shows the distribution of the monthly averaged total backscatter values between June and September. The four consecutive monthly maps depict the presence of a remarkable layer of high aerosol concentration, extending from the Eastern Mediterranean region to Western China with a value between 0.03 and 0.08. The total backscatter increased from June to August over the Ali location and decreased dramatically in September, correlating perfectly with variation in the ASM anticyclone. Actually, the maximum aerosol concentration near the tropopause over the Tibetan Plateau has also been observed by lidar and balloon borne measurements (Tobo et al., Citation2007; He et al., Citation2013). Li et al. (Citation2005) showed that the aerosol plume is detectable in the anticyclone around the altitude of 150 hPa over the Tibetan Plateau through satellite observations and model study. Frey et al. (Citation2011) proposed that nucleation events at very low temperatures accompanied by the outflow of convective systems could be dominant process in the production of the Asian Tropopause Aerosol Layer (ATAL). Aircraft measurements in the UT over Asia indicated that the ATAL at lower altitudes consists mainly of sulfate and carbonaceous aerosols (Martinsson et al., Citation2014). Vernier et al. (Citation2015) found that there is a 1-month phase lag of the aerosol scattering ratio from Cloud-Aerosol Lidar and Infrared Pathfinder Satellite Observation (CALIPSO) after the RHi from the Microwave Limb Sounding (MLS) at the beginning of the convective period (May/June), which could possibly be caused by the growth of the nanometric particles to the larger particles that can be detected by satellites.
Fig. 2. The distribution of the monthly averaged total aerosol backscatter (sr−1) from CALIPSO measurements over central Asia between 8.2 and 20.2 km altitude in (a) June, (b) July, (c) August, and (d) September. The observation site is indicated by a red asterisk.
Significantly high concentrations of some chemical components and aerosols have been observed in the UTLS within the ASM anticyclone during the ASM period. Further, mineral dust particles were observed in the residuals of evaporated ice crystals in cirrus-forming regions (Cziczo et al., Citation2013; Cziczo and Froyd, Citation2014) and in the free troposphere at Mount Werner, Colorado, at 3220 m asl (DeMott et al., Citation2003b). Combinations of natural mineral dust/fly ash and metallic particles were also identified as INs in natural and anthropogenic air masses (Chen et al., Citation1998; DeMott et al., Citation2003b; Richardson et al., Citation2007). Additionally, sulfate and organic aerosols play a role in tropical tropopause cirrus cloud formation (Froyd et al., Citation2010). Tobo et al. (Citation2007) also suggested that selective ice nucleation on heterogeneous ice nuclei might be more efficient at cirrus temperatures. Therefore, aerosol particles on the UTLS over the Tibetan Plateau could act as INs to induce the heterogeneous freezing process.
illustrates the temporal variation of the daily mean bottoms and tops of cirrus clouds (blue and red triangles). The cirrus clouds frequently occur with a sharp fluctuation of vertical distribution from 8 to 14 km in the ASM period (July–August), whereas they are remarkably reduced and consistently existed near 10 km in September when the ASM begins subsiding. The geometric extent of cirrus clouds is generally upwards of 1–2 km over the whole observation period. The lapse rate tropopause (LRT, blue line) is defined as the level at which the lapse rate becomes −2 K/km, given that the average lapse rate from this level to the next two kilometers is less than 2 K/km (WMO, Citation1957). All of the cirrus clouds occurred at altitudes near and below the cold point tropopause (CPT, red line), and even the LRT. The maximum convective outflow level (COL, yellow line) is the altitude of the minimum potential temperature gradient (Pandit et al., Citation2014). Most COLs are located between 8 and 10 km, just below the bottom, or inside of, cirrus clouds during the ASM period. In contrast, they significantly decrease to about 7 km, far below the bottom of cirrus clouds, when the ASM starts subsiding in September, indicating that cirrus cloud occurrence is closely related to deep convective activities during the ASM period. Consequently, liquid origin cirrus clouds are absent after the ASM period due to reduced convective activity. As observed over Naqu in 2011, anvil cirrus clouds outflowing from convective cumulonimbus clouds in the UT play a key role in cirrus cloud formation (He et al., Citation2013). Meanwhile, aerosol abundance decreases due to the lack of a driving force for upward transportation from deep convective activities when the ASM starts subsiding. Thus, the cirrus observed after the ASM are farer away from the COL, most likely in situ origin, probably formed in slow updrafts. The deviation field from the average temperature of radiosondes between July and September 2016 is overlaid on (white and black background color). A remarkable cold perturbation was observed near the tropopause between August 3 and 16 (see the black region below the LRT), and in the UT after August 25, when the COL was far from the bottom of cirrus clouds, however, some cirrus clouds were still observed. Cirrus cloud occurrences are hypothesised to generally increase when strong cold perturbations occur in the tropopause layer and in the UT (Randel and Jensen, Citation2013; He et al., Citation2013; Kim and Alexander, Citation2015), which are more possibly connected to in situ origin.
Fig. 3. (a) Deviation field from the average temperature of the radiosondes in the summer of 2016. The white and black areas correspond to positive and negative deviations from the average temperature, respectively. The blue and red triangles are the observed bottoms and tops of cirrus clouds, respectively, and the red, blue, and yellow lines correspond to CPT (Cold Point Tropopause), LRT (Lapse rate Tropopause), and COL (Convective Outflow Level) altitudes, respectively. (b) Temporal variation of temperature deviation within cirrus clouds. (c) The attribution of temperature deviation proportions.
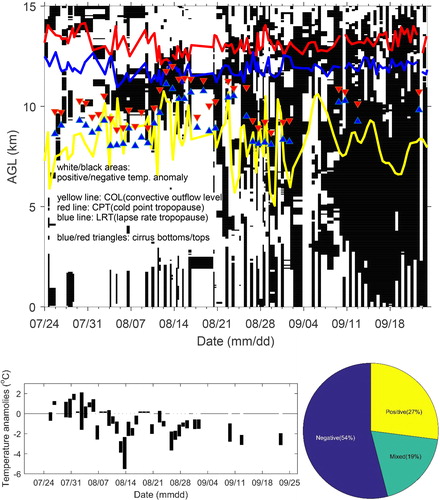
To investigate the contributions of cold perturbations on the formation of cirrus clouds, temporal variation of temperature deviation is plotted in . Further, the fractions of temperature deviation are shown in , based on the sign of the deviations inside cirrus clouds. ‘Positive’ means the case with coincident positive deviations inside cirrus clouds; ‘Negative’ means that with coincident negative deviations, while ‘Mixed’ represents temperature deviations inside cirrus clouds containing both positive and negative deviations. The y-axis of ranges between the extreme values of the temperature deviations inside daily cirrus clouds. Positive deviations, with occasional negative deviations, generally occur before August 11, while negative deviations are prevalent after that date. The cirrus clouds with positive deviations only represent 27% of all of the observations, which are also characterised by remarkably close COLs to cloud bottoms. Liquid origins of anvil cirrus can be inferred as outflowing from deep convective activities that are generated at low altitudes, while those formed in situ are more closely connected to cold perturbations. Deep convective clouds generate anvil cirrus clouds when winds in the UT remove ice crystals from the top of the large convective column, which then persist for between 0.5 and 3.0 days, even after the deep convective cloud dissipates (Seifert et al., Citation2007). Comparisons of our observations with those of other studies indicate similarities in cirrus cloud altitude over the Tibetan Plateau with those at tropical sites. For example, Comstock et al. (Citation2002) proposed two distinct types of cirrus clouds at Nauru, in the tropical western Pacific, with one having cloud base altitudes above 15 km, and the other below this height and exhibiting distinctive characteristics. Moreover, Liu and Zipser (Citation2005) observed that only 1.38% and 0.1% of cirrus clouds from tropical convective systems reached altitudes of 14 km and 16.8 km, respectively. These results can be illustrated with an origin of cirrus clouds close to the tropopause from convection that penetrates the tropopause, while the lower cirrus clouds are the ceiling of most convection.
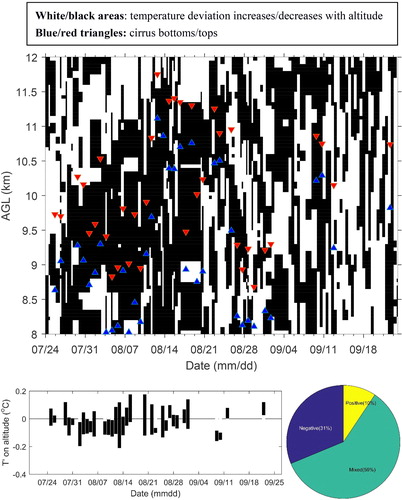
It should be noted that cirrus clouds do not always occur under cold perturbation conditions, and especially in September when the ASM system begins to decay. The gradient of temperature deviation with altitude (T’), along with overlapped cirrus cloud prevalence is shown in . The negative gradient (black background: temperature deviation decreases with altitude) is predominant during the ASM period, and then changes to a positive gradient (white background: temperature deviation increases with altitude) after that, which could further influence the interpretation of cirrus cloud reduction. The prevailing cirrus clouds with negative gradients () are consistent with the results of Kim et al. (Citation2016), wherein negative gradients in temperature deviation with altitude favors their formation and maintenance.
Fig. 4. Data are plotted following , but with the gradient of temperature deviation plotted with altitude.
Based on the above analyses, the primary mechanism of cirrus cloud formation over the Tibetan Plateau results from the outflow of deep convection and cooling in the UT. Low OLR (< 200 W m−2) has been noted as an indicator of organised, deep convective activity in the troposphere (Fujiwara et al. Citation2009). The temporal variation of vertical velocity between 500 and 100 hPa from the vertical distribution of vertical velocity over Ali () was derived from the National Centers for Environmental Prediction final version re-analysis (NCEP FNL) data and the OLR calculated from the CDC OLR dataset over the Ali observation site. Strong convective activity over the site is clear during the time periods: August 3 to 12 and August 25 to 29. The results point to two stages that are consistent with the period when COLs were very close to the bottom of the cirrus clouds. Cirrus clouds in two stages can be reasonably generated via liquid origins. Anvil cirrus clouds of liquid origin outflow from deep convective activities that are generated at low altitudes. While those formed in situ are predominant other than these two time periods when deep convective activities are weak and there are cold perturbation conditions and the slow vertical velocities due to large-scale updrafts in the UT.
Fig. 5. The temporal variation of vertical velocity (cm s−1) from the NCEP FNL data (upper panel) and the OLR calculated from the CDC OLR dataset over the Ali observation site (lower panel). The symbols represent the occurrence of cirrus clouds on the corresponding dates. Colors distinguish the origin (red for liquid and blue for in situ).
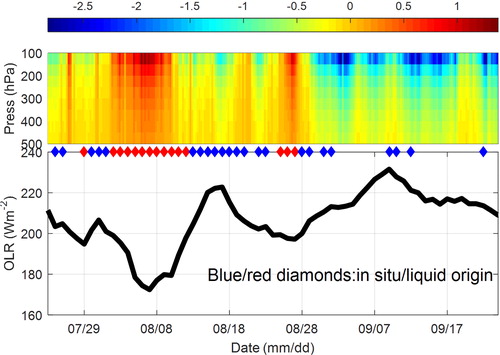
Thus, it is reasonable to consider OLR of less than 200 W m−2 as the threshold for liquid origins of cirrus clouds. Based on this classification definition, cirrus clouds originating in situ and by liquid origins from deep convective systems contribute approximately two thirds and one third to the total cirrus cloud occurrence on the UTLS over the Tibetan Plateau during the whole measurement period, respectively. For the ASM period, those originating in situ contribute approximately half to the total cirrus cloud occurrence. Using daily values from the Halogen Occultation Experiment (HALOE) aerosol extinction and CDC OLR data, Massie et al. (Citation2002) showed that half of the cirrus clouds in TTL over the maritime continent are convectively generated, while the other half are formed through in situ processes.
3.2. Optical properties of cirrus clouds
The relationship between the daily average optical parameters for COD and DPR from lidar retrieval according to different cirrus origins is shown in . The COD of cirrus clouds with a liquid origin is generally higher, exhibiting a mean COD of 0.31, compared to that of in situ origins, 0.23. Cirrus clouds with a liquid origin exhibited a maximum daily average COD of 0.41, which is ascribed to August 7 and a minimum of 0.18 on August 25. Using a microphysical box model with the validation of cirrus data sets from 17 aircraft campaigns, over Europe, Australia, Brazil as well as South and North America, Krämer et al. (Citation2016) concluded that liquid origin cirrus clouds are mostly thick with higher IWC and larger ice crystals than the in situ cirrus clouds.
Fig. 6. The relationship of the daily average optical parameters for Cloud Optical Depth (COD) and DePolarisation Ratio (DPR) from lidar retrieval according to different cirrus origins (blue: in-situ origin, red: liquid origin, see also ).
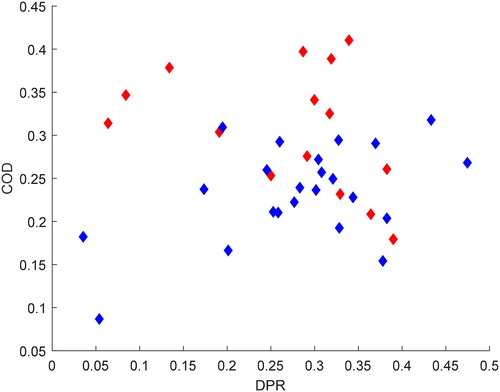
Unlike liquid-originated cirrus clouds, those generated in situ are characterised by a positive correlation between COD and DPR, indicating that larger and more complex nonspherical ice crystals are present, along with denser, in situ originated cirrus clouds.
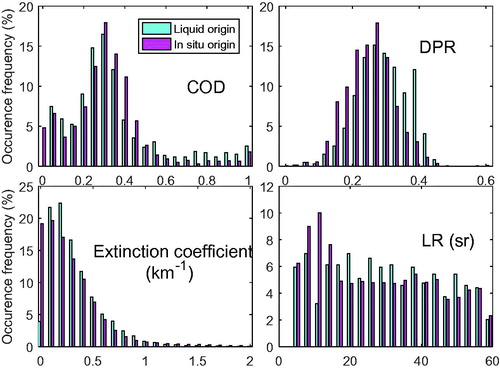
To further investigate the key features that distinguish liquid originated cirrus clouds from in situ originated cirrus, the occurrence frequencies of optical parameters for the two types were analysed (). Liquid origin cirrus clouds exhibit more extreme COD values, whereas those originating in situ can occur on most optically thin clouds with COD ∼0.3, indicating that dense cirrus predominantly form via liquid origins. The prevailing proportion of liquid-originated cirrus with extremely high extinction coefficients could also support this inference. Luebke et al. (Citation2016) adopted airborne in situ measurements over the European continent and also found that the key features that distinguish cirrus clouds with a liquid origin from those with an in situ origin are higher frequencies of high IWC (>100 ppmv), higher ice crystal number concentrations, and larger ice crystals, resulting in larger extinction coefficients and COD values. Additionally, Wolf et al. (Citation2018) analysed the balloon-borne in situ measurements of Arctic cirrus clouds and suggested that the number size distribution for liquid origin clouds was much broader with particle sizes between 10 and 1200 μm compared with that of in-situ origin clouds characterised by all smaller than 350 μm diameter. Therefore, more subvisible cirrus clouds could be associated with in situ origins. The frequency of DPR occurrences demonstrates that cirrus with an in situ origin are characterised by lower DPR (e.g., horizontally oriented ice crystals or thin plates of ice crystals). This observation indicates that the particles associated with anvil cirrus clouds will comprise larger and more complex nonspherical ice (e.g., hexagonal ice crystals) that contribute to significantly larger volume DPRs (Thampi et al., Citation2009). The DPR is high in cloud regions where the turbulence effect is high (Krishnakumar et al., Citation2014), implying the possibility of ordered crystal formation via turbulence in anvil cirrus clouds. Ordered crystals in clouds give rise to high DPRs, and crystal growth increases in regions with high turbulence. The LR of liquid origin cirrus shows a peak at around 20 sr, while that of in situ cirrus occurs at around 10 sr. The distributions of LR for different cirrus origin suggest that lower LR is predominant in in situ cirrus. In general, the liquid origin cirrus ice crystals are larger and have more complex shapes because they are formed at lower altitudes where much more water is available than at the altitude of in situ cirrus formation.
Fig. 7. Frequencies of occurrence of optical parameters in cirrus clouds with in-situ and liquid origins.
4. Summary and conclusions
During a field campaign in the framework of the Variation of Land-atmosphere Coupled Systems and its Global Climate Effect over the Tibetan Plateau project, a high-performance MPL was successfully deployed at a Tibetan Plateau experimental site. Measurements were continuously taken from July 25 to September 23, 2016, which spans the prevalence and degenerating period of the summer monsoon. Radiosondes were launched twice daily to observe temperatures, RH, and wind profiles. The temperature profiles, together with the lidar observations, were used to investigate cirrus cloud formation mechanisms. The cirrus clouds exhibited frequent occurrences, with sharp fluctuations in vertical distribution from 8 to 14 km in the ASM period. In contrast, they were remarkably reduced and consistently existed near 10 km in September when the ASM began subsiding. The relatively close correlation between cirrus occurrences and COLs in the troposphere indicates that one-third of the cirrus clouds observed at Ali were caused by deep convective activity. The origin and maintenance mechanisms of cirrus clouds were further investigated using lidar observations and temperature deviations that were calculated from average temperature profiles over three months. The results suggest that the cirrus connected to high convective updrafts are of liquid origin, while cold perturbations with slow updrafts are responsible for the formation and evolution of in situ cirrus clouds.
The anvil cirrus clouds with liquid origins are mostly characterised by optically thicker clouds with COD >∼ 0.2, higher DPR, and higher LR than those with an in situ origin. The particles associated with the anvil cirrus clouds will be larger and more complex nonspherical ice, resulting in a significant increase of LR.
The mechanisms that are proposed for cirrus cloud dynamics in this study are based on two months of data. Extended meteorological observations, and especially for water vapour and microphysical parameter measurements, such as particle size, are required obtaining a better understanding of the formation and variation of cirrus clouds over the Tibetan Plateau. These observations will ultimately help improve climate modeling of cirrus clouds.
Acknowledgments
We would like to thank the staff of the Tibetan Meteorological Service for assisting our experimental work. The authors gratefully acknowledge NOAA/OAR/ESRL PSD, Boulder, Colorado, USA, for providing the interpolated OLR data on their website http://www.cdc.noaa.gov/. We would like to thank LetPub (www.letpub.com) for providing linguistic assistance in the course of preparing this manuscript.
Additional information
Funding
References
- Boucher, O., Randall, D., Artaxo, P., Bretherton, C., Feingold, G. and co-authors. 2013. Clouds and aerosols. In: Climate Change 2013: The Physical Science Basis. Contribution of Working Group I to the Fifth Assessment Report of the Intergovernmental Panel on Climate Change (ed. by T.F. Stocker, D. Qin, G.-K. Plattner, M. Tignor, S.K. Allen, J. Boschung, A. Nauels, Y. Xia, V. Bex, P.M. Midgley) Cambridge University Press, Cambridge, UK.
- Chen, B. and Liu, X. 2005. Seasonal migration of cirrus clouds over the Asian Monsoon regions and the Tibetan Plateau measured from MODIS/Terra. Geophys. Res. Lett. 32, L01804.
- Chen, W., Chiang, C. and Nee, J. 2002. Lidar ratio and depolarization ratio for cirrus clouds. Appl. Opt. 41, 6470–6476. DOI: 10.1364/AO.41.006470
- Chen, Y., Kreidenweis, S. M., McInnes, L. M., Rogers, D. C. and DeMott, P. J. 1998. Single particle analyses of ice nucleating aerosols in the upper troposphere and lower stratosphere. Geophys. Res. Lett. 25, 1391–1394. DOI: 10.1029/97GL03261
- Clothiaux, E. E., Mace, G. G., Ackerman, T. P., Kane, T. J., Spinhirne, J. D. and co-authors. 1998. An automated algorithm for detection of hydrometeor returns in micropulse lidar data. J. Atmos. Ocean. Technol. 15, 1035–1042. DOI: 10.1175/1520-0426(1998)015<1035:AAAFDO>2.0.CO;2
- Comstock, J. M. and Sassen, K. 2001. Retrieval of cirrus cloud radiative and backscattering properties using combined lidar and infrared radiometer (LIRAD) measurements. J. Atmos. Ocean. Technol. 18, 1658–1673. DOI: 10.1175/1520-0426(2001)018<1658:ROCCRA>2.0.CO;2
- Comstock, J. M., Ackerman, T. P. and Mace, G. G. 2002. Ground-based lidar and radar remote sensing of tropical cirrus clouds at Nauru Island: Cloud statistics and radiative impacts. J. Geophys. Res. 107, 4714.
- Cziczo, D. J. and Froyd, K. D. 2014. Sampling the composition of cirrus ice residuals. Atmos. Res. 142, 15–31. DOI: 10.1016/j.atmosres.2013.06.012
- Cziczo, D. J., Froyd, K. D., Hoose, C., Jensen, E. J., Diao, M. and co-authors. 2013. Clarifying the dominant sources and mechanisms of cirrus cloud formation. Science 340, 1320–1324. DOI: 10.1126/science.1234145
- DeMott, P. J., Cziczo, D. J., Prenni, A. J., Murphy, D. M., Kreidenweis, S. M. and co-authors. 2003b. Measurements of the concentration and composition of nuclei for cirrus formation. Proc. Natl. Acad. Sci. USA 100, 14655–14660. DOI: 10.1073/pnas.2532677100
- DeMott, P. J., Kenneth, S., Poellot, M. R., Darrel, B., Rogers, D. C. and co-authors. 2003a. African dust aerosols as atmospheric ice nuclei. Geophys. Res. Lett. 30, 291–305.
- Fahey, D. W. and Schumann, U. 1999. Aviation-produced Aerosols and Cloudiness. In: Aviation and the Global Atmosphere (ed. J. E. Penner), Cambridge University Press, Cambridge, UK, 65–120.
- Frey, W., Borrmann, S., Kunkel, D., Weigel, R., de Reus, M. and co-authors. 2011. In-situ measurements of tropical cloud properties in the west african monsoon: upper tropospheric ice clouds, mesoscale convective system outflow, and subvisual cirrus. Atmos. Chem. Phys. 11(12), 5569–5590, DOI: 10.5194/acp-11-5569-2011
- Froyd, K. D., Murphy, D. M., Lawson, P., Baumgardner, D. and Herman, R. L. 2010. Aerosols that form subvisible cirrus at the tropical tropopause. Atmos. Chem. Phys. 10, 209–218. DOI: 10.5194/acp-10-209-2010
- Fu, Q. and Liou, K. N. 1993. Parameterization of the radiative properties of cirrus clouds. J. Atmos. Sci. 50, 2008–2025. DOI: 10.1175/1520-0469(1993)050<2008:POTRPO>2.0.CO;2
- Fu, Q., Baker, M. and Hartmann, D. L. 2002. Tropical cirrus and water vapor: An effective earth infrared iris feedback? Atmos. Chem. Phys 2, 1–7.
- Fu, R., Hu, Y., Wright, J. S., Jiang, J. H., Dickinson, R. E. and co-authors. 2006. Short circuit of water vapor and polluted air to the global stratosphere by convective transport over the Tibetan Plateau. Proc. Nat. Acad. Sci. USA 103, 5664–5669. DOI: 10.1073/pnas.0601584103
- Fujiwara, M., Iwasaki, S., Shimizu, A., Inai, Y., Shiotani, M. and co-authors. 2009. Cirrus observations in the tropical tropopause layer over the western Pacific. J. Geophys. Res. 114, D09304.
- Gallagher, M. W., Connolly, P. J., Crawford, I., Heymsfield, A., Bower, K. N. and co-authors. 2012. Observations and modelling of microphysical variability, aggregation and sedimentation in tropical anvil cirrus outflow regions. Atmos. Chem. Phys. 12, 6609–6628. DOI: 10.5194/acp-12-6609-2012
- Gao, B. C., Yang, P., Guo, G. and Park, S. K. 2003. Measurements of water vapor and high clouds over the Tibetan Plateau with the Terra MODIS instrument. IEEE Trans. Geosci. Remote Sens. 41, 895–900.
- He, Q. S., Li, C. C., Ma, J. Z., Wang, H. Q., Shi, G. M. and co-authors. 2013. The properties and formation of cirrus clouds over the Tibetan Plateau based on summertime lidar measurements. J. Atmos. Sci. 70, 901–915. 2013. DOI: 10.1175/JAS-D-12-0171.1
- Jensen, E. and Toon, O. 1994. Ice nucleation in the upper troposphere: Sensitivity to aerosol number density, temperature, and cooling rate. Geophys. Res. Lett. 21, 2019–2022. DOI: 10.1029/94GL01287
- Jin, M. L. 2006. MODIS observed seasonal and interannual variations of atmospheric conditions associated with hydrological cycle over Tibetan Plateau. Geophys. Res. Lett. 33, L19707. DOI: 10.1029/2006GL026713
- Kar, J., Bremer, H., Drummond, J. R., Rochon, Y. J., Jones, D. B. A. and co-authors. 2004. Evidence of vertical transport of carbon monoxide from Measurements of Pollution in the Troposphere (MOPITT). Geophys. Res. Lett. 31, 203–218.
- Kienast-Sjögren, E., Rolf, C., Seifert, P., Krieger, U. K., Luo, B. P. and co-authors. 2016. Climatological and radiative properties of midlatitude cirrus clouds derived by automatic evaluation of lidar measurements. Atmos. Chem. Phys. 16, 7605–7621. DOI: 10.5194/acp-16-7605-2016
- Kim, J. E. and Alexander, M. J. 2015. Direct impacts of waves on tropical cold point tropopause temperature. Geophys. Res. Lett. 42, 1584–1592. DOI: 10.1002/2014GL062737
- Kim, J.-E., Alexander, M. J., Bui, T. P., Dean-Day, J. M., Lawson, R. P. and co-authors. 2016. Ubiquitous influence of waves on tropical high cirrus clouds. Geophys. Res. Lett. 43, 5895–5901. DOI: 10.1002/2016GL069293
- Krämer, M., Rolf, C., Luebke, A., Afchine, A., Spelten, N. and co-authors. 2016. A microphysics guide to cirrus clouds – Part 1: Cirrus types. Atmos. Chem. Phys. 16, 3463–3483. DOI: 10.5194/acp-16-3463-2016
- Krishnakumar, V., Satyanarayana, M., Radhakrishnan, S. R., Dhaman, R. K., Jayeshlal, G. S. and co-authors. 2014. Lidar investigations on the optical and dynamical properties of cirrus clouds in the upper troposphere and lower stratosphere regions at a tropical station, Gadanki, India (13.5°N, 79.2°E). J. Appl. Remote Sens. 8, 083659. DOI: 10.1117/1.JRS.8.083659
- Li, Q., Jiang, J. H., Wu, D. L., Read, W. G., Livesey, N. J. and co-authors. 2005. Convective outflow of South Asian pollution: A global CTM simulation compared with EOS MLS observations. Geophys. Res. Lett. 32, 337–349.
- Liebmann, B. and Smith, C. A. 1996. Description of a complete (interpolated) outgoing longwave radiation dataset. Bull. Amer. Meteor. Soc. 77, 1275–1277.
- Liou, K. N. 1986. Influence of cirrus clouds on weather and climate processes: A global perspective. Mon. Weather Rev. 114, 1167–1199. DOI: 10.1175/1520-0493(1986)114<1167:IOCCOW>2.0.CO;2
- Liu, C. and Zipser, E. J. 2005. Global distribution of convection penetrating the tropical tropopause. J. Geophys. Res. 110, D23104. DOI: 10.1029/2005JD006063
- Luebke, A. E., Afchine, A., Costa, A., Grooß, J.-U., Meyer, J. and co-authors. 2016. The origin of midlatitude ice clouds and the resulting influence on their microphysical properties. Atmos. Chem. Phys. 16, 5793–5809. DOI: 10.5194/acp-16-5793-2016
- Lynch, D. K., Sassen, K., Starr, D. C. and Stephens, G. 2002. Cirrus. Oxford University Press, New York.
- Martinsson, B. G., Friberg, J., Andersson, S. M., Weigelt, A., Hermann, M. and co-authors. 2014. Comparison between CARIBIC aerosol samples analyzed by accelerator-based methods and optical particle counter measurements. Atmos. Meas. Tech. 7, 2581–2596, DOI: 10.5194/amt-7-2581-2014
- Massie, S. A., Gettelman, W. R. and Baumgardner, D. 2002. Distribution of tropical cirrus in relation to convection. J. Geophys. Res. 107, 4591.
- McFarquhar, G. M., Heymsfield, A. J., Spinhirne, J. and Hart, B. 2000. Thin and subvisual tropopause tropical cirrus: Observations and radiative impact. J. Atmos. Sci. 57, 1841–1853. DOI: 10.1175/1520-0469(2000)057<1841:TASTTC>2.0.CO;2
- Noel, V., Winker, D. M., Garrett, T. J. and McGill, M. 2007. Extinction coefficients retrieved in deep tropical ice clouds from lidar observations using a CALIPSO-like algorithm compared to in-situ measurements from the cloud integrating nephelometer during CRYSTAL-FACE. Atmos. Chem. Phys. 7, 1415–1422. DOI: 10.5194/acp-7-1415-2007
- Pan, L. L. and Munchak, L. A. 2011. Relationship of cloud top to the tropopause and jet structure from CALIPSO data. J. Geophys. Res. 116, D12201. DOI: 10.1029/2010JD015462
- Pandit, A. K., Gadhavi, H., Ratnam, M. V., Jayaraman, A., Raghunath, K. and co-authors. 2014. Characteristics of cirrus clouds and tropical tropopause layer: Seasonal variation and long-term trends. J. Atmos. Solar-Terrestrial Phys. 121, 248–256. DOI: 10.1016/j.jastp.2014.07.008
- Park, M., Emmons, L. K., Bernath, P. F., Walker, K. A. and Boone, C. D. 2008. Chemical isolation in the Asian monsoon anticyclone observed in Atmospheric Chemistry Experiment (ACE-FTS) data. Atmos. Chem. Phys. 8, 757–764. DOI: 10.5194/acp-8-757-2008
- Park, M., Randel, W. J., Emmons, L. K. and Livesey, N. J. 2009. Transport pathways of carbon monoxide in the Asian summer monsoon diagnosed from model of ozone and related tracers (MOZART). J. Geophys. Res. 114, D08303.
- Park, M., Randel, W. J., Gettelman, A., Massie, S. T. and Jiang, J. H. 2007. Transport above the Asian summer monsoon anticyclone inferred from Aura Microwave Limb Sounder tracers. J. Geophys. Res. 112, 355–362.
- Park, M., Randel, W. J., Kinnison, D. E., Garcia, R. R. and Choi, W. 2004. Seasonal variation of methane, water vapor, and nitrogen oxides near the tropopause: Satellite observations and model simulations. J. Geophys. Res. 109, D03302.
- Randel, W. J. and Jensen, E. J. 2013. Physical processes in the tropical tropopause layer and their roles in a changing climate. Nat. Geosci. 6, 169–176. DOI: 10.1038/ngeo1733
- Randel, W. J. and Park, M. 2006. Deep convective influence on the Asian summer monsoon anticyclone and associated tracer variability observed with Atmospheric Infrared Sounder (AIRS). J. Geophys. Res. 111, 2503–2511.
- Randel, W. J., Park, M., Emmons, L., Kinnison, D., Bernath, P. and co-authors. 2010. Asian monsoon transport of pollution to the stratosphere. Science 328, 611–633. DOI: 10.1126/science.1182274
- Richardson, M. S., Demott, P. J., Kreidenweis, S. M., Cziczo, D. J. and Dunlea, E. J. 2007. Measurements of heterogeneous ice nuclei in the western United States in springtime and their relation to aerosol characteristics. J. Geophys. Res. 112, 575–586.
- Rogers, D. C., DeMott, P. J., Kreidenweis, S. M. and Chen, Y. 1998. Measurements of ice nucleating aerosols during SUCCESS. Geophys. Res. Lett. 25, 1383–1386. DOI: 10.1029/97GL03478
- Schnaiter, M., Järvinen, E., Vochezer, P., Abdelmonem, A., Wagner, R. and co-authors. 2016. Cloud chamber experiments on the origin of ice crystal complexity in cirrus clouds. Atmos. Chem. Phys. 16, 5091–5110. DOI: 10.5194/acp-16-5091-2016
- Seifert, P., Ansmann, A., Muâller, D., Wandinger, U., Althausen, D. and co-authors. 2007. Cirrus optical properties observed with lidar, radiosonde and satellite over the tropical Indian Ocean during the aerosol-polluted northeast and clean maritime southwest monsoon. J. Geophys. Res. 112, D17205. DOI: 10.1029/2006JD008352
- Stephens, G. L. and Webster, P. J. 1981. Clouds and climate: Sensitivity of simple systems. J. Atmos. Sci. 38, 235–247. DOI: 10.1175/1520-0469(1981)038<0235:CACSOS>2.0.CO;2
- Sunilkumar, S. V. and Parameswaran, K. 2005. Temperature dependence of tropical cirrus properties and radiative effects. J. Geophys. Res. 110, D13205. DOI: 10.1029/2004JD005426
- Thampi, B. V., Sunilkumar, S. V. and Parameswaran, K. 2009. Lidar studies of particulates in the UTLS region at a tropical station over the Indian subcontinent. J. Geophys. Res. 114, D08207.
- Thomason, L. W. and Vernier, J. P. 2013. Improved SAGE II cloud/aerosol categorization and observations of the Asian tropopause aerosol layer: 1989-2005. Atmos. Chem. Phys. 13, 4605–4616. DOI: 10.5194/acp-13-4605-2013
- Tobo, Y., Zhang, D. Z., Iwasaka, Y. and Shi, G. Y. 2007. On the mixture of aerosols and ice clouds over the Tibetan Plateau: Results of a balloon flight in the summer of 1999. Geophys. Res. Lett. 34, L23801.
- Vernier, J. P., Thomason, L. W. and Kar, J. 2011. CALIPSO detection of an Asian tropopause aerosol layer. Geophys. Res. Lett. 38, 1451–1453.
- Vernier, J. P., Fairlie, T. D., Natarajan, M., Wienhold, F. G., Bian, J. and co-authors. 2015. Increase in upper tropospheric and lower stratospheric aerosol levels and its potential connection with Asian pollution. J. Geophys. Res. Atmos. 120, 1608–1619, DOI: 10.1002/2014JD022372
- Wang, X., Boselli, A., D’Avino, L., Velotta, R., Spinelli, N. and co-authors. 2005. An algorithm to determine cirrus properties from analysis of multiple-scattering influence on lidar signals. Appl. Phys. B 80, 609–615. DOI: 10.1007/s00340-005-1765-x
- Wernli, H., Boettcher, M., Joos, H., Miltenberger, A. K. and Spichtinger, P. 2016. A trajectory-based classification of ERA-Interim ice clouds in the region of the North Atlantic storm track. Geophys. Res. Lett. 43, 6657–6664. DOI: 10.1002/2016GL068922
- Winker, D. M., Vaughan, M. A., Omar, A., Hu, Y., Powell, K. A. and co-authors. 2009. Overview of the CALIPSO mission and CALIOP data processing algorithms. J. Atmos. Ocean. Technol. 26, 2310–2323. DOI: 10.1175/2009JTECHA1281.1
- WMO 1957. Meteorology – A three-dimensional science. WMO Bull. 6, 134–138.,
- Wolf, V., Kuhn, T., Milz, M., Voelger, P., Krämer, M. and co-authors. 2018. Arctic ice clouds over northern Sweden: microphysical properties studied with the Balloon-borne Ice Cloud particle Imager B-ICI. Atmos. Chem. Phys. 18(23), 17371–17386.
- Xiong, X., Houweling, S., Wei, J., Maddy, E., Sun, F. and co-authors. 2009. Methane plume over south Asia during the monsoon season: satellite observation and model simulation. Atmos. Chem. Phys. 9, 783–794. DOI: 10.5194/acp-9-783-2009
- Zerefos, C. S., Eleftheratos, K., Balis, D. S., Zanis, P., Tselioudis, G. and co-authors. 2003. Evidence of impact of aviation on cirrus cloud formation. Atmos. Chem. Phys. 3, 1633–1644. DOI: 10.5194/acp-3-1633-2003
- Zhang, Y., Macke, A. and Albers, F. 1999. Effect of crystal size spectrum and crystal shape on stratiform cirrus radiative forcing. Atmos. Res. 52, 59–75. DOI: 10.1016/S0169-8095(99)00026-5