
 ?Mathematical formulae have been encoded as MathML and are displayed in this HTML version using MathJax in order to improve their display. Uncheck the box to turn MathJax off. This feature requires Javascript. Click on a formula to zoom.
Abstract
A heavy pollution episode (HPE) that lasted for seven days occurred over the North China Plain in December 2016. An in situ Ambient Ion Monitor was applied to analyze the chemical composition of PM2.5 (fine particulate matter with diameters less than 2.5 µm) and gaseous HONO concentration during that event. A representative explosive growth in the pollution cumulative stage was selected to investigate the pollution mechanism during the HPE in Beijing. PM2.5 cumulative explosive growth processes were observed to occur commonly under high relative humidity (RH) condition. Our results demonstrated that the aqueous-phase oxidation of SO2 by NO2 to sulfate could contribute to the cumulative explosive growth. Nitrate produced by secondary formation was another factor in the growth of PM2.5. Depending on the relative humidity, temperature, and chemical species, the deliquescence relative humidity was calculated to 82%, 81%, and 83% for (NH4)2SO4, NH4NO3, and NH4Cl, respectively. The preexisting PM2.5 surface changed from solid to liquid when RH > 81%. Coincidentally, both the sulfur oxidation ratio (SOR) and reaction product HONO displayed an evident exponential relationship with RH and increased more quickly when RH was larger than 80%. In addition, sufficiently excessive NO2 made the aqueous-phase oxidation of SO2 efficiently proceed even at relative low SO2 concentrations (below 15 µg m−3). Potential H+ in the reactions was neutralized by NH3, resulting in fully neutralized PM2.5 during HPE. The chemical evolution of these reactions was discussed in detail in this study.
1. Introduction
With the rapid economic growth and urbanization, frequent haze pollution associated with high levels of aerosol loading has become a severe environmental problem in China (Huang et al., Citation2014a; Zhang et al., Citation2015b). Atmospheric aerosol particles, particularly fine PM2.5 have drawn extensive attention because of their profoundly adverse effect on human health, visibility, ecosystem, weather, and climate (Zhang et al., Citation2015b). These small-size particles can deeply penetrate into human lungs and increase the risk of respiratory diseases and mortality (Tie et al., Citation2009; Chen et al., 2016). In the atmosphere, aerosol particles can be transported over thousands of kilometers and have relatively long atmospheric residence time. During their stay in the atmosphere, they can alter the Earth’s radiative balance and perturb the temperature structure of the atmosphere by directly scattering or absorbing sunlight (Wang et al., Citation2015; Zhang et al., Citation2015a). In addition, aerosol particles can act as cloud condensation nuclei (CCN) or ice nuclei to change in cloud microphysical and optical properties (Che et al., 2016). In recent years, several studies have been performed to explore the physicochemical properties of fine particles, such as the chemical composition, particle size distribution, and hygroscopicity (Jimenez et al., Citation2009; Ehn et al., 2014; Huang et al., Citation2014a; Zhang et al., Citation2014, Citation2015a, Citation2015b, 2015c). However, it remains insufficient to find the source and formation mechanism of PM2.5 issues, particularly the cause of explosive growth within a few hours, which makes it difficult for the government to formulate effective strategies to reduce haze pollution.
Water-soluble inorganic ions (including sulfate, nitrate, ammonium, chloride, and so on) are found to be the dominant constituents in PM2.5, which generally accounts for approximately half of the total PM2.5 mass in the urban atmosphere (Du et al., 2011; Yang et al., Citation2011; Hu et al., 2014; Zhang et al., Citation2015b). They are thought to play an important role in the environment and climate change (Du et al., 2011; Zhang et al., Citation2011). For example, sulfate is one of the most effective radiative-cooling aerosols in the atmosphere (Huang et al., 2014c). Previous research suggests that sulfate in aerosols is usually produced by the homogeneous gas-phase oxidation of SO2 with subsequent gas-to-particle conversion and multiphase reactions of SO2 on the liquid/solid surface (Pöschl and Shiraiwa, Citation2015). In contrast, nitrate is mainly formed by the reactions of gaseous HNO3 or the heterogeneous hydrolysis of N2O5 on aerosol surfaces. Ammonium is chemically associated with sulfate and nitrate. Other field studies during haze days in China proposed that the massive amounts of sulfate and nitrate were more likely generated via heterogeneous chemistry than gas-phase and aqueous-phase chemistry. Until now, few studies have comprehensively evaluated the formation of water-soluble inorganic ions. Field observation of water-soluble inorganic ions in particles can serve as a good indicator for the surface chemical reactions of particles. Therefore, an understanding of the particle formation, growth and evolution processes in haze days is valuable.
A persistent severe pollution episode occurred in North China Plain during 15–22 December 2016. Beijing and neighboring Tianjin Municipality and Hebei Province suffered heavy air pollution, which also affected Shandong and Henan provinces. Because the area of heavy air pollution was large and the duration was long, Beijing municipal was forced to adopt an emergency response program and issue a red alert for smog-haze at 12:00 am on December 16. Despite many efforts, such as temporary factories close and vehicle restrictions, the air pollution still lasted for 7 days because of the complex pollution mechanisms and influence factors.
To better understand the mechanism and evolution of the pollution formation processes, major water-soluble inorganic ions in PM2.5 were continuously measured in 1-h resolution in Beijing. This study conducts a detailed analysis of this heavy pollution episode. The diurnal pattern of the chemical behavior, neutralization status of PM2.5 and evolution process of secondary pollutants are discussed in detail. The results will be helpful for the public to understand the haze formation mechanism and the government to make relevant control policies.
2. Experimental
2.1. Experimental methods
A real-time Ambient Ion Monitor (AIM, model URG-9000D, USA) was applied to continuously online measure the mass concentrations of major water-soluble inorganic ions (NH4+, K+, Ca2+, Mg2+, SO42–, NO3–, and Cl–) in PM2.5 and gaseous HONO with one-hour time resolution. AIM has been used to study the variations of water-soluble inorganic ions in particles and gases such as SO2, HONO, and HNO3 (Du et al., Citation2011; Pathak et al., Citation2011; Hu et al., Citation2014; Leng et al., Citation2015). The system is composed of a particle collection unit (URG) and ion chromatography system (IC, model ICS 1000, Dionex, USA) for chemical analyses. More detailed information about the AIM was previously elaborated (Wu and Wang, Citation2007; Hu et al., Citation2014). Ambient air was drawn into the particle collection unit at a flow rate of 3 L min−1 through a PM2.5 sharp-cut cyclone by a pump. Air was first penetrated through a parallel plate diffusion denuder, where solution was continuously run around the denuder to capture gases such as SO2 and HONO. Then, particles that were smaller than 2.5 μm in the air were continuously collected by a Steam-Jet Aerosol Collector (SJAC), which included a supersaturation chamber, a deionized water syringe pump and a sample collection syringe pump. To achieve high particle collection efficiencies, the particle-laden air stream was introduced into the aerosol supersaturation chamber to enhance the particle growth. Then, the “grown” particle steam condensed into water droplets when they passed by a spiral condenser at the end of the supersaturation chamber. The water droplets were filtered by an inertial particle separator and injected into the ion chromatographs for analysis.
2.2. Measurement sites
The observation site is located on the campus of the China Meteorological Administration (CMA) within the northwestern 3rd ring road of Beijing. This site is believed to be representative of a typical urban environment in Beijing because of the mixed effect of residential and traffic emissions. The real-time Ambient Ion Monitor in this study was installed on the roof of a laboratory building (39°56′N, 116°24′E, approximately 35 m height above the ground) without obvious obstacles nearby.
The concentration data of PM2.5 and trace gases (SO2, O3, and NO2) in this study were obtained from Guanyuan monitoring station dataset on the website of Beijing Municipal Environment Protection Bureau (http://www.bjepb.gov.cn). The PM2.5 data from Beijing Municipal Environment Protection Bureau were collected by Quartz crystal microbalance (Thermofisher Scientific Co., USA). To avoid some potential errors and inaccuracies, all measurement conditions and procedure refer to the environmental protection standard named “Specifications and Test Procedures for Ambient Air Quality Continuous Automated Monitoring System for PM10 and PM2.5 (No. HJ 653-2013)” published by Ministry of Ecological and Environment of the People’s Republic of China in 2013. Guanyuan monitoring station (No. 99011) was the nearest observation station (approximately 2 km away from our observation site). To a certain extent, it is reasonable to use PM2.5 and trace gas data in Guanyuan station for analysis in this study. The meteorology data (temperature, relative humidity, wind speed, and wind direction) in this study were obtained from Haidian Meteorological Observing Station (No. 54399), which locates on Xiyuan playground in Haidian Park, Beijing, China.
All data in this study are reported in 1-h resolution in Beijing time (BJT: UTC + 8 h).
2.3. Data quality assurance
Before the AIM instrument was applied in our field observation, the accuracy of online measured water-soluble inorganic ions data from our AIM instrument was considered firstly. AIM on-line measurements and tradition filter off-line sampling by Minivol air sampler were carried out simultaneously on the roof of Chinese Academy of Meteorological Sciences. The accuracy of ions concentrations from AIM was evaluated by comparing the results from these two instruments. Scattering plots of sulfate, nitrate, ammonium, and potassium between AIM and filter measurements were shown in Supplementary Fig. S1. The linear correlation coefficients (R2) of the linear fitting between AIM data and the filter sampling ones were 0.89 for sulfate, 0.97 for nitrate, 0.95 for ammonium and 0.88 for potassium, respectively. Good linear correlation coefficients (R2) indicated that there was a strong correlation between AIM data and the filter sampling ones. Since potassium was chemical stable during sampling, it was taken as a typical ion for assessing the accuracy of AIM. As shown in Supplementary Fig. S1, the slop of AIM data against the filter for potassium was 0.95 ± 0.11. The good results of regression analysis could certify the accuracy and collection efficiency of ions concentrations measured by AIM. For sulfate, nitrate, and ammonium, their slop was 0.66 ± 0.07, 0.73 ± 0.04, and 0.64 ± 0.05, respectively. It implied that the concentrations of sulfate, nitrate, and ammonium from filter sampling were higher than AIM measurements ones. Many factors may contribute to the differences concentrations of these ions between the AIM and filter measurements (Wu and Wang, Citation2007; Hu et al., 2014). For example, the absorption of trace gases (such as SO2, NO2, NH3, and HNO3) on filters and the subsequent heterogeneous reactions with particles during filter sampling for 24 h could result in overestimating the concentrations of nitrate, sulfate, and ammonium (Zhou et al., Citation2009).
As for HONO concentration, it was calibrated based on data from one HONO analyzer. The HONO analyzer was home-made by of Institute of Chemistry, Chinese Academy of Sciences, China. It has been used to observe the concentration of HONO in Beijing for several times (Tong et al., Citation2015, Citation2016; Hou et al., Citation2016; Zhang et al., Citation2019). The accuracy and stability of HONO concentrations measured by HONO analyzer have also been certified by a long-path absorption photometer (Quma, Model LOPAP-03). Scattering plot of HONO concentration between AIM and HONO analyzer is displayed in Supplementary Fig. S2. The lower HONO concentrations by AIM were suspected to be due to the low HONO collection efficiency of the denuder system. All HONO concentrations in this study were calculated according to the linear relationship in Supplementary Fig. S2.
3. Results and discussion
3.1. General information about heavy pollution episode in Beijing from 15 to 22 December 2016
3.1.1. Temporal variations of the PM2.5 mass concentration
From December 15th to 22nd 2016, the region of BTH (Beijing-Tianjin-Hebei) experienced severe air pollution for seven days. The average hourly PM2.5 concentrations in Beijing exceeded 225 µg/m3, which was three times of the PM2.5 Level II value (75 µg/m3) of the National Air Quality Standard of China and nine times of the World Health Organization Standard (25 µg/m3). shows the time series of the mass concentration of PM2.5 in Beijing on 15–23 December 2016. The PM2.5 daily mean mass concentration (displays as dash line) had a 6-day consecutive increase from 51.5 µg/m3 on December 15 to 382.8 µg/m3 on December 21. According to the PM2.5 daily mean mass concentration thresholds in the National Air Quality Standard of China, a period with the PM2.5 mass concentration below 35 µg/m3 is identified as a clean period. An aerosol pollution episode is defined as a period during which the PM2.5 mass concentration exceeds 80 µg/m3 for three successive days between two clean periods. For the level of pollution episodes, it is specified that pollution episodes with peak values of PM2.5 more than 400 µg/m3 are called heavy pollution episodes (HPEs), whereas those with peak PM2.5 values less than 300 µg/m3 are called light pollution episodes (LPEs). Therefore, the pollution episode from 15 to 22 December 2016 in Beijing with the PM2.5 daily mass concentration exceeding 80 µg/m3 for six successive days, and a peak PM2.5 value at 524 µg/m3 was considered a heavy pollution episode (HPE) here.
Fig. 1. Time series of the PM2.5 mass concentration in Beijing on 15–23 December 2016. The green, red, and blue lines correspond to the PM2.5 data in the pollution transport stage (TS), pollution cumulative stage (CS) and clean stage (Clean), respectively. The dashed line corresponds to the daily mean PM2.5 mass concentration (calculated from 8:00 am to 7:00 am in the following day). The data in the gray boxes were selected to represent the explosive growth (REG) processes.
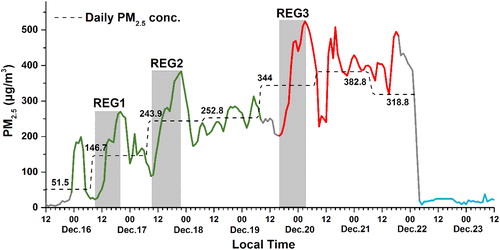
According to the observations of urban PM2.5 mass concentration, ground meteorological data, vertical measurements of winds, temperature, and relative humidity (RH), and ECMWF reanalysis data, the whole process of red-alert HPE on 15–22 December 2016 in Beijing was divided into two stages: the pollution transport stage (TS) and the cumulative stage (CS) in our previous study (Zhong et al., Citation2017). Since the identity and characteristics of these two stages were described previously in details, the temporal variations in PM2.5 and these two stages were presented directly here (as shown in ). Time series for vertical distributions of meteorological factors from 15 to 23 December 2016 in Beijing were also displayed in Supplementary Fig. S3. Generally, the pollution transport stage (TS) was identified as the wind shift from north to south in the BL. Besides, the air temperature decreases with height, and moisture increases compared with clean periods. CS was characterized by a temperature anomalous inversion with low winds and high RH in the lower BL. The temperature anomalous inversion behaved as air temperature increased with height. For better comparison, the period (blue line in ) during which the PM2.5 mass concentration less than 35 µg/m3 lasted for more than 24 hours was selected as the clean stage (Clean). The average mass concentrations of PM2.5 in these three stages were calculated and are listed in . The values in Clean, TS, and CS were 19.1, 206.1, and 392.5 µg/m3, respectively. The average PM2.5 mass concentrations in the TS and CS were much larger than that in Clean (10.8 and 20.5 times, respectively). In addition, the value in CS was the largest: approximately 1.9 times larger than that in the TS.
Table 1. Average mass concentration (µg m−3) of PM2.5, major water-soluble ions, and trace gases during the pollution transport stage (TS), pollution cumulative stage (CS), and clean stage (Clean).
The explosive growth of the PM2.5 mass concentration occurred in both TS and CS. As shown in the gray boxes in , three representative explosive growths (REG) were selected during the HPE. Their typical feature was that the PM2.5 mass concentration linearly and rapidly increased within a few hours (12–14 hours). As listed in , all linear correlations are good (R2>0.9). During TS, REG 1 increased from 34 µg/m3 to 320 µg/m3 at a rate of 29.3 µg/m3 per hour, whereas REG 2 increased from 88 µg/m3 to 384 µg/m3 at a rate of 23.4 µg/m3 per hour. They were primarily caused by the southerly pollutant transport and defined as the original/transport explosive growth processes (Zhong et al., Citation2017). Details have been described in our previous study and are not shown here (Zhong et al., Citation2017). In contrast, REG 3 in the CS, which is defined as the cumulative explosive growth process, increased from 202 µg/m3 to 524 µg/m3 at a faster rate of 32.5 µg.m−3.h−1. The strong static stability, which traps pollution-laden air beneath it, facilitates pollutant accumulation (Zhong et al., Citation2017). The chemical evolution and mechanism during the cumulative explosive growth process will be obtained in details in Section 3.2.
Table 2. Duration and increase rate of the PM2.5 mass concentration in REG1, REG2, and REG3.
3.1.2. Major water-soluble inorganic ions in PM2.5
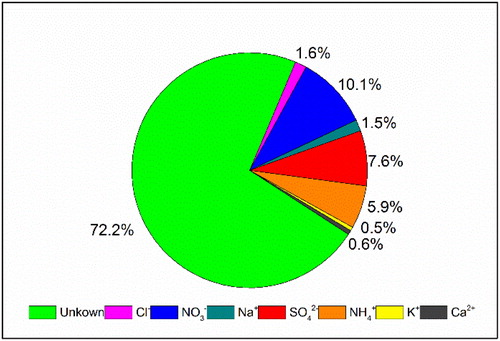
Water-soluble inorganic ions including SO42–, NO3–, NH4+, Na+, K+, Ca2+, Mg2+, and Cl– were in situ measured in this study. The average mass concentration of the total water-soluble ions was 69 µg m−3, which accounted for approximately 28% of PM2.5 () during the HPE on 15–22 December 2016 in Beijing. Apparently, sulfate (SO42–), nitrate (NO3–), and ammonium (NH4+) (simplified as SNA) were the three most abundant water-soluble ions in PM2.5; their mean mass fractions were 10.1%, 7.6%, and 5.9%, respectively. The average concentrations of NO3–, SO42–, NH4+ were 24.9, 18.8, and 14.7 µg m−3, respectively. For the other five ions, the mean mass concentration was 0.1–3.9 μg m−3.
Fig. 2. Mass fractions of water-soluble inorganic ions in PM2.5 during HPE on 15–22 December 2016 in Beijing.
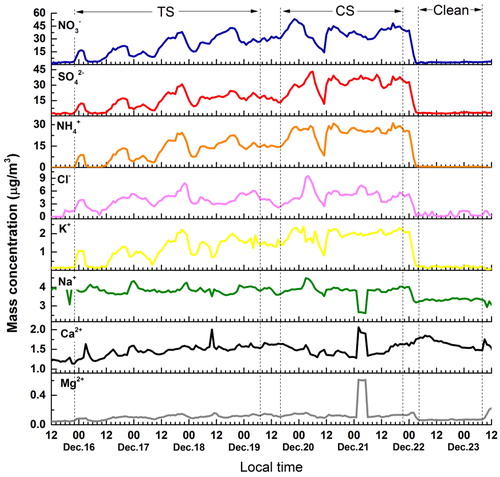
shows the time series of measured water-soluble inorganic ions in PM2.5. Ca2+ and Mg2+, which are the representative crustal elements, mainly originate from rock weathering, re-suspended road dust and construction dust (Wang et al., Citation2006; Yang et al., Citation2015). As shown in Supplementary Fig. S4, most surface wind speeds during the entire HPE were less than 1.5 m/s. The surface wind speed was so weak that the atmosphere was nearly under stagnate condition. And the mass concentrations of Ca2+ and Mg2+ remained almost s). For NO3–, SO42–, NH4+, K+, and Cl–, most of their mass concentration exhibited apparent temporal variations during the HPE. After four wavelike growths in the TS and an explosive growth, they maximized in the CS. The peak mass concentrations of NO3–, SO42–, NH4+, K+, and Cl– were 53.3, 43.1, 31.1, 2.4, and 9.5 µg m−3, respectively. The ranking of the mass concentrations was NO3– > SO42– > NH4+ > Cl– >K+ during the HPE, except the values of SO42– in the PM2.5 at 4:00 am ∼ 6:00 am on December 20 and 2:00 am ∼ 10:00 am on December 21 were greater than that of NO3–. All of these five ions displayed a sharp decrease when the Clean stage began. The mean mass concentration of these five ions in PM2.5 during the three stages (TS, CS, and Clean) were listed in . Compared to the value in the Clean stage, the mean mass concentrations of NO3–, SO42–, NH4+, Cl–, K+ in the TS increased by 7.8, 4.9, 28.7, 7.1, and 6.4 times, respectively. The average mass concentrations of NO3–, SO42–, NH4+, Cl–, K+ in the CS were larger than those in the TS by 1.7, 2.2, 2.1, 1.3, and 1.7 times, respectively.
Fig. 3. Temporal variations of major water-soluble inorganic ions in PM2.5.
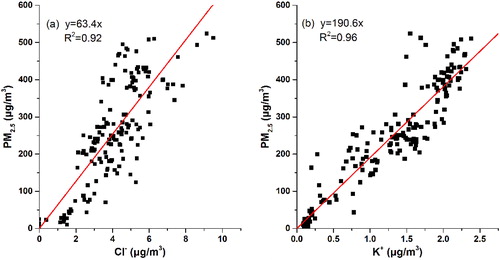
Cl− and K+ are suggested to mainly emit from fuel and biomass combustion (Duan et al., Citation2004; Du et al., 2011; Chen and Xie, Citation2014; Yang et al., Citation2015). They are usually considered the primary sources in the atmosphere. Cl− and K+ showed cumulative growth during the HPE. As presented in , both Cl− and K+ have a notably good correlation with PM2.5. The linear correlation coefficients are 0.92 and 0.96 for Cl− and K+, respectively. Thus, a large quantity of fuel combustion and biomass burning occurred and contributed to the air pollution in the red-alert HPE on 15–22 December 2016 in Beijing.
Fig. 4. Correlation between PM2.5 and (a) Cl–, (b) K+ during the HPE on 15–22 December 2016 in Beijing.
3.1.3. Mass concentration of the major trace gases
SO42–, NO3–, and NH4+ (SNA) are well-known secondary pollutants in the atmosphere. The formation of SNA is closely related to their respective gaseous precursors: sulfur dioxide (SO2), nitrogen oxides (NOx = NO + NO2), and ammonia (NH3). SO2 is generally emitted into the atmosphere by the combustion of fossil fuels, which contains sulfur (in particular, coal and heavy fuel oil). As far as we know, Beijing issued a red alert for smog-haze at 12:00 am on December 16, from which local coal burning and heavy fuel oil were largely limited. shows the temporal variations of SO2, O3, and NO2, and HONO during the observation period. Their average concentrations in the TS, CS, and Clean stage are summarized in . shows that the SO2 concentration increased, and the hourly maximum SO2 mass concentration reached 62.7 µg m−3 in the TS. Interestingly, when the southern wind decreased and the meteorological conditions became static in the CS, the mass concentration of SO2 began to decline to 3 µg m−3. The SO2 mean concentration in the CS was only 40% of the value in the TS, which implied that SO2 was not locally emitted but mainly transported from distant locations. O3 is a primary oxidant when SO2 is converted to sulfate. However, the O3 concentration in was notably low (nearly zero) because of the weak solar radiation in the TS and CS. Thus, it is reasonable to infer that the SO2 oxidation by O3 via gas-phase, heterogeneous, or multiphase processes and gas-phase oxidation of SO2 by OH radicals produced from O3 should be negligible during HPE on 15–22 December 2016 in Beijing.
Fig. 5. Temporal variations of the mass concentrations of gaseous SO2, O3, NO2, and HONO during the observation period.
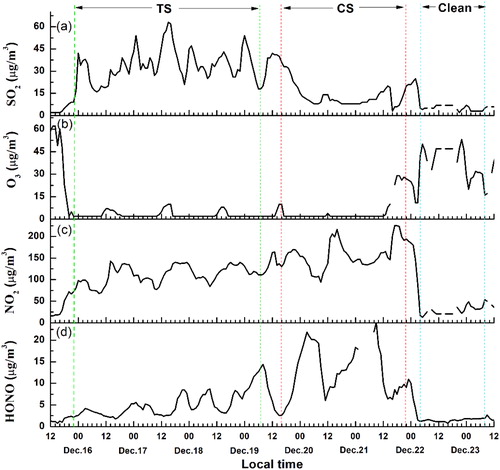
The NO2 mass concentration shows a cumulative growth trend in . The average mass concentration of NO2 in the TS was 111.6 µg m−3. Contrary to the SO2 trend, NO2 continued to grow in the CS and reached 228 µg m−3 in the late CS. The mean NO2 mass concentration in the CS was 155.3 µg m−3, which exceeds the national II standard (daily mean 120 µg m−3). In addition to external transportation, the local traffic is considered another main emission source of NO2. Although the odd-even day vehicle prohibition was announced during the red-alarm HPE, the total traffic number remained large. Therefore, the NO2 mass concentration could continue growing when the external transport decreased in the CS.
As shown in , the HONO mass concentration in the Clean stage was notably low (0.7 ∼ 2.8 µg m−3). However, its mass concentration significantly increased during the HPE, particularly in the CS. The average HONO mass concentrations in the TS (5.06 µg m−3) and CS (12.66µg m−3) increased by 3.32 times and 8.3 times compared to the value in the Clean stage, respectively. The HONO mass concentrations were 4.6 ∼ 7.9 µg m−3 in the TS and 2.6 ∼ 24.1 µg m−3 in the CS. The main sources of HONO during HPE are discussed in Section 3.2.2.
3.2. Chemical evolution during the cumulative explosive growth process
3.2.1. Deliquescence relative humidity of PM2.5
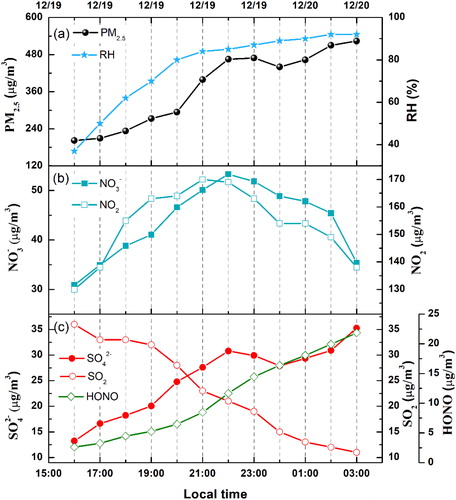
To investigate the mechanism of PM2.5 explosive growth when the external transportation was significantly weakened, REG 3 was selected as a typical representative cumulative explosive growth process. REG 3 which occurred at dusk and night could also avoid the interference of HONO photolysis. As shown in , the PM2.5 mass concentration increased with the increase in RH. Higher relative humidity can increase the liquid water content on particle surfaces, which can enable aqueous-phase reactions on the surface (Xie et al., Citation2015; Zhong et al., Citation2017). Currently, the question of at which RH the PM2.5 surface can be changed from solid to liquid remains an open debate. For example, Wang et al. proposed that SO2 oxidation by NO2 was favored on fine aerosols with high RH (> 60–70%) (Wang et al., Citation2016). However, Sun et al. suggested that the aqueous-phase processing of SO2 occurred when the RH level was higher than 50% (Sun et al., Citation2013). Khlystov et al. (Khlystov et al., Citation2005) found that the aerosol water content significantly increased with higher RH (55%).
Fig. 6. Time series for the (a) PM2.5 mass concentration and ambient RH, (b) nitrate and nitrogen dioxide, (c) sulfate, sulfur dioxide, and HONO in REG3.
The deliquescence relative humidity (DRH) of preexisting hygroscopic particulate species in PM2.5 plays a key role in determining when the surface gradually changes from solid to liquid. When the relative humidity in ambient air is above DRH, a phase transition from solid to saturated aqueous solution occurs. DRH varies with the temperature and species. The relationship is as follows (Wexler and Seinfeld, Citation1991; Fountoukis and Nenes, Citation2007):
(1)
(1)
where Mw is the molar mass of water; ms is the molality of the saturated solution at temperature T0; R is the gas constant. Ls is the latent heat of fusion for the salt from a saturated solution given by Ls = ΔHcr − ΔHaq. ΔHcr and ΔHaq correspond to the molar enthalpies of formation of the solid phase and the species in the aqueous solution, respectively.
As mentioned, NH4+, NO3–, SO42–, and Cl– were the most dominant ions in PM2.5 during the HPE. Their potential combinations into salts in the solid phase can determine the DRH value of PM2.5. According to the volatile order ((NH4)2SO4 < NH4NO3 < NH4Cl), (NH4)2SO4 is preferentially formed among the ammonium-associated compounds (Hu et al., 2014). Thus, we can assume that NH4+ is first associated with SO42–. NH4NO3 is formed if excess NH4+ is available beyond the sulfate requirement. As shown in , all data were above the 1:1 line, which implies that there was sufficient NH4+ to neutralize all SO42–, and it existed as (NH4)2SO4. In , most of the samples had sufficient NH4+ to neutralize NO3– in addition to SO42–. When Cl– was included, as shown in , the ratio was near unity. Thus, NH4+, NO3–, SO42–, and Cl– were finally in the mixture form of (NH4)2SO4, NH4NO3, and NH4Cl.
Fig. 7. Scatter plots of particulate [NH4+] against 2 × [SO42–], 2 × [SO42–] + [NO3–], 2 × [SO42–] + [NO3–] + [Cl–] in REG 3. [] refers to molar concentration.
![Fig. 7. Scatter plots of particulate [NH4+] against 2 × [SO42–], 2 × [SO42–] + [NO3–], 2 × [SO42–] + [NO3–] + [Cl–] in REG 3. [] refers to molar concentration.](/cms/asset/1dfe1811-7bcd-4fc4-bf8f-ecaffbfaeabf/zelb_a_1620079_f0007_c.jpg)
Depending on the species, relative humidity and temperature, we calculated the DRH for these three species on the surface in REG 3 according to EquationEquation (1)(1)
(1) . The DRHs were calculated based upon an externally mixed aerosol here. An internally mixed aerosol would behave differently to the externally mixed compounds. As shown in , the DRH in REG 3 was 82%, 81%, and 83% for (NH4)2SO4, NH4NO3, and NH4Cl, respectively. Thus, the PM2.5 surface in REG 3 began to change from solid to liquid when the RH was above 81%.
Table 3. Deliquescence relative humidity for (NH4)2SO4, NH4NO3, and NH4Cl in REG3.
3.2.2. Aqueous-phase reaction
As presented in , the NO3– concentration was closely related to the emission of NO2 from traffic. Nitrate concentration increased from 30.9 µg m−3 at 16:00 and reached the maximum value (53.2 µg m−3) at 22:00. After that, nitrate concentration began to decrease with the concentration of NO2 while PM2.5 concentration kept growing. Nitrate was proposed to be predominately formed via the homogeneous gas-phase of NO2 and via heterogeneous chemistry (Seinfeld and Pandis, Citation1986; Zhang et al., Citation2018). Nitrogen oxidation ratio (NOR), defined as the molar ratio of fine particulate nitrate to the total oxidized nitrogen, was used to estimate the degree of atmospheric transformation of NO2 to NO3– (Du et al., 2011; Hu et al., 2014; Ji et al., Citation2014; Zhang et al., Citation2018). It was calculated as follows:
(2)
(2)
where n is the molar concentration.
It was reported by Fu et al. (Citation2008) that NOR was less than 0.1 in the case of primary emissions, while larger than 0.1 when nitrate was mainly produced via the secondary transformation of NOx oxidation (Fu et al., Citation2008). As displayed in , all NOR values in the REG3 were above 0.1, indicating that nitrate was mainly produced by secondary formation.
Fig. 8. The relationship between the NOR and the RH in the REG3.
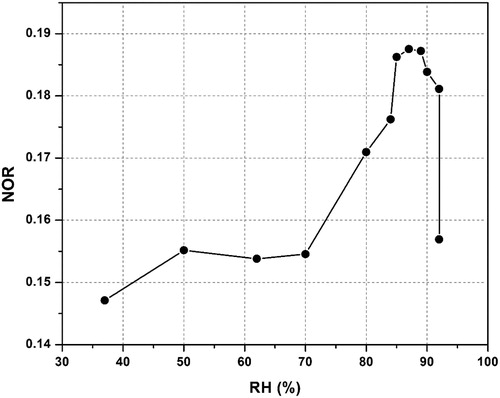
The relationship between the NOR and the RH is shown in . When RH < 80%, NOR increased with the increase in RH. When RH was above 80%, there was no specific rule between NOR and RH. NO2 has limited water solubility and is usually present in low concentration in the aqueous phase (below 1 nM) (Seinfeld and Pandis, Citation1986). Hence, the potential NO2 aqueous-phase oxidation at the particle surface, as expressed in Reaction 1 (R1), is believed to contribute a negligible amount to the aqueous-phase nitrate.
R1
R1
In contrast, the aqueous-phase reaction may be a critical pathway for the sulfate explosive growth during HPE. As presented in , the mass concentration of sulfate increased with the increase in RH although the mass concentration of its precursor SO2 decreased. During the entire cumulative explosive growth process, SO42– exhibited a complete inverse correlation with SO2. To quantitatively characterize the secondary transformation reactions of SO2 to sulfate, the sulfur oxidation ratio (SOR) was applied as an indicator and calculated using EquationEquation (3)(3)
(3) (Sun et al., Citation2006, Citation2013; Hu et al., 2014).
(3)
(3)
Sulfate is considered to mainly come from primary source emissions when the SOR is smaller than 0.1. Otherwise, a secondary transformation of SO2 would be regarded as the main source of sulfate (Yao et al., Citation2002; Zhang et al., Citation2018). In the REG3, all SOR values were greater than 0.1, suggesting that sulfate mainly generated from the secondary oxidation of SO2. SOR displays an evident exponential relationship with the RH in . The red line in shows an excellent exponential fit through the data with R2 = 0.99. The exponential fit expression is y = 0.21 + 3.67 × 10⁻⁴exp(x/13). The average SOR at RH < 80% was less than 0.3, which indicates a notably low sulfur production ratio. When the RH was beyond 80%, the SOR increased at a faster rate to 0.68. This result confirms that aqueous-phase oxidation of SO2 plays an important role in the explosive sulfate growth. Interestingly, the RH value (∼80%) above which sulfate began to grow explosively was nearly equal to the deliquescence relative humidity of PM2.5 in REG 3. It has been mentioned in Section 3.2.1 that liquid water formed on the PM2.5 surface when RH was larger than 81% in REG 3. PM2.5 mass concentration increased at a faster rate when particle gradually became aqueous. Calculated from , the growth rate of PM2.5 mass concentration was 23.0 µg m−3 h−1 when RH < 81% while the value was 66.5 µg m−3 h−1 RH > 81%. That is, once the surface began to deliquesce RH > 81%, the growth rate of PM2.5 mass concentration was three times larger. As shown in , there existed an obvious exponential relationship between PM2.5 and RH. It also suggests the importance of the aqueous reactions in the REG3.
Fig. 9. Relationship between RH and (a) SOR, (b) PM2.5, and (c) HONO in REG 3.
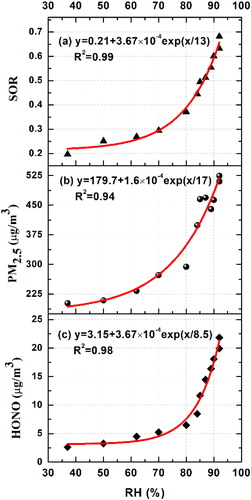
HONO is considered a gaseous product produced by aqueous-phase oxidation of SO2 by NO2 (Seinfeld and Pandis, Citation1986; Xie et al., Citation2015; Wang et al., Citation2016). shows that the HONO mass concentration quickly increased with the explosive growth of sulfate and PM2.5. Interestingly, shows that HONO also exhibited an apparent exponential relationship with RH (R2 = 0.98). In addition, its explosive growth relative humidity (∼80%) was almost identical to that of SOR. There was a good positive correlation between HONO and SOR in REG 3, which indicates that with a higher degree of transformation from SO2 to sulfate, more HONO was formed.
Combined with our observation results and analysis, the aqueous-phase oxidation mechanism of SO2 by NO2 was proposed. When RH exceeded 80%, the surface of preexisting PM2.5 changed from solid to liquid. Gaseous SO2 can absorb into the water surface. Generally, the absorption of SO2 in aqueous solutions is considered a dynamic equilibrium process (Seinfeld and Pandis, Citation1986), as shown in R2. Sulfur dioxide hydrate can be hydrolyzed into HSO32– and SO32–. The behavior of SO2 in water is expressed as follows:
R2
R2
R3
R3
R4
R4
The aqueous-phase reactions of S(IV) by NO2 have been known for many years and are considered an effective method to form sulfate (Seinfeld and Pandis, Citation1986). The aqueous processes in R5 and R6 have been discovered in many field observations (Xie et al., Citation2015; Cheng et al., 2016; Wang et al., Citation2016). Wang et al. (Wang et al., Citation2016) also proved that aqueous SO2 oxidation by NO2 was an important method to promote the sulfate and HONO formation by conducting a series of laboratory experiments in a reaction cell. The reaction process is shown as follows:
R5
R5
R6
R6
3.2.3. Ammonia neutralization
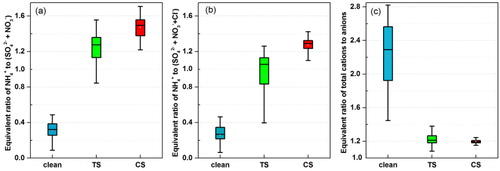
Gaseous ammonia (NH3) is the most abundant alkaline gas in the atmosphere (Behera et al., Citation2013). It is converted to NH4+ through the neutralization of acid species such as HNO3 and H2SO4. Because there were no NH3 concentration data in our observation, we had to calculate the equivalent ratio of NH4+ to the total of SO42− and NO3– to evaluate whether there was sufficient NH3 to neutralize the dominant secondary acid ions during the HPE. As shown in , the equivalent ratio of NH4+ to the sum of SO42− and NO3– was slightly larger than unity throughout the heavy pollution episode. The mean ratios increased from 1.15 in the TS to 1.47 in the CS. When the chloride anion (shown in ), which likely exists as NH4Cl in PM2.5, was included, the equivalent ratio in the TS was close to unity, whereas the value in the CS remained greater than 1, i.e., there was sufficient NH3 to supply NH4+ to neutralize the anions in PM2.5 during the HPE. Therefore, H+ in the aqueous-phase reactions was finally neutralized by NH3 in ambient air, forming NH4+ on the PM2.5 surface.
R7
R7
Fig. 10. Equivalent ratio of (a) ammonium (NH4+) to the sum of SO42− and NO3–, (b) NH4+ to the sum of SO42−, NO3−, and Cl−, (c) total cations to anions in PM2.5. The top and bottom of the vertical line for each box correspond to the 95th and 5th percentiles, respectively. While the top, middle, and bottom horizontal lines of the box mark the 75th, 50th, and 25th percentiles of the data range. The white dot in each box represents the mean value.
The neutralization status of PM2.5 was further analyzed using the ion balance method based on the principle of electroneutrality (Hennigan et al., Citation2015). The method assumes that any deficit in the measured cationic charge compared to the measured anionic charge is because of the presence of protons. The equivalent molar concentrations of anion and cation species are calculated as follows:
where [] denotes the mass concentration of anion and cation species.
As shown in , the mean ratios were 1.19 and 1.25 in the TS and CS, respectively. The equivalent molar concentrations of cations were slightly larger than that of the anions in both TS and CS, which indicates that there was almost no H+, and PM2.5 was fully neutralized during HPE. This result is consistent with Wang’s results that fine PM in Beijing was effectively neutralized by NH3 when the rapid sulfate production occurred during the polluted period (Wang et al., Citation2016).
3.2.4. Overall process
The overall process of SO2 aqueous-phase oxidation by NO2 when RH > 80% can be summarized as R8 (Wang et al., Citation2016):
R8
R8
As shown in , sulfate concentration increased by 22.1 µg m−3 with a HONO concentration increase of 19.2 µg m−3 in the RGE 3. The ratio of sulfate increase and HONO mass concentration increase (22.1 µg m−3/19.2 µg m−3 = 1.15) was very close to the theoretical value (1.02) calculated by the stoichiometry of R8. Thus, it is reasonable to consider aqueous-phase oxidation of sulfur dioxide by nitrogen dioxide as an important source of sulfate in the accumulative explosive growth.
To investigate whether there was sufficient NO2 to maintain this reaction proceeding efficiently, the molar concentration ratios of NO2 to SO2, n(NO2)/n(SO2), were calculated. According to the stoichiometric ratio, if n(NO2)/n(SO2) was larger than 2, it was defined as a NO2-rich condition, under which NO2 was sufficient and would ensure the progress of the aqueous-phase reaction. Otherwise, if n(NO2)/n(SO2) was smaller than 2, it would be identified as a NO2-poor condition. In the REG 3, the values of n(NO2)/n(SO2) was determined to be 5–17. All values exceeded 2, which indicates that the NO2 concentration was excessive compared to the SO2 concentration during the entire explosive growth process 3. Thus, sulfate continued to rapidly grow at relative low SO2 concentrations (below 15 µg m−3).
4. Conclusions
A heavy pollution episode (HPE) occurred over North China on 15–22 December 2016. Because of the large area and long duration of heavy air pollution, Beijing municipal issued a red alert for smog-haze at 12:00 am on December 16. In this study, the hourly mass concentrations of major water-soluble inorganic ions (NH4+, K+, Ca2+, Mg2+, SO42–, NO3–, and Cl–) in PM2.5 and gaseous HONO were in situ monitored using an ambient ion monitor on 15–23 December 2016 in Beijing. The average mass concentration of total water-soluble ions was 69 µg m−3 during the red-alert HPE, which accounted for approximately 28% of PM2.5. Their hourly mass concentrations were in the order of NO3– > SO42– > NH4+ > Cl– >K+ during the HPE. According to the results of our previous study on the relative contributions of the boundary-layer (BL) meteorological factors, the red-alert HPE on 15–22 December 2016 in Beijing was divided into two stages: pollution transport stage (TS) and pollution cumulative stage (CS). For better comparison, a clean stage (Clean) was selected. The mean PM2.5 mass concentrations in the Clean, TS and CS were 19.1, 206.1, and 392.5 µg/m3, respectively. For NO3–, SO42–, NH4+, K+, and Cl–, most of their mass concentrations maximized in the CS after 4 wavelike increases in the TS. Both Cl− and K+ were well correlated with PM2.5, which indicates that fuel combustion and biomass burning may contribute to air pollution during the red-alert HPE. According to the ion balance method based on the principle of electroneutrality, PM2.5 in both TS and CS was confirmed to be fully neutralized.
Apart from the interference of external transmission, the explosive growth in the CS, which is marked as REG 3, was selected to investigate the mechanism of the cumulative explosive growth process in Beijing. Under the stagnant meteorological conditions in the CS, the external pollutant transmission was markedly weakened, and the secondary pollution became dominant. Because of the weak solar radiation and low O3 concentration during the HPE, photochemical oxidation, which formed sulfate and nitrate, was nearly negligible. Interestingly, the PM2.5 cumulative explosive growth processes usually occurred in high-relative-humidity (RH) condition. Depending on the relative humidity, temperature, and potential species, the deliquescence relative humidity was 82%, 81%, and 83% for (NH4)2SO4, NH4NO3, and NH4Cl, respectively. When RH > 81%, the preexisting PM2.5 surface changed from solid to liquid. The aqueous-phase oxidation of SO2 by NO2 to sulfate was confirmed to play an important role in the cumulative explosive growth. This process was accompanied by the generation of gaseous HONO with mass concentrations of 2.5–21.9 µg/m3 in REG 3. Both sulfur oxidation ratio (SOR) and HONO displayed an evident exponential relationship with RH. They increased more quickly when RH exceeded 80%. Compared to the SO2 concentration, NO2 concentration was sufficiently excessive, so the aqueous-phase oxidation of SO2 efficiently proceeded even at low SO2 concentrations. Therefore, high relative humidity, which caused the aqueous-phase oxidation, was a crucial factor in the PM2.5 cumulative explosive growth during the red-alert HPE. To avoid this explosive growth, it was also important to limit the NO2 emission when one controls the SO2 emission from coal.
Supplementary data
Supplemental data for this article can be accessed here: https://doi.org/10.1080/16000889.2019.1620079.
Disclosure statement
No potential conflict of interest was reported by the authors.
Additional information
Funding
References
- Behera, S. N., Sharma, M., Aneja, V. P. and Balasubramanian, R. 2013. Ammonia in the atmosphere: A review on emission sources, atmospheric chemistry and deposition on terrestrial bodies. Environ. Sci. Pollut. Res. 20, 8092–8131. doi:10.1007/s11356-013-2051-9
- Che, H. C., Zhang, X. Y., Wang, Y. Q., Zhang, L. and Shen, X. J. and co-authors. 2016. Characterization and parameterization of aerosol cloud condensation nuclei activation under different pollution conditions. Sci. Rep. 6, 24497. doi:10.1038/srep24497
- Chen, X., Zhang, L-W., Huang, J-J., Song, F-J., Zhang, L-P. and co-authors. 2016. Long-term exposure to urban air pollution and lung cancer mortality: A 12-year cohort study in Northern China. Sci. Total Environ. 571, 855–861. doi:10.1016/j.scitotenv.2016.07.064
- Chen, Y. and Xie, S. D. 2014. Characteristics and formation mechanism of a heavy air pollution episode caused by biomass burning in Chengdu, Southwest China. Sci. Total Environ. 473, 507–517.
- Cheng, Y., Zheng, G., Wei, C., Mu, Q., Zheng, B. and co-authors. 2016. Reactive nitrogen chemistry in aerosol water as a source of sulfate during haze events in China. Sci. Adv. 2, e1601530. doi:10.1126/sciadv.1601530.
- Du, H., Kong, L., Cheng, T., Chen, J., Du, J. and co-authors. 2011. Insights into summertime haze pollution events over Shanghai based on online water-soluble ionic composition of aerosols. Atmos. Environ. 45, 5131–5137. doi:10.1016/j.atmosenv.2011.06.027
- Duan, F. K., Liu, X. D., Yu, T. and Cachier, H. 2004. Identification and estimate of biomass burning contribution to the urban aerosol organic carbon concentrations in Beijing. Atmos. Environ. 38, 1275–1282. doi:10.1016/j.atmosenv.2003.11.037
- Ehn, M., Thornton, J. A., Kleist, E., Sipilä, M., Junninen, H. and co-authors. 2014. A large source of low-volatility secondary organic aerosol. Nature 506, 476–479. doi:10.1038/nature13032
- Fountoukis, C. and Nenes, A. 2007. ISORROPIA II: A computationally efficient thermodynamic equilibrium model for K+-Ca2+-Mg2+-Nh(4)(+)-Na+-SO42–NO3–Cl–H2O aerosols. Atmos. Chem. Phys. 7, 4639–4659. doi:10.5194/acp-7-4639-2007
- Fu, Q., Zhuang, G., Wang, J., Xu, C., Huang, K. and co-authors. 2008. Mechanism of formation of the heaviest pollution episode ever recorded in the Yangtze River Delta, China. Atmos. Environ. 42, 2023–2036. doi:10.1016/j.atmosenv.2007.12.002
- Hennigan, C. J., Izumi, J., Sullivan, A. P., Weber, R. J. and Nenes, A. 2015. A critical evaluation of proxy methods used to estimate the acidity of atmospheric particles. Atmos. Chem. Phys. 15, 2775–2790. doi:10.5194/acp-15-2775-2015
- Hou, S., Tong, S., Ge, M. and An, J. 2016. Comparison of atmospheric nitrous acid during severe haze and clean periods in Beijing, China. Atmos. Environ. 124, 199–206. doi:10.1016/j.atmosenv.2015.06.023
- Hu, G., Zhang, Y., Sun, J., Zhang, L. and Shen, X. and co-authors 2014. Variability, formation and acidity of water-soluble ions in PM2.5 in Beijing based on the semi-continuous observations. Atmos. Res. 145, 1–11.
- Huang, R.-J., Zhang, Y., Bozzetti, C., Ho, K.-F., Cao, J.-J. and co-authors. 2014a. High secondary aerosol contribution to particulate pollution during haze events in China. Nature 514, 218–222. doi:10.1038/nature13774
- Huang, X., Song, Y., Zhao, C., Li, M. M. Zhu, T. and co-authors 2014b. Pathways of sulfate enhancement by natural and anthropogenic mineral aerosols in China. J. Geophys. Res. -Atmos. 119, 14165–14179. doi:10.1002/2014JD022301
- Ji, D., Li, L., Wang, Y., Zhang, J., Cheng, M. and co-authors. 2014. The heaviest particulate air-pollution episodes occurred in northern China in January, 2013: Insights gained from observation. Atmos. Environ. 92, 546–556. doi:10.1016/j.atmosenv.2014.04.048
- Jimenez, J. L., Canagaratna, M. R., Donahue, N. M., Prevot, A. S. H., Zhang, Q. and co-authors. 2009. Evolution of organic aerosols in the atmosphere. Science 326, 1525–1529. doi:10.1126/science.1180353
- Khlystov, A., Stanier, C. O., Takahama, S. and Pandis, S. N. 2005. Water content of ambient aerosol during the Pittsburgh air quality study. J. Geophys. Res. -Atmos. 110, 10.
- Leng, C., Duan, J., Xu, C., Zhang, H., Zhang, Q. and co-authors. 2015. Insights into a historic severe haze weather in Shanghai: Synoptic situation, boundary layer and pollutants. Atmos. Chem. Phys. Discuss. 15, 32561–32605. doi:10.5194/acpd-15-32561-2015
- Pöschl, U. and Shiraiwa, M. 2015. Multiphase chemistry at the atmosphere–biosphere interface influencing climate and public health in the Anthropocene. Chem. Rev. 115, 4440–4475. doi:10.1021/cr500487s
- Pathak, R. K., Wang, T. and Wu, W. S. 2011. Nighttime enhancement of PM2.5 nitrate in ammonia-poor atmospheric conditions in Beijing and Shanghai: Plausible contributions of heterogeneous hydrolysis of N2O5 and HNO3 partitioning. Atmos. Environ. 45, 1183–1191. doi:10.1016/j.atmosenv.2010.09.003
- Seinfeld, J. H. and Pandis, S. N. 1986. Atmospheric Chemistry and Physics: From Air Pollution to Climate Change. John Wiley & Sons, USA.
- Sun, Y. L., Zhuang, G. S., Tang, A. H., Wang, Y. and An, Z. S. 2006. Chemical characteristics of PM2.5 and PM10 in haze-fog episodes in Beijing. Environ. Sci. Technol. 40, 3148–3155. doi:10.1021/es051533g
- Sun, Y., Wang, Z., Fu, P., Jiang, Q., Yang, T. and co-authors. 2013. The impact of relative humidity on aerosol composition and evolution processes during wintertime in Beijing, China. Atmos. Environ. 77, 927–934. doi:10.1016/j.atmosenv.2013.06.019
- Tie, X. X., Wu, D. and Brasseur, G. 2009. Lung cancer mortality and exposure to atmospheric aerosol particles in Guangzhou, China. Atmos. Environ. 43, 2375–2377. doi:10.1016/j.atmosenv.2009.01.036
- Tong, S., Hou, S., Zhang, Y., Chu, B., Liu, Y. and co-authors. 2015. Comparisons of measured nitrous acid (HONO) concentrations in a pollution period at urban and suburban Beijing, in autumn of 2014. Sci. China Chem. 58, 1393–1402. doi:10.1007/s11426-015-5454-2
- Tong, S., Hou, S., Zhang, Y., Chu, B., Liu, Y. and co-authors. 2016. Exploring the nitrous acid (HONO) formation mechanism in winter Beijing: Direct emissions and heterogeneous production in urban and suburban areas. Faraday Discuss. 189, 213–230. doi:10.1039/C5FD00163C
- Wang, G., Zhang, R., Gomez, M. E., Yang, L., Levy Zamora, M. and co-authors. 2016. Persistent sulfate formation from London Fog to Chinese haze. Proc. Natl. Acad. Sci. USA. 113, 13630–13635. doi:10.1073/pnas.1616540113
- Wang, Y., Zhuang, G. S., Sun, Y. L. and An, Z. S. 2006. The variation of characteristics and formation mechanisms of aerosols in dust, haze, and clear days in Beijing. Atmos. Environ. 40, 6579–6591. doi:10.1016/j.atmosenv.2006.05.066
- Wang, Z. L., Zhang, H. and Zhang, X. Y. 2015. Simultaneous reductions in emissions of black carbon and co-emitted species will weaken the aerosol net cooling effect. Atmos. Chem. Phys. 15, 3671–3685. doi:10.5194/acp-15-3671-2015
- Wexler, A. S. and Seinfeld, J. H. 1991. Second-generation inorganic aerosol model. Atmos. Environ. Part A. General Top. 25, 2731–2748. doi:10.1016/0960-1686(91)90203-J
- Wu, W. S. and Wang, T. 2007. On the performance of a semi-continuous PM2.5 sulphate and nitrate instrument under high loadings of particulate and sulphur dioxide. Atmos. Environ. 41, 5442–5451. doi:10.1016/j.atmosenv.2007.02.025
- Xie, Y., Ding, A., Nie, W., Mao, H., Qi, X. and co-authors. 2015. Enhanced sulfate formation by nitrogen dioxide: Implications from in situ observations at the SORPES station. J. Geophys. Res. Atmos. 120, 12679–12694. doi:10.1002/2015JD023607
- Yang, F., Tan, J., Zhao, Q., Du, Z., He, K. and co-authors. 2011. Characteristics of PM2.5 speciation in representative megacities and across China. Atmos. Chem. Phys. 11, 5207–5219. doi:10.5194/acp-11-5207-2011
- Yang, Y., Liu, X., Qu, Y., Wang, J., An, J. and co-authors. 2015. Formation mechanism of continuous extreme haze episodes in the megacity Beijing, China, in January 2013. Atmos. Res. 155, 192–203. doi:10.1016/j.atmosres.2014.11.023
- Yao, X., Chan, C. K., Fang, M., Cadle, S., Chan, T. and co-authors. 2002. The water-soluble ionic composition of PM2.5 in Shanghai and Beijing, China. Atmos. Environ. 36, 4223–4234. doi:10.1016/S1352-2310(02)00342-4
- Zhang, T., Cao, J. J., Tie, X. X., Shen, Z. X., Liu, S. X. and co-authors. 2011. Water-soluble ions in atmospheric aerosols measured in Xi’an, China: Seasonal variations and sources. Atmos. Res. 102, 110–119. doi:10.1016/j.atmosres.2011.06.014
- Zhang, L., Sun, J. Y., Shen, X. J., Zhang, Y. M., Che, H. C. and co-authors. 2015a. Observations of relative humidity effects on aerosol light scattering in the Yangtze River Delta of China. Atmos. Chem. Phys. Discuss. 15, 2853–2904. doi:10.5194/acpd-15-2853-2015
- Zhang, R., Wang, G., Guo, S., Zamora, M. L., Ying, Q. and co-authors. 2015b. Formation of urban fine particulate matter. Chem. Rev. 115, 3803–3855. doi:10.1021/acs.chemrev.5b00067
- Zhang, Y. W., Zhang, X. Y., Zhang, Y. M., Shen, X. J., Sun, J. Y. and co-authors. 2015c. Significant concentration changes of chemical components of PM1 in the Yangtze River Delta area of China and the implications for the formation mechanism of heavy haze-fog pollution. Sci. Total Environ. 538, 7–15. doi:10.1016/j.scitotenv.2015.06.104
- Zhang, R., Sun, X., Shi, A., Huang, Y., Yan, J. and co-authors. 2018. Secondary inorganic aerosols formation during haze episodes at an urban site in Beijing, China. Atmos. Environ. 177, 275–282. doi:10.1016/j.atmosenv.2017.12.031
- Zhang, Y. M., Zhang, X. Y., Sun, J. Y., Hu, G. Y., Shen, X. J. and co-authors. 2014. Chemical composition and mass size distribution of PM1.0 at an elevated site in central east China. Atmos. Chem. Phys. Discuss. 14, 15191–15218. doi:10.5194/acpd-14-15191-2014
- Zhang, W., Tong, S., Ge, M., An, J., Shi, Z. and co-authors. 2019. Variations and sources of nitrous acid (HONO) during a severe pollution episode in Beijing in winter 2016. Sci. Total Environ. 648, 253–262. doi:10.1016/j.scitotenv.2018.08.133
- Zhong, J., Zhang, X., Wang, Y., Sun, J., Zhang, Y. and co-authors. 2017. Relative contributions of boundary-layer meteorological factors to the explosive growth of PM2.5 during the Red-Alert heavy pollution episodes in Beijing in December 2016. J. Meteorol. Res. 31, 809–819. doi:10.1007/s13351-017-7088-0
- Zhou, Y., Wang, T., Gao, X., Xue, L., Wang, X. and co-authors. 2009. Continuous observations of water-soluble ions in PM2.5 at Mount Tai (1534 ma.s.l.) in central-eastern China. J. Atmos. Chem. 64, 107–127. doi:10.1007/s10874-010-9172-z