
 ?Mathematical formulae have been encoded as MathML and are displayed in this HTML version using MathJax in order to improve their display. Uncheck the box to turn MathJax off. This feature requires Javascript. Click on a formula to zoom.
Abstract
Particulate matter (PM) can have adverse effects on human health. Moreover, because the mechanisms of PM formation and behavior in the atmosphere are notably complicated, to reduce PM concentrations effectively and meet environmental standards, source–receptor relationships must be clearly understood. Stable isotope ratios can be used to detect chemical processes and distinguish sources. In environmental science, especially in research on aerosols, stable isotope ratios have proven to constitute a powerful tool for source identification. However, there are few long-term studies of isotope fractionation during secondary aerosol formation. In this study, stable nitrogen isotope ratios (δ15N) of ammonia gas (NH3), nitrogen dioxide gas (NO2), nitric acid vapor (HNO3), particulate nitrate (NO3−), and ammonium (NH4+) in suspended PM (SPM) were analyzed to investigate seasonal trends and isotope fractionation during aerosol formation for long term sampling in Akita, Japan. The results indicated that δ15N-NH4+ in SPM and δ15N-NH3 gas ranged from 1.3‰ to 38.5‰ (mean 16.1‰) and from −33.6‰ to −0.0‰ (−16.9‰), respectively. Furthermore, δ15N-NO3− (SPM) and δ15N-NO2 and δ15N-HNO3 (gaseous) ranged from −4.6‰ to 4.8‰ (mean −0.5‰), from −8.2‰ to −3.1‰ (−5.4‰), and from −7.5‰ to 2.7‰ (−5.0‰), respectively. The mean annual isotope fractionation factors for transformations from gaseous NH3 to NH4+ in SPM, from gaseous NO2 to gaseous HNO3, and from HNO3 gas to NO3– in SPM in the atmospheric environment were +33.3‰, +0.5‰, and +4.9‰, respectively. Isotope fractionation of NH4+ in SPM was much higher than that of NO3– in SPM. As the chemical reaction from gaseous precursors progressed, δ15N-NO3– in SPM became steadily heavier.
Keywords:
1. Introduction
Particulate matter (PM) has adverse effects on human health (e.g., Pope et al., Citation1991; Brunekreef and Holgate, Citation2002; Hoek et al., Citation2002). In Japan, suspended PM (SPM) is defined as particles with a diameter of <10 μm with a cut-off of 100%. To reduce the SPM concentration in the environment, environmental air standards and effluent control have been in place since the 1970s (Japan Ministry of the Environment, Citation2018). Although the SPM concentration in Japan was dramatically reduced during the 1980s, it has not decreased further since the 2000s but has remained at ∼20 μg m−3 on average (Environment, M. o. t, Citation2017). Spring SPM values in Japan are generally affected dominantly by dust storms from continental Asia (e.g., Aggarwal and Kawamura, Citation2009), whereas winter values are more likely to be affected by sulfate, nitrite, and lead transported by continental winds (Mukai et al., Citation2001; Akata and Yanagisawa, Citation2002; Matsumoto et al., Citation2003). The water-soluble ion composition of aerosol particles differs among sources (Shen et al., Citation2009), and changes from gaseous precursors to particulate phases in SPM are promoted at low temperatures. However, owing to the complex mechanisms of SPM formation and behavior in the atmosphere and the many sources of SPM, it is difficult to define the relationship between source and receptor. Thus, to further reduce SPM concentrations, it is necessary to identify the emission sources of particulates and precursor gases and their behavior in the atmosphere.
Recent technical advances have made it possible to analyze stable isotope ratios in a small sample volume with high accuracy and precision by using techniques such as mass spectrometry together with elemental analysis and gas chromatography (e.g., Sharp (Citation2017)). In environmental science, stable isotope ratios constitute a powerful tool for source identification. In particular, stable isotopes of light elements (e.g., carbon, nitrogen, sulfur, and oxygen) have proven useful for identifying sources and inferring atmospheric chemical reactions involving aerosols.
Following early studies of nitrogen isotopic ratios of environmental nitrogen compounds (Hoering, Citation1957; Moore, Citation1974; Moore, Citation1977; Freyer, Citation1978), many studies have examined stable nitrogen isotope ratios (δ15N) of gaseous ammonia (NH3), gaseous nitrogen dioxide (NO2), nitric acid vapor (HNO3), and nitrate (NO3−) and ammonium (NH4+) in aerosol particles (Heaton, Citation1986, Citation1987, Citation1990; Freyer, Citation1991; Freyer et al., Citation1993; Russell et al., Citation1998; Yeatman et al., Citation2001a,Citationb; Hayasaka et al., Citation2004; Li and Wang, Citation2008; Kundu et al., Citation2010; Pavuluri et al., Citation2010; Kawashima and Kurahashi, Citation2011). Researchers working in oceanography developed a high-precision method using a denitrifying bacterium to analyze stable nitrogen and oxygen isotopic ratios in nitric acid (Sigman et al., Citation2001; Casciotti et al., Citation2002; McIlvin and Casciotti, Citation2011) and a similar method to analyze stable nitrogen isotopic ratios in NH4+ after oxidizing it with NO3− (Felix et al., Citation2013). These methods have been applied to the estimation of sources of particulate matter and gaseous nitrogen compounds and other research on environmental isotopes (Elliott et al., Citation2009; Felix et al., Citation2012; Hastings et al., Citation2013; Redling et al., Citation2013; Felix and Elliott, Citation2014; Felix et al., Citation2014; Walters et al., Citation2015a,b; Fibiger and Hastings, Citation2016; Pan et al., Citation2016; Walters et al., Citation2016; Felix et al., Citation2017; Yu and Elliott, Citation2017; Walters and Hastings, Citation2018). However, only a few studies have measured nitrogen isotopes in gases and particles collected simultaneously over extended periods and have examined isotopic fractionation during gas–particle reactions (Moore, Citation1977; Freyer, Citation1991). The review by Elliott et al. (Citation2019) described that medium-, and long-term data need for future research.
In this study, stable nitrogen isotope ratios (δ15N) of gaseous NH3, NO2, and HNO3 (δ15N-NH3, δ15N-NO2, and δ15N-HNO3, respectively) and of NO3− and NH4+ ions (δ15N-NO3− and δ15N-NH4+, respectively) in SPM were measured for long term sampling, and the analysis results were used to examine isotope fractionation during gas-to-aerosol reactions and the sources and behavior of these compounds in the atmosphere.
2. Methods
2.1. SPM sampling and sampling of gases in ambient air
Ambient measurements were performed in a typical Japanese rural area at Akita Prefectural University in Yurihonjo City, Akita Prefecture, Japan (latitude 39.2°N, longitude 140.4°E). The site is ∼5 km from the coast. A rice paddy (200 m), a residential area (1 km), and a cow barn (400 m) are situated near the measurement site, but there is no large single point source of pollution such as a large factory nearby. Aerosol sampling was conducted over ∼10-day periods from April 2008 to December 2010. At least 0.24–0.42 mg of nitrogen is needed to measure δ15N-NH4+ and δ15N-NO3− in SPM (i.e., 0.3–0.54 mg of N-NH4+ and 1.06–1.86 mg of N-NO3−) (Sakata, Citation2001), Typically, NH4+ and NO3− concentrations in SPM exceed 0.02 and 0.07 μg m−3, respectively. Therefore, a high-volume air sampler (HVS-1000; Sibata Scientific Technology, Saitama, Japan) with a flow rate of ∼1000 L min−1 was used to collect SPM. Glass fiber filters (GB-100R; Advantec Toyo Kaisha, Tokyo, Japan) were placed inside desiccators for a sufficient time period (at least 1 week) to remove any moisture content before they were used in the sampler. After the sampling, the sample filters were returned to the desiccator and then weighed on an electronic microbalance (LA220S-F; Sartorius Stedim Japan K.K., Tokyo, Japan; reading precision, 0.1 mg). After they were weighed, the sample filters were sealed in clean plastic bags and stored in a freezer at −31 °C.
The filter pack method was used to capture NH3, NO2, and HNO3 gases on filters (AF-20Y; Advantec Toyo Kaisha) placed inside a custom-made attachment installed in the air sampler under the aerosol filters. Before use, all filters were impregnated as described below inside a glove bag filled with ultra-high-purity nitrogen gas (99.9999%) and then sealed in clean plastic bags. All impregnating reagents were selected following (Hayami and Fujita, Citation2004). For NH3 gas, the filter was impregnated with 20% citric acid + 5% glycerin, and the sampling period was ∼2 days. Phosphoric acid was used for the filter pack for NH3 gas (Hayasaka et al., Citation2004; Felix et al., Citation2013).
For NO2 gas, the filter was coated with 10% triethanolamine + 20% potassium hydroxide + 1% glycerin, and the sampling interval was set to ∼4 days following (Moore, Citation1974). For HNO3 gas, the filter was coated with 20% potassium carbonate + 1% glycerin, and the sampling interval was ∼4 days (Dasch et al., Citation1989; Harrison and Kitto, Citation1990; Noguchi et al., Citation2007). The alkaline filter collected HNO3 gas, is possible that other gases such as HONO gas. However, regarding NO2 and NO gas, the collection rate was very low (≤1%) in the alkaline filter (Noguchi et al., Citation2007) and it was not necessary to consider. In this study, the filter collected both HNO3 gas and HONO gas.
Sampling of NH3, NO2 and HNO3 gases was conducted from December 2009 to December 2010. Also, all blanks could not be observed. In the pretreatment method using the distillation method of this study, it is reasonable that no blank appears because the analysis method is low in sensitivity.
2.2. Sampling of gas sources: cow barn and roadside sampling
Gas sources sampled were a cow barn in Yurihonjo City, ∼400 m south of Akita Prefectural University, and a roadside site in Akita City. In the cow barn, ∼50 calves are commercially raised at any given time, and the barn is not near any other pollutant source. The roadside sampling site is in a heavy-traffic area near a crossroads, and the only pollutant source at the site is vehicle emissions.
Gaseous NH3, NO2, and HNO3 (including HONO gas) were captured by passive diffusion on filters (AF-20Y; Advantec Toyo Kaisha, Ltd.) that were impregnated as described in section 2.1 and installed in a series of plastic boxes inside a custom-made wooden box. In addition to the impregnation reagents described above, the filter for NH3 gas was also coated with 5% phosphoric acid + 5% glycerin. Sampling of the source gases was conducted over periods of ∼1 month from 14 December 2009 to 18 December 2010.
In addition, Takegawa et al. (Citation2004) described that the average lifetimes of NOx and NOy are estimated to be 1.2 ± 0.4 and 1.7 ± 0.5 days, respectively. For the filter pack method in this study, sampling period for NO2 and HNO3 conducted 4 days. The passive sampling conducted ∼1 month. Thus, the gases seemed to be mixed sufficiently.
2.3. Sample preparation for isotope analysis
NH4+ and NO3− were isolated for δ15N analysis following the method of Sakata (Citation2001) as follows. First, NH4+ and NO3− were ultrasonically extracted from the sample filters in deionized water. The extracts were diluted by adding additional deionized water and then alkalized with NaOH in a flask. Next, NH4+ and NO3− were separated by a distillation procedure based on Japanese Industrial Standards Committee (Citation1998); in this procedure, only the extracted NH4+ is volatilized and absorbed by diluted H2SO4 (pH 2). After the distillation, the flask was cooled, and then the residue, without NH4+, was mixed with deionized water and Devarda’s alloy (No. 042-00525, 50% copper, 45% aluminum, 5% zinc, Wako Pure Chemical) to reduce the NO3− to NH4+. The NH4+ was then separated by distillation as described above and absorbed by diluted H2SO4. Finally, NH4+ was precipitated as the insoluble salt (C6H5)4BNH4 from each distillate by adding (C6H5)4BNa (No. 346-01535, Wako Pure Chemical) to the distillate and stirring. The precipitate was separated by filtering the solution through a 0.22-μm membrane filter (GVWP04700; Nihon Millipore K.K., Tokyo, Japan), oven-dried, packed in a tin cup, and subjected to δ15N measurement by elemental analysis (EA; Flash EA, Thermo Fisher Scientific Inc., Bremen, Germany) and isotope ratio mass spectrometry (IRMS; MAT253, Thermo Fisher Scientific) within 1 day. Stable nitrogen isotope ratios, expressed as permil (‰) in δ notation, were calculated with EquationEq (1)(1)
(1) :
(1)
(1)
where (15N/14N)sample and (15N/15N)std are the ratios of 15N to 14N in the sample and the IAEA-N1 international atmospheric N2 standard (RM8547, National Institute of Standards and Technology, +0.4 ± 0.2‰), respectively. The δ15N results were verified by measuring a l-histidine working standard (Shoko, Tokyo, Japan, δ15N = −8.42‰) and calibrated using the standard. The working standard and international standard were measured after every 6 and 30 samples, respectively. δ15N was calculated using ISODAT NT 2.0 IRMS software.
The precision and accuracy of the separation method in this study were tested following Kawashima and Kurahashi (Citation2011) by using purchased NH4Cl (017-02995, >99.5%; Wako Pure Chemical) and KNO3 (160-04035, >99.5%, Wako Pure Chemical) reagents, which were individually analyzed and then measured by EA–IRMS (six times to assess reproducibility). The δ15N-NH4+ and δ15N-NO3− values of the reagent standards were −5.91 ± 0.02‰ and +0.45 ± 0.09‰, respectively. The δ15N-NH4+ and δ15N-NO3− values obtained for these reagents after separation by the distillation procedure described above and EA–IRMS measurement were −5.94 ± 0.04‰ (a difference of −0.03‰) and +0.30 ± 0.14‰ (−0.15‰), respectively. These results confirm that the results obtained in this study are highly accurate and precise.
2.4. Water-soluble ions in SPM
Disks were cut from the filters with a 3.5-cm diameter punch, and their water-soluble ions measured. Ions were extracted from the sample filter in deionized water by ultrasonication for 60 min. The extracted solution was filtered through a 0.45-μm membrane filter (Mini Sart RC15; Sartorius Stedim) and analyzed by ion chromatography (ICS-1000; Nippon Dionex K.K., Osaka, Japan). The detection limits were comparable to those obtained in other studies (e.g., Shen et al., Citation2009). The method is described in detail by Kawashima and Kurahashi (Citation2011).
3. Results and discussion
3.1. SPM and water-soluble ions
The average SPM concentration in ambient air was 15.4 ± 6.3 μg m−3, which is lower than the Japan Environmental Standard (annual standard 24-h average: 100 μg m−3) and lower than the concentration in other regions of Japan (2008 annual average in all cities 22 μg m−3 (Environment, 2017)). For example, the average aerosol mass in Sapporo in 2008 was 25 μg m−3 (Aggarwal and Kawamura, Citation2009). This concentration is also much lower than the total suspended particulates (TSP) concentration of 230.5 μg m−3 in Shanghai, China (Wang et al., Citation2006) and the PM10 concentration of 316.2 μg m−3 in Nanjing, China (Wang et al., Citation2003). It is also lower than average SPM concentrations in other studies.
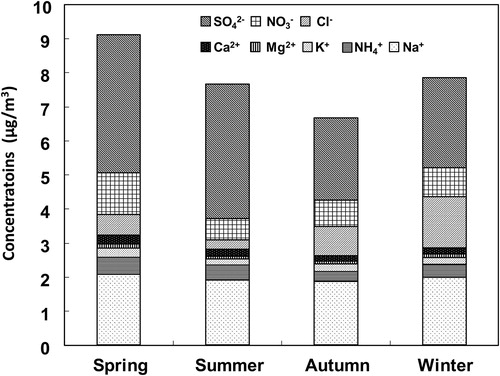
The total concentration of water-soluble ions in SPM was slightly higher in spring (March–May) than in other seasons (), in agreement with previous research (e.g., Wang et al., Citation2006). Anion concentrations decreased in the order SO42– > NO3– > Cl–, and cation concentrations in the order Na+ > NH4+ > K+ > Ca2+ > Mg2+. Sulfate is a major water-soluble ion in Japan (e.g., Kaneyasu et al., Citation1995), and concentrations of NO3– and Cl– were higher in winter (December–February) than in other seasons, apparently because particulate easily in winter (Stelson et al., Citation1979; Stelson and Seinfeld, Citation1982). NH4+ was higher in summer (June–August) and spring than in autumn (September–November) and winter. When mean total cations were plotted against mean total anions (not shown), the slope (i.e., the inorganic cation: anion balance) was 0.934 (R2 = 0.72); this result seems reasonable.
Fig. 1. Concentrations of water-soluble ions in SPM sampled at Akita Prefectural University during spring (March–May), summer (June–August), autumn (September–November), and winter (December–February) between April 2008 and December 2010.
3.2. Nitrogen isotope ratios in ammonia gas and particulate ammonium
3.2.1. Particulate ammonium
A total of 78 SPM samples were collected at Akita Prefectural University for δ15N-NH4+ measurements from April 2008 to December 2010. In these samples, δ15N-NH4+ ranged from 1.3‰ to 38.5‰ (average 16.9‰) (, ). Although Kawashima and Kurahashi (Citation2011) could not detect a clear δ15N-NH4+ trend in the SPM samples collected from April 2008 to November 2009, over the two and a half year period studied here, a seasonal trend was detected. Specifically, δ15N-NH4+ values in SPM were slightly lower in winter (11.7 ± 7.0‰) and higher in the summer (18.0 ± 7.0‰) (p < 0.01). By comparison, Moore (Citation1977) reported that the average δ15N-NH4+ value in TSP sampled in Boulder, Colorado, USA, was 5.6 ± 5.5‰, and Heaton (1987) reported a δ15N-NH4+ value in dry deposition in Pretoria, South Africa, of 2.3‰ (range −3.1‰ to 6.4‰) sampled from October 1984 to March 1985. Yeatman et al. (Citation2001b) reported δ15N-NH4+ values in TSP sampled from June 1996 to May 1997 in a farming area (Weybourne) and a town (Mace Head) in England of 6 ± 6‰ (1–22‰) and −9 ± 8‰ (−20‰ to 22‰), respectively. In Gosan, Jeju Island, Korea, δ15N-NH4+ values in TSP ranged from 4‰ to 32.2‰ (median 17.4 ± 4.9‰) from April 2003 to April 2004 (Kundu et al. (Citation2010). In Niigata Prefecture, Japan, δ15N-NH4+ values in TSP ranged from 12.2‰ to 39.6‰ (average 22.1 ± 8.3‰) during March–October 2002 (Hayasaka et al., Citation2004). In addition, δ15N-NH4+ in size-segregated particles sampled in Beijing, China, ranged from −37.1‰ to 5.8‰ during January 2002 (Pan et al., Citation2016). Although δ15N-NH4+ values determined in this study were higher than the values reported by Moore (Citation1977), Heaton (Citation1987), and Yeatman et al. (Citation2001b), they were similar to those reported by Kundu et al. (Citation2010) and Hayasaka et al. (Citation2004). The sampling site of Hayasaka et al. (Citation2004), in particular, was in a typical Japanese rural area near a rice paddy and the sea, similar to the sampling site in this study, and both rice paddies and the sea are NH3 emission sources (Barrett, Citation1998; Das et al., Citation2009).
Fig. 2. Variations of (a) δ15N-NH4+ values and NH4+ concentrations, and (b) δ15N-NO3– values and NO3– concentrations in samples collected at Akita Prefectural University from April 2008 to December 2010.
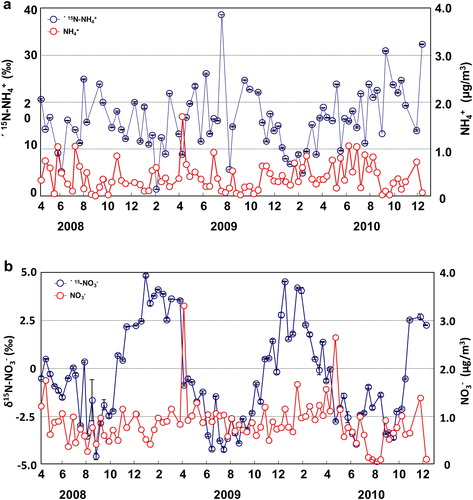
Table 1. Seasonal concentration (± S.D.) data for NH3 and NH4+, the NH3/NH4+ ratio, δ15N-NH3, and δ15N-NH4+, and the NH3–NH4+ fractionation factor (εNH3–NH4+) for samples collected at Akita Prefectural University from December 2009 to December 2010.
The mean NH4+ concentration in the SPM samples was 0.40 ± 0.31 μg m−3 (, ), and it tended to be slightly higher in spring and summer (0.50 μg m−3 and 0.43 μg m−3, respectively) than in autumn and winter (0.28 μg m−3 and 0.37 μg m−3, respectively). Hayasaka et al. (Citation2004) reported a similar seasonal distribution of NH4+ concentrations in TSP samples in Niigata Prefecture.
3.2.2. Ammonia gas
A total of 20 gas samples were collected at Akita Prefectural University for δ15N-NH3 measurement from December 2009 to November 2010. In these samples, δ15N-NH3 ranged from −33.6‰ to −0.0‰ (average −16.9‰) (, ). By comparison, Hayasaka et al. (Citation2004) reported that δ15N-NH3 ranged from −14.5‰ to −1.0‰ (average −8.3‰) collected in Niigata Prefecture, Japan, during March–October 2002. In addition, the δ15N-NH3 of gas samples collected using a passive air sampler at nine sites in the United States ranged from −42.4‰ to +7.1‰ (annual average −15.1 ± 9.7‰; n = 86) (Felix et al. (Citation2017)).
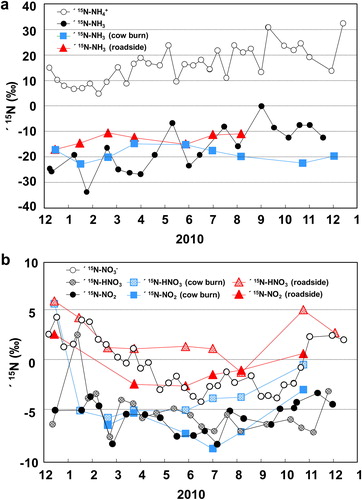
Fig. 3. Variations from December 2009 to December 2010 of (a) δ15N-NH4and δ15N-NH3 in ambient air and at the cow barn site; (b) δ15N-NO3–, δ15N-NOx, and δ15N-HNO3 (including HONO) in ambient air and δ15N-NOx and δ15N-HNO3 (including HONO) at the cow barn and roadside sites.
The δ15N-NH3 values measured in this study are somewhat lower than those reported by Hayasaka et al. (Citation2004), whereas they are in agreement with those reported by Felix et al. (Citation2017). Hayasaka et al. (Citation2004) collected samples only from spring to autumn, which may account for their values being higher than those in this study, because δ15N-NH3 values of the gas samples collected at Akita Prefectural University, similar to the δ15N-NH4+ values of SPM, tended to be higher in summer and lower in winter (0.05 < p < 0.10) ().
As the artifact for sampling collection, according to the recent study of Savard et al. (Citation2017), the isotope fractionation occurs when the ammonium nitrate particles are gasified. The δ15N-HNO3 and δ15N-NH3 decrease and the values for δ15N-NO3− and δ15N-NH4+ increase during gasified. In summer when the temperature rises, the δ15N-NH4+ might become higher if gasified. Thus, the reason of the trend was possible that the particles were gasified. However, the δ15N-NH3 also became higher in summer and lower in winter as the similar trend for δ15N-NH4+, so it is not likely that the particles gasified made a tendency. In addition, NH4+ in this study has a very high correlation with SO42− (R2 = 0.86), and NO3- (R2 = 0.36) is hardly formed, and it is difficult to think that it is decomposed (Kundu et al. (Citation2010). Thus, the artifact from aerosol to gas should not be important in this research.
The average concentration of NH3 gas sampled at Akita Prefectural University was 3.36 ± 3.05 μg m−3 (range 0.69–10.97 μg m−3) (). By comparison, Hayasaka et al. (Citation2004) reported slightly lower ammonia concentrations (1.65 ± 0.42 μg m−3; range 0.81–2.79 μg m−3) in Niigata Prefecture during March–October 2002. NH3 concentrations in this study were higher in spring and summer and lower in autumn and winter, and this seasonal trend was clearer for NH3 gas than was the case for NH4+ in SPM (see Section 3.2.1). In general, the atmospheric NH3 concentrations increase in warmer seasons and decrease in colder seasons (e.g., Okita and Kanamori, Citation1971; Georgii and Müller, Citation1974; Walker et al., Citation2004), so the result reported herein is very reasonable.
3.2.3. Ammonia gas at source sites
At the cow barn site in Yurihonjo City and the roadside site in Akita City, δ15N-NH3 ranged from −22.8‰ to −14.8‰ (average −18.8‰) and from −17.0‰ to −10.5‰ (average −13.1‰), respectively (). No seasonal trend was detected at either source location. By comparison, Heaton (Citation1987) reported values of −15.2‰ and −8.9‰ for a sheep shed and a chicken shed, respectively, and Freyer (1978) measured a δ15N-NH3 value of −8.4 ± 3.0‰ (range −12.6‰ to 4.4‰) for a cow shed, and one of −6.1 ± 1.6‰ (−7.2‰ to −4.3‰) near a coal combustion site. Felix et al. (Citation2013) reported δ15N-NH3 values for vehicle exhaust of –4.6‰ and –2.2‰ (n = 2), emissions from a power plant equipped with a selective catalytic reduction system of –11.3‰ and –14.6‰ (n = 2), animal waste of –33.1 ± 11.8‰ (n = 7), and volatilized fertilizer of –48.0‰ to –36.3‰ (n = 6). These results suggest that in general industrial emission sources may be slightly higher than agricultural sources. However, δ15N-NH3 values measured at three coal-fired power plants ranged from −38.0‰ to −21.1‰ (average −25.5‰) (Savard et al., Citation2017). Thus, because of the small sample sizes, industrial and agricultural sources do not show a clear difference.
3.2.4. Identification of ammonia gas and particulate ammonium sources and isotope fractionation during the gas-to-aerosol transformation
As described in section 3.2.2, δ15N-NH3 values detected in summer were slightly higher than those measured in winter. This difference can be attributed only to source differences, because isotope fractionation does not need to be considered. In addition, the NH3/NH4+ ratio of 9.0 indicated that the ambient atmosphere was enriched in NH3 in all seasons. Because no clear differences in δ15N-NH3 were detected among sources (see section 3.2.3), other unmeasured sources must exist.
The seasonal trend of δ15N-NH4+ in aerosols may reflect three effects: first, the effect of temperature on chemical reactions and the NH3 concentration level; second, seasonal effects on isotope fractionation; and third, the effect of different δ15N-NH3 sources. These effects, however, are not necessarily independent; for example, temperature differs seasonally, but sources may also differ seasonally and thus would be associated with different temperatures.
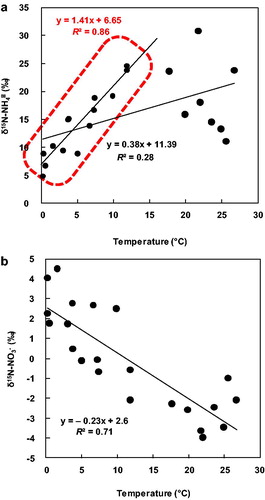
The correlation between δ15N-NH4+ in SPM and ambient temperature in all data () was very weak (R2 [coefficient of determination] = 0.28; slope = 0.38), so temperature alone cannot account for the seasonal trend. However, the correlation was much stronger for data collected at ambient temperatures from 0 to 15 °C (R2 = 0.86; ). This result suggests that factors such as source differences and isotope fractionation had more effect at ambient temperatures >15 °C.
Fig. 4. Scatter plots between (a) δ15N-NH4+ and air temperature, and (b) δ15N-NO3–and air temperature at Akita Prefectural University based on data from December 2009 to December 2010.
Isotope fractionation during the chemical transformation from NH3 gas to NH4+ in particulates can be estimated from field measurements, data collected in laboratory experiments, or by theoretical calculations. In this study, the annual mean isotope fractionation (εNH3–NH4+) based on field measurements was +33.3‰, with seasonal means of +37.4‰ (spring), +33.8‰ (summer), +28.9‰ (autumn), and +33.9‰ (winter) (). By contrast, isotope fractionation during the gas-to-aerosol transformation ranged from +19.3‰ to +48.7‰ (average +30.4‰) in Niigata, Japan (Hayasaka et al., Citation2004), and averaged +15.6‰ in Boulder, Colorado, USA (Moore, Citation1977). In laboratory tests, Heaton et al. (Citation1997) obtained an isotopic enrichment factor of +33‰ for isotope fractionation during the transformation of NH3 gas to (NH4)2SO4 particles. In addition, theoretical calculations predict an isotope fractionation factor of +39‰ at 0 °C and +35‰ at 25 °C for the transformation of NH3 to particulate NH4+ (Urey, Citation1947). Recently, Walters et al. (Citation2019) was estimated that Δδ15N were 34‰ (5 °C), 31‰ (20 °C) and 29‰ (40 °C) (in calculation) under equilibrium isotope exchange using computational quantum chemistry methods. Thus, the isotope fractionation factors obtained in this study are consistent with the Niigata data (Hayasaka et al., Citation2004), the laboratory test results (Heaton et al., Citation1997), and the theoretically calculated values (Urey, Citation1947; Walters et al., Citation2019). On the other hand, the Δδ15N by Moore (Citation1977) (15.6‰) was lower than other researches. The molar amounts of NH3(g) against NH4+(p) by Moore (Citation1977) (0.42) was poor than Hayasaka et al. (Citation2004) (7.5 ± 5.8) and this study.
In general, the kinetic isotope effect initially causes light 14NH3 to be preferentially transformed into NH4+ in aerosols because molecules containing heavy 15N have stronger bonds than those that include light 14N. Over time, heavy 15N is incorporated into NH4+ in aerosols if isotopic equilibrium between the gas and particles is reached. Thus, δ15N-NH4+ in aerosols is initially lower than gaseous δ14N-NH3. If the atmospheric concentration of NH3 is high, then isotopic equilibrium is eventually achieved, and the aerosol is likely to contain some heavy 15NH4+. Conversely, when the atmospheric NH3 concentration is low, all NH3 is consumed before equilibrium is reached; as a result, the kinetic isotope effect is dominant.
In this research, the ratio of NH3 gas to NH4+ in SPM was higher in spring (11.3) and summer (13.6) and lower in autumn (5.5), and winter (5.1) (). These results suggest that in spring and summer, the atmospheric NH3 concentration was relatively higher and δ15N-NH4+ in SPM reflected isotopic equilibrium conditions. Conversely, in winter, the atmospheric NH3 concentration was relatively lower owing to the absence of natural sources, so δ15N-NH4+ in SPM reflected non-equilibrium conditions. In addition, δ15N-NH4+ values in SPM probably reflect the kinetic isotope effect as well. Together, these considerations can explain the higher δ15N-NH4+ values in SPM in spring and summer and the lower values in autumn and winter.
The isotope fractionation factor becomes larger with decreasing temperature and smaller with increasing temperature (Urey, Citation1947; Heaton et al., Citation1997; Savard et al., Citation2017). This fact implies that the seasonal trend of δ15N-NH4+ in this study (slightly lower in winter and higher in summer) cannot be explained only by simple equilibrium reactions.
3.3. Nitrogen isotope ratios of particulate nitrate and nitrogen dioxide and nitric acid gases
3.3.1. Particulate nitrate
δ15N-NO3− values of 87 SPM samples collected at Akita Prefectural University from April 2008 to December 2010 ranged from −4.6‰ to 4.8‰ (average −0.5‰) (, ). By comparison, δ15N-NO3− averages in PM sampled at Weybourne and Mace Head, UK, from June 1996 to May 1997 were 7 ± 6‰ and −1 ± 3‰, respectively (Yeatman et al., Citation2001a); Heaton (Citation1987) reported an average value of 6.2 ± 4.3‰ in Pretoria, South Africa, for November 1984 to March 1985; Freyer (Citation1991) reported an average value of 5.2 ± 3.1‰ in Julich, Germany, for summer 1978 to autumn 1980; and the average δ15N-NO3− value in PM sampled in Boulder, Colorado, USA, was 5.6 ± 5.9‰ (Moore (Citation1977). Although the values obtained in this study are slightly lower overall than those obtained by these other studies, they are very similar to the Mace Head values. In this study, a seasonal trend of δ15N-NO3− in SPM was clearly detected; δ15N-NO3− was obviously lower in summer (−2.5 ± 1.4‰) and higher in winter (3.1 ± 1.1‰) (p < 0.01); this trend is opposite to that of δ15N-NH4+ in PM. Yeatman et al. (Citation2001a) described the same seasonal trend for δ15N-NO3− in Weybourne, UK (0 ± 2‰ in summer and 9 ± 5‰ in winter), and Freyer (1991) also reported lower δ15N-NO3− values in PM in summer and higher values in winter. As the artifact for sampling collection in this study, the tendency for δ15N-NO3− was reversed as the temperature. Thus, even if the particles including NO3− after sampling were gasified, it seems that there seemed to be other reasons or little reason.
Table 2. Seasonal concentration (±S.D.) data for NO2, HNO3 and NO3–, the NO2/HNO3 and HNO3/NO3– ratios, δ15N-NO2, δ15N-NO3, δ15N-NO3–, and the fractionations factors (ε) for NO2 to HNO3, HNO3 to NO3–, and NO2 to NO3– for samples collected at Akita Prefectural University from December 2009 to December 2010. HNO3 is including HONO.
In this study, the mean NO3– concentration in SPM was 0.86 ± 0.46 μg m−3 (, ), and it was higher in spring and winter than in the other seasons. Thus, NO3– and δ15N-NO3− in SPM showed different seasonal trends. By comparison, Wang et al. (Citation2006) reported a similar seasonal trend for NO3– in TSP in Shanghai, China.
3.3.2. Nitrogen dioxide and nitric acid gases
δ15N values of NO2 and HNO3, the gaseous precursors of NO3− in SPM, ranged from –8.2‰ to –3.1‰ (average −5.4‰) for δ15N-NO2 and from −7.5‰ to 2.7‰ (average −5.0‰) for δ15N-HNO3 (, ). By comparison, δ15N-HNO3 was determined to be ∼−2.5‰ in Julich, Germany, from summer 1978 to autumn 1980 (Freyer, Citation1978). Although both averages for δ15N-NO2 and δ15N-HNO3 in this study gas were slightly lower in summer (−6.4 ± 1.3‰ and −6.2 ± 0.8‰, respectively) and higher in winter (−5.1 ± 1.8‰ and −3.5 ± 3.9‰, respectively), no significant statistical differences were described between summer and winter (p > 0.1). In addition, Freyer (Citation1991) did not report any seasonal trend of δ15N-HNO3 in the data from Julich, Germany. In this study NO2 and HNO3 concentrations were 1.27 ± 1.75 μg m−3 (0.17–8.11 μg m−3) and 0.81 ± 0.67μg m−3 (0.22–2.65 μg m−3), respectively, and they were higher in summer (NO2, 3.18 ± 2.79 μg m−3; HNO3, 1,83 ± 0.67 μg m−3) than in winter (NO2, 0.34 ± 0.11 μg m−3; HNO3, 0.38 ± 0.18 μg m−3).
3.3.3. Gaseous nitrogen dioxide and nitric acid at source locations
The δ15N-NO2 values at the cow barn and roadside sites ranged from −8.7‰ to −2.8‰ (average −6.2‰) and from −2.4‰ to 2.8‰ (average −0.48‰), respectively (), whereas δ15N-HNO3 values at the cow barn and roadside sites ranged from −5.6‰ to 5.9‰ (average −2.7‰) and from −1.0‰ to 6.1‰ (average 2.6‰), respectively (). δ15N-NO2 was not measured at the cow barn in winter, because it is difficult to analyze filters coated with triethanolamine at low temperatures (Okita et al., Citation1983; Dahal and Hastings, Citation2016). Although δ15N-HNO3 values at the cow barn site showed a small seasonal trend, the values in winter may have been affected by vehicle emissions because no emissions from natural sources are expected in winter. Furthermore, δ15N-HNO3, and the δ15N-NO2 values from samples collected at the roadside in summer likely reflect agricultural sources as well as vehicle emissions. Thus, δ15N-HNO3 and δ15N-NO2 values obtained from the cow barn in summer and from the roadside in winter are suitable for source evaluation. Heaton (Citation1990) reported that δ15N-NOx of combustion products differ greatly depending on the temperature of combustion: at combustion temperatures above 2000 °C (e.g., in vehicle engines), δ15N-NOx values range from −13‰ to −2‰, and at combustion temperatures under 1300 °C (e.g., coal combustion, home heating), they range from 6‰ to 13‰. In addition, Bowman (Citation1975) and Hayhurst and Vince (Citation1980) reported kinetic variations in the formation and destruction of nitrogen oxides that depended on combustion temperature. Felix et al. (Citation2012) also reported positive δ15N-NOx values in emissions from coal-fired power plant stacks, whereas Walters et al. (Citation2015b) reported δ15N-NOx values ranging from −28.1‰ to 8.5‰ in different exhaust gas samples; the tendency toward negative values in their results is attributable to the kinetic isotope effect. In addition, δ15N-NOx values from fossil-fuel combustion sources equipped with selective catalytic reducers are relatively higher. Both NO and NO2 are emitted from fertilizer-amended soil (Slemr and Seiler (Citation1984). Li and Wang (Citation2008) reported that in soil emissions due to bacterial activity, δ15N-NO ranged from −49‰ to −20‰ for fertilizer and from −49‰ to −28‰ for urea, and Yu and Elliott (Citation2017) reported δ15N-NO values in soil emissions ranging from −59.8‰ to −23.4‰. In summary, combustion emissions are heavy δ15N-NO sources, vehicles emissions are middle-range δ15N-NO sources, and agricultural emissions are sources of light δ15N-NO.
3.3.4. Identification of nitrogen dioxide gas and particulate nitrate sources and isotope fractionation during the gas-to-aerosol transformations
The isotope fractionation factor for the transformation from NO2 gas to HNO3 gas (εNO2–HNO3) was ∼+0.5‰, and that for the transformation from HNO3 gas to NO3– in SPM (εHNO3–NO3) was ∼+4.9‰ (, ). As the chemical reactions progressed, δ15N in SPM became steadily heavier. These results are consistent with theoretical calculations for these reactions (Walters and Michalski, Citation2015). Isotope fractionation from gas to gas was smaller than that from gas to aerosol. By contrast, isotope fractionation between HNO3 and NO3– in PM was +8.9‰ (+6.7‰ to +11.9‰) (calculated by Freyer (Citation1991), larger than the value obtained in this study, possibly because Freyer (Citation1991) used a low-volume technique to obtain the isotope data; therefore, some HNO3 may have been volatilized, with the result that δ15N values of the NO3– were higher. In addition, isotope fractionation from NO2 to HNO3 in the source samples was +2.4‰ for the cow barn and +2.6‰ for the roadside, larger than the isotope fractionation calculated for ambient data (+0.4‰). It is possible that at the source sites, the kinetic isotope effect was dominant because equilibrium was not reached due to a low NO2/HNO3 ratio.
At the Akita Prefectural University, δ15N-NO3− in SPM showed a clear seasonal trend (). Freyer (Citation1991) suggested three possible reasons for a seasonal trend in δ15N-NO3−: (1) anthropogenic and natural NOx sources may vary among the seasons; (2) the isotope exchange equilibrium between atmospheric nitrogen oxide species may be temperature dependent; and (3) there may be seasonal variations in the formation mechanisms of particulate nitrate. With regard to a possible temperature effect on δ15N-NO3− in SPM, the correlation between δ15N-NO3− in SPM and temperature was very strong (R2 = 0.71, slope = −0.23) () and opposite in sign to the trend between δ15N-NH4+ in SPM at temperatures under 15 °C (see Section 3.2.4). Furthermore, Freyer (Citation1991) obtained a similar coefficient of determination for this relationship. However, this result may be due to a temperature effect on isotope fractionation or it may reflect different sources depending on the season. In general, the precursors of NO3− in aerosols (NO, NO2, NOx, and HNO3) are emitted during combustion (e.g., Galloway et al., Citation2004) and are likely to increase in winter as a result of domestic heating. Therefore, it is difficult to isolate the effect of temperature, though it is likely to be an important factor. Freyer (Citation1991) suggested that the seasonal trend in winter of NO3− in aerosols is due to the second process, which has low temperature dependence. With regard to the source of δ15N-NO3− in SPM, the dominant source of NO3− in SPM is generally NO2 from combustion. As summarized in Section 3.3.3, the δ15N-NO from combustion sources is high, that from vehicle emissions is intermediate, and that from natural sources is low. In this study, annual δ15N-NO2 values primarily reflected NOx vehicle emissions, so the baseline value could be considered to be intermediate. In summer, NO emissions due to bacterial activity would decrease the baseline because δ15N-NO from bacterial emissions is very low. In winter, the greater prevalence of emission sources such as coal combustion and domestic heating would increase the baseline, because δ15N-NOx produced by combustion at low temperatures is very heavy. These source changes might cause there to be a slight seasonal trend in δ15N-NOx. Then, the seasonal trend of δ15N-NO3− in SPM might be stronger than that in δ15N-NOx because of the seasonal trend in isotope fractionation.
4. Conclusions
δ15N-NH4+ and δ15N-NO3− in SPM were investigated in Akita Prefecture, Japan, from April 2008 to December 2010 to analyze seasonal trends and the sources of their precursors. The main results and conclusions from this work are as follows:
δ15N-NH4+ in SPM ranged from 1.3‰ to 38.5‰ (average 16.1‰), whereas δ15N-NH3 gas ranged from −33.6‰ to −0.0‰ (average −16.9‰). δ15N-NH4+ in SPM was slightly higher in summer and lower in winter. The ratio of NH3 gas to NH4+ in SPM was higher in summer (13.6) than in other seasons, and the NH3 pool in the atmosphere was large; therefore, δ15N-NH4+ in SPM reflected equilibrium conditions. Conversely, in winter, the ratio of NH3 gas to NH4+ in SPM was lower (5.1) owing to the absence of natural sources of NH3, and the NH3 pool in the atmosphere was small. Thus, δ15N-NH4+ in SPM might reflect non-equilibrium conditions. In addition, the transformation of NH3 to NH4+ in SPM might partly reflect the kinetic isotope effect.
δ15N-NO3− in SPM ranged from −4.6‰ to 4.8‰ (average −0.5‰), whereas δ15N-NO2 gas and δ15N-HNO3 gas ranged from –8.2‰ to –3.1‰ (average −5.4‰) and from −7.5‰ to 2.7‰ (average −5.0‰), respectively. δ15N-NO3− in SPM was obviously lower in summer and higher in winter, opposite to the trend of δ15N-NH4+ in SPM. This seasonal trend is attributable to seasonal differences in NOx sources, whether equilibrium conditions were reached, and whether there were seasonal variations in formation mechanisms. The annual δ15N-NOx value in this study primarily reflected NOx in vehicle emissions and can be used as a baseline. In summer, NO emitted by bacterial activity decreased the baseline because the δ15N-NO from bacteria is very low. In winter, emission sources such as coal combustion and home heating became more prevalent and increased the baseline.
Mean annual isotope fractionation from NH3 gas to NH4+ in SPM in the ambient environment was +33.3‰. The fractionation factor from NH3 gas to NH4+ in SPM calculated in this study is consistent with previous research. Isotope fractionation from NH3 gas to NH4+ in SPM was +37.4‰ in spring, +33.8‰ in summer, +28.9‰ in autumn, and +33.9‰ in winter. Isotope fractionation from NO2 to HNO3 and from HNO3 to NO3– in SPM was ∼+0.5‰ and +4.9‰, respectively. As the chemical reactions progressed, the δ15N became steadily higher. Isotope fractionation from gas to gas was smaller than that from gas to aerosol. These isotope fractionation factors were calculated from measurement data obtained simultaneously.
Acknowledgements
Takahiro Kurahashi and Yuya Haneishi at Akita Prefectural University contributed greatly, including conducting sampling and participating in discussions related to this research. Dr. Sakata Masahiro of the University of Shizuoka helped with the distillation of ammonia and nitrate in particulate matter. The author offers sincere thanks to all of these people.
Additional information
Funding
References
- Aggarwal, S. G. and Kawamura, K. 2009. Carbonaceous and inorganic composition in long-range transported aerosols over northern Japan: Implication for aging of water-soluble organic fraction. Atmos. Environ. 43, 2532–2540. doi:10.1016/j.atmosenv.2009.02.032
- Akata, N. and Yanagisawa, F. 2002. Sulfur isotope ratio of non-sea salt sulfate in bulk deposition and aerosol. Earozoru Kenkyu 17, 247–251.
- Barrett, K. 1998. Oceanic ammonia emissions in Europe and their transboundary fluxes. Atmos. Environ. 32, 381–391. doi:10.1016/S1352-2310(97)00279-3
- Bowman, C. T. 1975. Kinetics of pollutant formation and destruction in combustion. Prog. Energy Combust. Sci. 1, 33–45. doi:10.1016/0360-1285(75)90005-2
- Brunekreef, B. and Holgate, S. T. 2002. Air pollution and health. Lancet 360, 1233–1242. doi:10.1016/S0140-6736(02)11274-8
- Casciotti, L. K., Sigman, D., Hastings, M., Bohlke, J. and Hilkert, A. 2002. Measurement of the oxygen isotopic composition of nitrate in seawater and freshwater using the denitrifier method. Anal. Chem. 74, 4905–4912. doi:10.1021/ac020113w
- Dahal, B. and Hastings, M. G. 2016. Technical considerations for the use of passive samplers to quantify the isotopic composition of NOx and NO2 using the denitrifier method. Atmos. Environ. 143, 60–66. doi:10.1016/j.atmosenv.2016.08.006
- Das, P., Sa, J. H., Kim, K. H. and Jeon, E. C. 2009. Effect of fertilizer application on ammonia emission and concentration levels of ammonium, nitrate, and nitrite ions in a rice field. Environ. Monit. Assess. 154, 275–282. doi:10.1007/s10661-008-0395-2
- Dasch, J. M., Cadle, S. H., Kennedy, K. G. and Mulawa, P. A. 1989. Comparison of annular denuders and filter packs for atmospheric sampling. Atmos. Environ. 23, 2775–2782. doi:10.1016/0004-6981(89)90558-1
- Elliott, E. M., Kendall, C., Boyer, E. W., Burns, D. A., Lear, G. G. and co-authors. 2009. Dual nitrate isotopes in dry deposition: Utility for partitioning NOx source contributions to landscape nitrogen deposition. J. Geophys. Res. 114, G04020.
- Elliott, E. M., Yu, Z., Cole, A. S. and Coughlin, J. G. 2019. Isotopic advances in understanding reactive nitrogen deposition and atmospheric processing. Sci. Total Environ. 662, 393–403. doi:10.1016/j.scitotenv.2018.12.177
- Environment, M. o. t 2017. Annual Report on Air Pollution Condition.
- Felix, J. D. and Elliott, E. M. 2014. Isotopic composition of passively collected nitrogen dioxide emissions: Vehicle, soil and livestock source signatures. Atmos. Environ. 92, 359–366. doi:10.1016/j.atmosenv.2014.04.005
- Felix, J. D., Elliott, E. M., Gish, T. J., McConnell, L. L. and Shaw, S. L. 2013. Characterizing the isotopic composition of atmospheric ammonia emission sources using passive samplers and a combined oxidation-bacterial denitrifier approach. Rapid Commun. Mass Spectrom. 27, 2239–2246. doi:10.1002/rcm.6679
- Felix, J. D., Elliott, E. M. and Gay, D. A. 2017. Spatial and temporal patterns of nitrogen isotopic composition of ammonia at U.S. ammonia monitoring network sites. Atmos. Environ. 150, 434–442. doi:10.1016/j.atmosenv.2016.11.039
- Felix, J. D., Elliott, E. M., Gish, T., Maghirang, R., Cambal, L. and co-authors. 2014. Examining the transport of ammonia emissions across landscapes using nitrogen isotope ratios. Atmos. Environ. 95, 563–570. doi:10.1016/j.atmosenv.2014.06.061
- Felix, J. D., Elliott, E. M. and Shaw, S. L. 2012. Nitrogen isotopic composition of coal-fired power plant NOx: Influence of emission controls and implications for global emission inventories. Environ. Sci. Technol. 46, 3528–3535. doi:10.1021/es203355v
- Fibiger, D. L. and Hastings, M. G. 2016. First measurements of the nitrogen isotopic composition of NOx from biomass burning. Environ. Sci. Technol. 50, 11569–11574. doi:10.1021/acs.est.6b03510
- Freyer, H. D. 1978. Seasonal trends of NH4+ and NO3− nitrogen isotope composition in rain collected at Jülich, Germany. Tellus 30, 83–92.
- Freyer, H. D. 1991. Seasonal variation of 15N/14N ratios in atmospheric nitrate species. Tellus B 43, 30–44. doi:10.3402/tellusb.v43i1.15244
- Freyer, H. D., Kley, D., Volz-Thomas, A. and Kobel, K. 1993. On the interaction of isotopic exchange processes with photochemical reactions in atmospheric oxides of nitrogen. J. Geophys. Res. 98, 14791–14796. doi:10.1029/93JD00874
- Galloway, J. N., Dentener, F. J., Capone, D. G., Boyer, E. W., Howarth, R. W. and co-authors. 2004. Nitrogen cycles: Past, present, and future. Biogeochemistry 70, 153–226. doi:10.1007/s10533-004-0370-0
- Georgii, H. W. and Müller, W. J. 1974. On the distribution of ammonia in the middle and lower troposphere. Tellus 26, 180–184.
- Harrison, R. M. and Kitto, A. M. N. 1990. Field intercomparison of filter pack and denuder sampling methods for reactive gaseous and particulate pollutants. Atmos. Environ. 24, 2633–2640. doi:10.1016/0960-1686(90)90142-A
- Hastings, M. G., Casciotti, K. L. and Elliott, E. M. 2013. Stable isotopes as tracers of anthropogenic nitrogen sources, deposition, and impacts. Elements 9, 339–344. doi:10.2113/gselements.9.5.339
- Hayami, H. and Fujita, S. 2004. Concentrations and gas-aerosol partitioning of semi-volatile inorganic species measured with denuder/filter-pack sampling system in Tokyo. J. Jpn. Soc. Atmos. Environ. 39, 77–88.
- Hayasaka, H., Fukuzaki, N., Kondo, S., Ishizuka, T. and Totsuka, T. 2004. Nitrogen isotopic ratios of gaseous ammonia and ammonium aerosols in the atmosphere. J. Jpn. Soc. Atmos. Environ. 39, 272–279.
- Hayhurst, A. N. and Vince, I. M. 1980. Nitric oxide formation from N2 in flames: The importance of “prompt” NO. Prog. Energy Combust. Sci. 6, 35–51. doi:10.1016/0360-1285(80)90014-3
- Heaton, T. H. E. 1986. Isotopic studies of nitrogen pollution in the hydrosphere and atmosphere: A review. Chem. Geol. 59, 87–102. doi:10.1016/0168-9622(86)90059-X
- Heaton, T. H. E. 1987. 15N14N ratios of nitrate and ammonium in rain at Pretoria, South Africa. Atmos. Environ. 21, 843–852. doi:10.1016/0004-6981(87)90080-1
- Heaton, T. H. E. 1990. 15N/14N ratios of NOx from vehicle engines and coal-fired power stations. Tellus B 42, 304–307.
- Heaton, T. H. E., Spiro, B. and Robertson, S. M. C. 1997. Potential canopy influences on the isotopic composition of nitrogen and sulphur in atmospheric deposition. Oecologia 109, 600–607. doi:10.1007/s004420050122
- Hoek, G., Brunekreef, B., Goldbohm, S., Fischer, P. and van den Brandt, P. A. 2002. Association between mortality and indicators of traffic-related air pollution in the Netherlands: A cohort study. Lancet 360, 1203–1209. doi:10.1016/S0140-6736(02)11280-3
- Hoering, T. 1957. The isotopic composition of the ammonia and the nitrate ion in rain. Geochim. Cosmochim. Acta. 12, 97–102. doi:10.1016/0016-7037(57)90021-2
- Japan Ministry of the Environment. 2018. Air quality standard. Online at: http://www.env.go.jp/kijun/taiki.html.
- Japanese Industrial Standards Committee 1998. JIS K 0102, Testing method for industrial wastewater, Tokyo.
- Kaneyasu, N., Ohta, S. and Murao, N. 1995. Seasonal variation in the chemical composition of atmospheric aerosols and gaseous species in Sapporo, Japan. Atmos. Environ. 29, 1559–1568. doi:10.1016/1352-2310(94)00356-P
- Kawashima, H. and Kurahashi, T. 2011. Inorganic ion and nitrogen isotopic compositions of atmospheric aerosols at Yurihonjo, Japan: Implications for nitrogen sources. Atmos. Environ. 45, 6309–6316. doi:10.1016/j.atmosenv.2011.08.057
- Kundu, S., Kawamura, K. and Lee, M. 2010. Seasonal variation of the concentrations of nitrogenous species and their nitrogen isotopic ratios in aerosols at Gosan, Jeju Island: Implications for atmospheric processing and source changes of aerosols. J. Geophys. Res. Atmos. 115, D20305. doi:10.1029/2009JD013323
- Li, D. and Wang, X. 2008. Nitrogen isotopic signature of soil-released nitric oxide (NO) after fertilizer application. Atmos. Environ. 42, 4747–4754. doi:10.1016/j.atmosenv.2008.01.042
- Matsumoto, K., Uyama, Y., Hayano, T., Tanimoto, H., Uno, I. and co-authors. 2003. Chemical properties and outflow patterns of anthropogenic and dust particles on Rishiri Island during the Asian Pacific Regional Aerosol Characterization Experiment (ACE‐Asia). J. Geophys. Res. Atmos. 108, 8666. doi:10.1029/2003JD003426
- McIlvin, M. R. and Casciotti, K. L. 2011. Technical updates to the bacterial method for nitrate isotopic analyses. Anal. Chem. 83, 1850–1856. doi:10.1021/ac1028984
- Moore, H. 1974. Isotopic measurement of atmospheric nitrogen compounds. Tellus 26, 169–174.
- Moore, H. 1977. The isotopic composition of ammonia, nitrogen dioxide and nitrate in the atmosphere. Atmos. Environ. 11, 1239–1243. doi:10.1016/0004-6981(77)90102-0
- Mukai, H., Tanaka, A., Fujii, T., Zeng, Y., Hong, Y. and co-authors. 2001. Regional Characteristics of sulfur and lead isotope ratios in the atmosphere at several Chinese urban sites. Environ. Sci. Technol. 35, 1064–1071. doi:10.1021/es001399u
- Noguchi, I., Otsuka, H., Akiyama, M., Sakai, S. and Kato, T. 2007. Measuring concentrations of nitrous acid gas by the filter-pack sampling method. J. Jpn. Soc. Atmos. Environ. 42, 162–174.
- Okita, S., Ohta, S., Fukul, M., Yatabe, H., Akei, T. and co-authors. 1983. Measurement of atomospheric NO2 concentration using filter coated with triethanol-amine. Bull. Faculty Eng. Hokkaido Univ. 113, 107–112.
- Okita, T. and Kanamori, S. 1971. Determination of trace concentration of ammonia in the atmosphere using pyridine-pyrazolone reagent. Atmos. Environ. 5, 621–627. doi:10.1016/0004-6981(71)90118-1
- Pan, Y., Tian, S., Liu, D., Fang, Y., Zhu, X. and co-authors. 2016. Fossil fuel combustion-related emissions dominate atmospheric ammonia sources during severe haze episodes: Evidence from 15N-stable isotope in size-resolved aerosol ammonium. Environ. Sci. Technol. 50, 8049–8056. doi:10.1021/acs.est.6b00634
- Pavuluri, C. M., Kawamura, K., Tachibana, E. and Swaminathan, T. 2010. Elevated nitrogen isotope ratios of tropical Indian aerosols from Chennai: Implication for the origins of aerosol nitrogen in South and Southeast Asia. Atmos. Environ. 44, 3597–3604. doi:10.1016/j.atmosenv.2010.05.039
- Pope, C. A. III, Dockery, D. W., Spengler, J. D. and Raizenne, M. E. 1991. Respiratory health and PM10 pollution: A daily time series analysis. Am. Rev. Respir. Dis. 144, 668–674. doi:10.1164/ajrccm/144.3_Pt_1.668
- Redling, K., Elliott, E., Bain, D. and Sherwell, J. 2013. Highway contributions to reactive nitrogen deposition: Tracing the fate of vehicular NOx using stable isotopes and plant biomonitors. Biogeochemistry 116, 261–274. doi:10.1007/s10533-013-9857-x
- Russell, K. M., Galloway, J. N., Macko, S. A., Moody, J. L. and Scudlark, J. R. 1998. Sources of nitrogen in wet deposition to the Chesapeake Bay region. Atmos. Environ. 32, 2453–2465. doi:10.1016/S1352-2310(98)00044-2
- Sakata, M. 2001. A simple and rapid method for δ15N determination of ammonium and nitrate in water samples. Geochem. J. 35, 271–275. doi:10.2343/geochemj.35.271
- Savard, M. M., Cole, A., Smirnoff, A. and Vet, R. 2017. δ15N values of atmospheric N species simultaneously collected using sector-based samplers distant from sources – Isotopic inheritance and fractionation. Atmos. Environ. 162, 11–22. doi:10.1016/j.atmosenv.2017.05.010
- Sharp, Z. 2017. Principles of stable isotope geochemistry, 2nd ed. https://digitalrepository.unm.edu/unm_oer/1/
- Shen, Z., Cao, J., Arimoto, R., Han, Z., Zhang, R. and co-authors. 2009. Ionic composition of TSP and PM2.5 during dust storms and air pollution episodes at Xi'an, China. Atmos. Environ. 43, 2911–2918. doi:10.1016/j.atmosenv.2009.03.005
- Sigman, D. M., Casciotti, K. L., Andreani, M., Barford, C., Galanter, M. and co-authors. 2001. A bacterial method for the nitrogen isotopic analysis of nitrate in seawater and freshwater. Anal. Chem. 73, 4145–4153. doi:10.1021/ac010088e
- Slemr, F. and Seiler, W. 1984. Field measurements of NO and NO2 emissions from fertilized and unfertilized soils. J. Atmos. Chem. 2, 1–24. doi:10.1007/BF00127260
- Stelson, A. W., Friedlander, S. K. and Seinfeld, J. H. 1979. A note on the equilibrium relationship between ammonia and nitric acid and particulate ammonium nitrate. Atmos. Environ. 13, 369–371. doi:10.1016/0004-6981(79)90293-2
- Stelson, A. W. and Seinfeld, J. H. 1982. Relative humidity and temperature dependence of the ammonium nitrate dissociation constant. Atmos. Environ. 16, 983–992. doi:10.1016/0004-6981(82)90184-6
- Takegawa, N., Kondo, Y., Koike, M., Chen, G., Machida, T. and co-authors. 2004. Removal of NOx and NOy in Asian outflow plumes: Aircraft measurements over the western Pacific in January 2002. J. Geophys. Res. Atmos. 109.
- Urey, H. C. 1947. The thermodynamic properties of isotopic substances. J. Chem. Soc. 562–581. doi:10.1039/jr9470000562
- Walker, J. T., Whitall, D. R., Robarge, W. and Paerl, H. W. 2004. Ambient ammonia and ammonium aerosol across a region of variable ammonia emission density. Atmos. Environ. 38, 1235–1246. doi:10.1016/j.atmosenv.2003.11.027
- Walters, W. W., Chai, J. and Hastings, M. G. 2019. Theoretical phase resolved ammonia–ammonium nitrogen equilibrium isotope exchange fractionations: Applications for tracking atmospheric ammonia gas-to-particle conversion. ACS Earth Space Chem. 3, 79–89. doi:10.1021/acsearthspacechem.8b00140
- Walters, W. W., Goodwin, S. R. and Michalski, G. 2015. Nitrogen stable isotope composition (δ15N) of vehicle-emitted NOx. Environ. Sci. Technol. 49, 2278–2285. doi:10.1021/es505580v
- Walters, W. W. and Hastings, M. G. 2018. Collection of ammonia for high time-resolved nitrogen isotopic characterization utilizing an acid-coated honeycomb denuder. Anal. Chem. 90, 8051–8057. doi:10.1021/acs.analchem.8b01007
- Walters, W. W. and Michalski, G. 2015. Theoretical calculation of nitrogen isotope equilibrium exchange fractionation factors for various NOy molecules. Geochim. Cosmochim. Acta. 164, 284–297. doi:10.1016/j.gca.2015.05.029
- Walters, W. W., Simonini, D. S. and Michalski, G. 2016. Nitrogen isotope exchange between NO and NO2 and its implications for δ15N variations in tropospheric NOx and atmospheric nitrate. Geophys. Res. Lett. 43, 440–448. doi:10.1002/2015GL066438
- Walters, W. W., Tharp, B. D., Fang, H., Kozak, B. J. and Michalski, G. 2015. Nitrogen isotope composition of thermally produced NOx from various fossil-fuel combustion sources. Environ. Sci. Technol. 49, 11363–11371. doi:10.1021/acs.est.5b02769
- Wang, G., Wang, H., Yu, Y., Gao, S., Feng, J. and co-authors. 2003. Chemical characterization of water-soluble components of PM10 and PM2.5 atmospheric aerosols in five locations of Nanjing, China. Atmos. Environ. 37, 2893–2902. doi:10.1016/S1352-2310(03)00271-1
- Wang, Y., Zhuang, G., Zhang, X., Huang, K., Xu, C. and co-authors. 2006. The ion chemistry, seasonal cycle, and sources of PM2.5 and TSP aerosol in Shanghai. Atmos. Environ. 40, 2935–2952. doi:10.1016/j.atmosenv.2005.12.051
- Yeatman, S. G., Spokes, L. J., Dennis, P. F. and Jickells, T. D. 2001a. Can the study of nitrogen isotopic composition in size-segregated aerosol nitrate and ammonium be used to investigate atmospheric processing mechanisms? Atmos. Environ. 35, 1337–1345. doi:10.1016/S1352-2310(00)00457-X
- Yeatman, S. G., Spokes, L. J., Dennis, P. F. and Jickells, T. D. 2001b. Comparisons of aerosol nitrogen isotopic composition at two polluted coastal sites. Atmos. Environ. 35, 1307–1320. doi:10.1016/S1352-2310(00)00408-8
- Yu, Z. and Elliott, E. M. 2017. Novel method for nitrogen isotopic analysis of soil-emitted nitric oxide. Environ. Sci. Technol. 51, 6268–6278. doi:10.1021/acs.est.7b00592