
 ?Mathematical formulae have been encoded as MathML and are displayed in this HTML version using MathJax in order to improve their display. Uncheck the box to turn MathJax off. This feature requires Javascript. Click on a formula to zoom.
Abstract
Equatorial volcanic eruptions are known to impact the atmospheric circulation on seasonal time scales through a strengthening of the stratospheric zonal winds followed by dynamic ocean-atmosphere coupling. This emerges as the positive phase of the North Atlantic Oscillation in the first 5 years after an eruption. In the North Atlantic, other modes of atmospheric circulation contribute to the climate variability but their response to volcanic eruptions has been less studied. We address this by retrieving the stable water isotopic fingerprint of the four major atmospheric circulation modes over the North Atlantic (Atlantic Ridge, Scandinavian Blocking and the negative and positive phases of the North Atlantic Oscillation (NAO − and NAO+)) by using monthly precipitation data from Global Network of Isotopes in Precipitation (GNIP) and 500 mb geo-potential height from the 20th Century Reanalysis. The simulated stable isotopic pattern of each atmospheric circulation mode is further used to assess the retrieved pattern. We test if changes in the atmospheric circulation as well as moisture source conditions as a result of volcanic eruptions can be identified by analyzing the winter climate response after both equatorial and high-latitude North Hemispheric volcanic eruptions in data, reanalysis and simulations. We report of an NAO + mode in the first two years after equatorial eruptions followed by NAO − in year 3 due to a decrease in the meridional temperature gradient as a result of volcanic surface cooling. This emerges in both GNIP data as well as reanalysis. Although the detected response is stronger after equatorial eruptions compared to high latitude eruptions, our results show that the response after high latitude eruptions tend to emerge as NAO − in year 2 followed by NAO + in year 3–4.
1. Introduction
Volcanic eruptions are an important external forcing that can influence both regional and global climate on annual to centennial time scales. This is initiated by anomalies in the Earth's radiative budget as a result of sulphate aerosols, formed when SO2 within the volcanic material ejected react with water in the atmosphere. Since these changes in radiative balance will affect the atmospheric circulation that can in turn have a strong impact on tropospheric weather, we address the important questions whether volcanic eruptions can systematically alter the main modes of climate variability and how the radiative anomalies in both the troposphere and stratosphere influences this climate response. To answer these questions, we use measurements of stable water isotopes in precipitation as well as atmospheric circulation reconstructions, where our area of interest is the North Atlantic. Due to the limited number of observed large volcanic eruptions, proxy reconstructions using stable water isotopes offer possibilities in understanding in more detail the climate response after large volcanic eruptions.
Volcanic sulphate aerosols reaching the stratosphere after major equatorial eruptions are well known for their impact on global climate (Deirmendjian, Citation1973; Toon and Pollack, Citation1980; Stenchikov, Citation2002; Robock, Citation2000). Due to their optical properties the aerosols scatter short-wave radiation causing cooling of the Earth’s surface while absorbing terrestrial long-wave radiation leading to warming of the stratosphere in the first 1–2 years after an eruption. These temperature changes can alter the atmospheric circulation resulting in some weather regimes being more frequent than others, where stable isotopes can inform on such variations. Over the past two decades the focus has mainly been on the effect of large equatorial eruptions on the atmospheric circulation. Observations (Robock and Mao, Citation1992; Graf et al., Citation1994; Kodera, Citation1994; Fischer et al., Citation2007) and reconstructions (Ortega et al., Citation2015) have shown that NAO + tends to become more frequent in the first 1–2 years after equatorial eruptions. However, recent studies using climate model (Guðlaugsdóttir et al., Citation2018) as well as reconstructions (Sjolte et al., Citation2018) show a more persistent NAO + in the first 5 years, causing warming during winter in northern Europe and Eastern part of N-America (Hurrell, Citation1995). Little is known about the effect of volcanic eruptions on the other regimes, the Atlantic Ridge (AtR) and Scandinavian Blocking (ScB). The climate impact of NH eruptions is beginning to reach the attention of the scientific community, where the long-term climate impact after NH eruptions due to ocean-atmosphere coupling has been demonstrated by Pausata et al. (Citation2015). Several studies indicate that NH eruptions can have the opposite effect on the stratospheric polar vortex and the resulting tropospheric weather regimes compared to equatorial eruptions (Graf et al., Citation1994; Oman et al., Citation2005; Guðlaugsdóttir et al., Citation2018), where NH volcanic eruptions occurring between late boreal spring and early fall are mainly considered to initiate a possible local and/or global climate impact (Oman et al., Citation2005; Kravitz and Robock, Citation2011). However, recent studies have challenged this seasonal factor underlining the need for further investigation on the climate response and how sensitive the response is regarding the seasonality of high latitude eruptions (Gettleman et al., Citation2015; Du et al., Citation2019).
Isotope records of polar ice cores have played a crucial role in reconstructing past climate, contributing significantly to the understanding of the range of natural climate variability and through this constraining the predictions of the future behavior of the climate system (Johnsen et al., Citation1997; Dansgaard et al., Citation1993; Steffensen et al., Citation2008; NEEM community members, 2013; Masson-Delmotte et al., 2013). The ratio of stable water isotopes is usually expressed using the δ notation, defined as:
where V-SMOW stands for Vienna Standard Mean Ocean Water.
The temperature-dependent stable isotopic composition of an air mass during warmer periods results in precipitation with more positive δ values compared to colder periods. This has been demonstrated in the stable water isotope records of Greenland ice cores where past changes in atmospheric circulation and temperature have been revealed (e.g. Johnsen et al., Citation2001). Similarly, the stable water isotopes of precipitation on seasonal to annual scale are also subjected to both local and regional factors, where the atmospheric circulation trajectories further contribute to the δ18O variability. Information on the regional factors is partly revealed through the d-excess,
(1)
(1)
a second order parameter that emerges as a result of non-equilibrium fractionation during, e.g. evaporation and diffusion during snow formation and is subjected to ocean conditions (Merlivat and Jouzel, Citation1979; Pfahl and Sodemann, 2013; Steen-Larsen et al., Citation2014, 2015; Aemisegger and Sjolte, Citation2018). It can therefore reflect changes in the moisture source as a result of a shift in atmospheric vapour transport.
Stable water isotopes are subjected to both internal climate variability and external forcing on synoptic to millennial timescales. Sudden changes acting on the climate system as a result of external forcing like volcanic eruptions have been recorded in the isotopes. The understanding of the behavior of stable isotopes following an external forcing event can therefore compliment the study of how the atmosphere-ocean coupling responds to volcanic eruptions.
In this study, we establish the water isotopic fingerprint associated with each of the four major modes of North Atlantic (NA) climate variability. The dominating weather regimes in the NA are the positive and negative phases of the North Atlantic Oscillation (NAO), defined as deviations from the mean (normalized) zonal pressure difference between the Icelandic Low and the Azores High. Pressure differences between these centres control the strength of the zonal wind flow (the westerlies) over the NA and therefore the climate and weather around the NA. The other two weather regimes are the AtR, also known as the positive phase of the East Atlantic (EA) pattern, and the ScB. These regimes tend to be in anti-phase with each other where the pressure centres are located just south of Greenland and over central Europe/Scandinavia. During either AtR or ScB, the wind flow is more meridional compared to during NAO and therefore also the storm track. These four weather regimes have been identified as being part of the climate variability recorded in the stable isotopes of Greenland ice cores (Ortega et al., Citation2014; Rimbu et al., Citation2017). By using the output of an isotope-enabled general circulation model (ECHAM5-wiso) and observations, Comas-Bru et al. (Citation2016) found that the EA pattern was generally uncorrelated with δ18O in precipitation over Europe. However, they found that the polarity of the EA pattern influenced the δ18O–NAO relationship. Especially when both NAO and EA pattern were positive, NAO + and AtR occurring simultaneously, the jet stream migrated northward.
By studying how equatorial (EQ) eruptions and northern high latitude (NH) eruptions influence the weather patterns together with information about the stable water isotopes in the hydrological cycle, we establish the isotopic response in precipitation immediately after volcanic eruptions.
2. Data and methods
2.1. 20th century reanalysis
The NA weather regimes were studied in the 20th Century Reanalysis V2 data (20CR). Similar to Ortega et al. (Citation2014), using the same reanalysis dataset, we identified the four weather regimes in the 500 mb gph of the 20CR dataset for the winter months (Dec, Jan, Feb) of AD 1871–2000 using K means clustering. It has been shown that for the main study period of this present work (post 1950) the Greenland temperature is well represented by 20CR (Reeves Eyre and Zeng, Citation2017), where further details on the 20CR reanalysis dataset can be obtained in Compo et al. (Citation2011). Previously, Cassou et al., (Citation2004) assessed the optimal number of cluster centroids in the SLP over the North Atlantic using NCEP-NCAR reanalysis dataset for the period 1950–2001 and found them to be 4, namely NAO+, NAO−, the positive phase of the East Atlantic pattern (AtR) and a zonal pressure dipole between Greenland and Scandinavia (ScB). Since these regimes are of interest to this study, we take advantage of this in our use of the K-means clustering where we predefine the cluster centroids to be 4 (k = 4). To identify the most stable weather regimes in the clusters, the clustering algorithm is set to 200 replications. By using this clustering method indices are provided for each month, where each regime has its own index. The indices were used to retrieve the temperature pattern at 2 m (T2m) associated with the 500 mb gph weather regimes. In the following, the first post-volcanic year (year 1) is referred to as the first winter after an eruption, year 2 the second and so forth.
2.2. Global network of isotopes in precipitation (GNIP)
Global Network of Isotopes in Precipitation (GNIP) provides monthly average, precipitation-weighted, stable isotope data (δ18O and δD) from AD 1958-present over the area of interest in this study, the North Atlantic. The GNIP stations were selected based on the indices from the reanalysis clustering in order to retrieve a δ18O pattern associated with each of the four 500mb gph weather regimes. That is, all winter months (DJF) with an index representing each of the four weather regimes according to the 500 mb gph were retrieved in the existing GNIP δ18O database around the NA. This results in an average δ18O pattern associated with each weather regime for the period 1961–1999. Anomalies in each GNIP station were calculated with respect to the mean of DJF of all data available for the period of 1961–1999 (IAEA, Citation2001). The general data quality control for the GNIP dataset follows a specified statistic criteria after a screening is performed on the data (IAEA, 1992), where the basic spatio-temporal distribution of 2H and 18O has been discussed in Rozanski et al. (Citation1993).
2.2.1. GNIP volcanic response
GNIP provides data to study the short-term atmospheric circulation response after two equatorial eruptions, namely 1982 El Chichon (Mexico) (17.45°N 93.22°W) and 1991 Pinatubo (Philippines) (15.13°N 120.35°E). The eruptive column of Pinatubo reached a maximum altitude of 40 km while the column of El Chichon reached a maximum altitude of ∼30 km (Carey and Sigurdsson, Citation1986; Holasek et al., Citation1996). Although the eruption of Agung in 1963 occurs within the timespan of the database of GNIP, only three stations had available data covering all three eruptions and we therefore chose to exclude Agung from the analysis. In total 15 stations were selected for the EQ volcanic analysis. NH summer eruptions were selected based on the criteria that no large EQ eruptions occurred at least 5 years prior to the NH eruption selected in order to avoid interference of the short-term climate impact after EQ eruptions in the interpretation of the NH eruptions. The eruptions meeting the requirements are the high latitude eruption of Hekla 1970 (Iceland) (63.59°N 19.41°W) and the mid-latitude eruption of Sarychev Peak 2009 (Russia) (48.092°N 153.20°E). The Hekla column height reached over 14 km and 11–16 km after Sarchev Peak (Thórarinsson and Sigvaldason, Citation1972; Haywood et al, Citation2010). In total 19 stations were selected for the NH volcanic analysis although only 7 stations include data for both eruptions. Again, anomalies in each GNIP station were calculated with respect to the mean of DJF of all data available for the period of 1961–1999 where the number-of-months vary between stations (IAEA, Citation2001).
d-excess was also analyzed although only fewer stations had both measured δD and δ18O available. For the EQ analysis, 10 stations were analyzed for d-excess and 15 stations for the NH analysis, where the calculation of the average NH volcanic d-excess signal is only possible in year 3 for 4 stations.
2.3. ECHAM5-wiso
We use both the 500 mb geopotential height (gph) and stable isotope (δ18O and δD) output from ECHAM5-wiso, the atmospheric component of the ECHAM5-/MPI-OM GCM with an added isotope module (Werner et al., Citation2011). The ECHAM5/MPI-OM run simulates the atmospheric conditions as well as the isotopic changes within the hydrological cycle for the period of 800–2000 CE (Sjolte et al., Citation2018). The stable isotopes are precipitation-weighted during post-processing while calculating the monthly means. This version of ECHAM5 is a low-top model that spans 19 vertical levels up to 10 hPa (lower stratosphere) and has a horizontal resolution that corresponds to ∼3.75° × 3.75° (T31). As a consequence, important stratospheric circulation modes are not well resolved in this version, like the Quasi-Biennial Oscillation (QBO). This can have implications regarding the representation of atmospheric blocking behavior and NAO (e.g. Scaife et al., Citation2010; Davini et al., Citation2017). The volcanic forcing time series implemented in ECHAM5-wiso are from Crowley et al. (Citation2008) where the implementing method follows Jungclaus et al. (Citation2010). The volcanic forcing is specified as aerosol optical depth (AOD) and effective radius (Reff) for 30–90° and 0–30° latitudinal bands on each hemisphere (see detail on model in supplement text T1).
To retrieve the δ18O pattern in precipitation, winter months (Dec, Jan, Feb) of the 500 mb gph of ECHAM5-wiso was clustered according to Guðlaugsdóttir et al. (Citation2018) and the monthly clustering indices used. The indices assign each month to one of the four weather regimes detected, making it possible to stack four different δ18O fields associated with the 500 mb clustering indices and therefore retrieve the average isotope pattern for 800–2000 CE. The ECHAM5-wiso d-excess pattern associated with each 500 mb gph weather regime was calculated according to Eq. (3).
2.3.1. Volcanic response in δ18O and 500mb gph of ECHAM5-wiso
To evaluate the model we carry out a comparison with the volcanic response detected in δ18O of GNIP. For this we select the same EQ eruptions in ECHAM5-wiso as for the GNIP analysis. Both eruptions have maximum mean annual AOD ≤ 0.2 according to the forcing implemented in ECHAM5-wiso. As a comparison, the largest eruption of the last millennium Samalas in 1258 has a maximum AOD of 0.63 in the volcanic forcing time series while the moderate eruption of Agung had maximum AOD of 0.16. Since neither Sarychev nor Hekla are detected in the volcanic forcing implemented in ECHAM5-wiso, the model evaluation is only done using EQ eruptions. To retrieve a common volcanic signal, the average anomaly pattern was calculated for each post-volcanic winter analyzed using composite field analysis. Anomalies were calculated with respect to the same reference period as the GNIP database, or 1961–1999 CE.
2.4. Statistical estimation
For the composite fields and GNIP analysis, the significance of the values from the mean was calculated according to a two-tailed Student´s t-test at the 95% (and 90% for GNIP) confidence level (c.l.). We use n = number of months per one composite (post-volcanic) year for both EQ and NH volcanic analysis, where it has been shown that n can be as low as 2 for the t-test to be of use (Winter, 2013). Most of the GNIP stations used to retrieve the δ18O pattern associated with each of the four 500 mb gph weather regimes have n > 10 although Goose Bay and Groennedal have n as low as 4 (see supplementary Table T1A and T1B). Although we are interested in the overall pattern emerging in the stable isotopes, the significance (compared to the mean) of individual stations can give a detailed view of the stable isotope signal initiated by the weather regimes in question.
Since the volcanic analysis is limited by the number of events, the average volcanic signal is considered to be more robust where it consists in total of six winter months averaged compared to the annual post-volcanic anomaly detected for individual eruptions that only consists of three winter months averaged (see supplementary Table T2–T6). In such cases where n < 6, the attention is more on the average post-volcanic pattern emerging in the data analyzed and the comparison to the average δ18O pattern associated with the weather regimes. Due to the anti-phase nature of the weather regimes, Tables T2–T6 only highlight significant positive values. An example is NAO−, where a highly significant negative value would strongly indicate the presence of NAO + and vice versa. The same applies to AtR and ScB.
3. Results
3.1. North Atlantic weather patterns in δ18O of precipitation
The composite response of δ18O of GNIP according to the 20CR 500 mb gph clustering indices is presented in ). The clustering of the 500 mb gph of the 20CR for the period of AD 1871–2000 is shown in , where the number of cluster centroids has been defined to be four (k = 4) according to Cassou et al. (Citation2004). The T2m fields associated with each 500 mb gph cluster are provided in supplementary Fig. F1. The weather regimes identified in are similar to the results obtained by Ortega et al. (Citation2014) where they used the same reanalysis dataset (20CR) but clustered the period of 1900–2010 CE. Furthermore, compared to the weather regimes identified in ECHAM5-wiso by using the same clustering algorithm, these regimes appear to be a robust feature of the NA climate variability.
Fig. 1. (a) The composite response of δ18O of GNIP according to the 20CR V2 500 mb gph clustering indices. Colour bar represents normalized (z-scored) values. (b) The North Atlantic weather regimes according to 20CR V2 500 mb gph for the period of 1871–2012. The average z-score values for 11 central European stations (excluding Reykjavik, Svalbard and Ankara) show δ18O enrichment for NAO+ (1.25‰) and δ18O depletion for NAO− (−0.51 ‰), indicating a clear δ18O response associated with the different phases of NAO. For the Atlantic Ridge, negative anomalies are present over central Europe although the average anomaly is weak (0.05 ‰) while East N-America shows tendencies towards positive anomalies (two positive stations out of three). The Scandinavian Blocking shows the opposite, where anomalies over central Europe show positive anomalies with an average value of 0.40 ‰ while on the other side of the North Atlantic two out of three stations show negative anomalies.
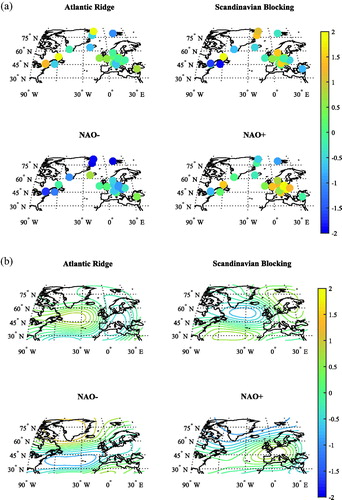
Similarities between N-Europe and East N-America can be observed in the δ18O pattern of NAO (). This is especially observed for NAO − as well as the agreement of anomalies over central Europe. It is well known that NAO + results in more enriched anomalies than normal over central Europe while NAO − results in more depleted anomalies (Baldini et al., Citation2008). Although we are interested in the overall pattern of δ18O, the significance of the observed pattern is also of importance. According to supplementary Table T1, the regimes AtR and NAO + show the strongest signal in terms of significance in the GNIP δ18O, where five (two) stations have anomalies exceeding the 90% (95%) confidence level (c.l.) and eight (five) stations are significant in the 90% (95%) c.l. respectively. ScB is only considered to be significant at the 95% c.l. in two stations while NAO − is considered significant in three (one) stations at the 90% (95%) c.l. The station in South Greenland does not seem to be sensitive towards the different weather regimes whereas the stations further north show clear differences between regimes. The significant value of the Nord station for NAO − does also indicate this (supplementary table T1). Baldini et al. (Citation2008) found that GNIP δ18O significantly correlates with the NAO index in the central European mid-latitudes and at high-latitude sites. Our results support this and further add to the potential atmospheric circulation variability revealed in δ18O of precipitation. The area of optimal retrieval of AtR and ScB according to our results is NE Greenland but more data, especially from the N and NE, are needed for confirmation.
3.2. North Atlantic weather patterns in δ18O of ECHAM5-wiso
The modelled δ18O patterns in precipitation associated with the 500 mb gph weather regimes for both the North Atlantic () and Greenland () are presented in .
Fig. 2. The δ18O pattern associated with the 500 mb gph weather regimes of ECHAM5-wiso retrieved by using clustering indices from the 500 mb gph for the period of AD 800–2000. (a) is the study area, the North Atlantic, superimposed with GNIP δ18O of for reference and (b) is the same but zooms in on Greenland. Colour bar represents normalized (z-scored) δ18O values.
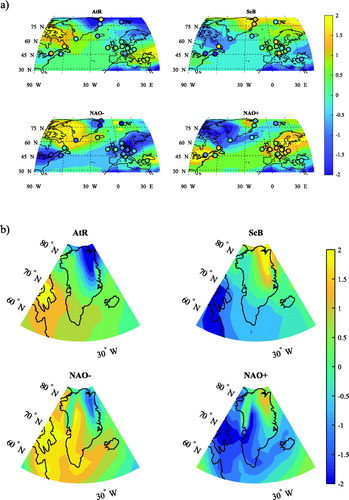
The spatial patterns of δ18O anomalies over Greenland are in good agreement with the results from the atmosphere GCM LMDZ-iso of Ortega et al. (Citation2014). Their model was nudged with the 20CR 3-D wind fields using the global spectral nudging technique (Yoshimura and Kanamitsu, Citation2008), while this study is based on simulation results of the free-running atmosphere-ocean coupled model ECHAM5/MPIOM (Werner et al., Citation2011). Furthermore, compared to the weather regimes identified in the 20CR the four weather regimes () appear to be a robust feature of the NA climate variability. The pressure centres lie over NE Greenland and the Baffin Island for both AtR and ScB. For NAO, a sharp δ18O gradient is present in the NE towards the pressure centres in the western part of Greenland. The δ18O of ECHAM5-wiso capture well the over-all pattern that is present in GNIP δ18O and reanalysis, especially the NAO + and NAO−. Compared to ECHAM5-wiso δ18O (), the signature of AtR and ScB is less clear in GNIP δ18O as compared to NAO ().
Our establishment of a stable isotope fingerprint associated with each mode of NA variability can provide us with more detailed information regarding the atmospheric circulation variability. This information we use to explore the dynamic climatic response after volcanic eruptions.
4. Volcanic imprint in the North Atlantic atmospheric circulation
To study how volcanic eruptions influence North Atlantic climate variability, δ18O is analyzed along with 500 mb gph and T2m reanalysis fields.
The mechanism that drives the volcanic δ18O response can be estimated by comparing the GNIP δ18O response to both 500 mb gph and T2m (see for T2m post-volcanic fields), where a volcanic response is considered to be robust if it is identifiable in all of the combined parameters of the analysis. The 90 and 95% significance, according to a two-tailed student's t-test, of each reanalysis field or GNIP station can be found in Tables T2–T5, where the total frequency of significant GNIP stations per year is listed in percentages (%). We assign the 500 mb gph and T2m fields to a specific weather regime (AtR, ScB, NAO−, or NAO+) according to a correlation coefficient r ≥ 0.4 and p < 0.01.
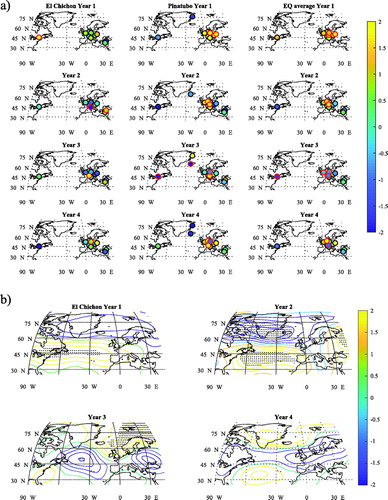
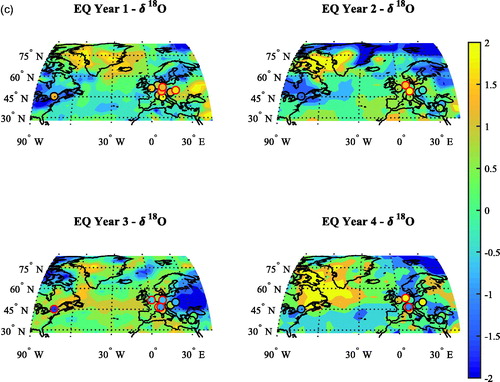
Fig. 3. The atmospheric circulation response as detected in the: a) δ18O of GNIP in the North Atlantic (coloured circles) and b) the 20CR 500mb gph anomaly fields after El Chichon, c) after Pinatubo and d) the average EQ response. Shaded areas are significant at the 95% confidence level. Colour bar represents normalized (z-scored) value.
4.1. Equatorial eruptions
In the post-volcanic anomalies in the GNIP δ18O and the 20CR 500 mb gph, respectively, after both El Chichon and Pinatubo, is shown.
4.1.1. El chichon 1982
GNIP δ18O over the NA shows depleted (negative) anomalies in the second and third year that develop into more enriched anomalies in year 4 (). According to the 20CR 500 mb gph (), NAO + is present in years 1 and 2 (r = 0.72 and r = 0.67, respectively). T2m (. F2) agrees with the 500 mb gph in year 1, whereas year 2 has a weak correlation (r = 0.23, p < 0.01) (Table T4) and shows a depleted pattern that follows the δ18O anomaly pattern that is associated with NAO−. In year 3 no clear pattern emerges, where the 500 mb gph is assigned to ScB (r = 0.50) while T2m is assigned to NAO− (r = 0.39, p < 0.01). GNIP δ18O seems to follow this NAO − pattern detected in the T2m, with more depleted anomalies in central Europe compared to year 2. Year 4 is assigned to NAO − in both the 500 mb gph (r = 0.54) and T2m (r = 0.59) but GNIP δ18O has developed towards more enriched values in central Europe despite the negative T2m anomalies, while the opposite occurs at Ottawa station. Again only one station is significant.
4.1.2. Pinatubo 1991
As shown in Table T2, ScB is present in both the 500 mb gph and T2m in year 1 () (r = 0.77 and r = 0.54, respectively). In years 2 and 3, a clear NAO + pattern emerges in both 500 mb gph (r = 0.76 and r = 0.91, respectively) and T2m (r = 0.52 and r = 0.52, respectively).
The GNIP anomalies in years 1 and 2 show enriched anomalies over central Europe while depleted anomalies are present in Ottawa, Danmarkshavn and Reykjavik. Furthermore, this pattern seems to be independent of the T2m and 500 mb gph fields. In agreement with our results, more enriched values present over central Europe (), tend to accompany NAO+ (Baldini et al., Citation2008). In year 4 no clear pattern is detectable, where the reanalysis is weakly correlated to ScB (gph: r = 0.32) and NAO− (T2m: r = 0.16) while GNIP δ18O does not show a clear pattern associated with either of these fields.
4.1.3. ECHAM5-wiso
The composite post-volcanic anomalies of El Chichon and Pinatubo is detected in the δ18O and 500 mb gph of ECHAM5-wiso and presented in . The first year is assigned to NAO − in both δ18O and gph fields (r = 0.4 and r = 0.85, respectively). Year 2 is clearly correlated with AtR in both δ18O and gph fields (r = 0.62 and r = 0.51, respectively). Year 3 does not show a clear weather regime associated with it while year 4 is either assigned to AtR in both δ18O and gph fields (r = 0.52 and r = 0.49, respectively) or NAO− (r = 0.43 and r = 0.53, respectively). NAO + is not captured in the average ECHAM5 δ18O response, neither in the first two post-volcanic years as in the reanalysis or year 3–4 as in Guðlaugsdóttir et al. (Citation2018). This might be explained by our criteria of the selected EQ volcanic eruptions since all large (AOD > 0.2) are excluded from this analysis and only eruptions with the strongest forcing present in low latitudes are used. When this analysis was done using composites of 4 eruptions (Unknown 854, Gamokara 1674, Krakatau 1883 and Agung 1963, not shown) with the maximum annual mean AOD present in the equatorial latitudinal bands ranging between 0.2 and 0.223, NAO + emerged in year 1 (r = 0.7). Adding the fifth eruption with AOD 0.35 (1600 Huyaputina) then decreased the significance. When composites of 11 EQ eruptions are analyzed, including very large eruptions like 1258 Samalas with AOD = 0.7, the model also fails to produce NAO + in year 1 possibly due to overestimation of the surface cooling in the model (Guðlaugsdóttir et al., Citation2018). This indicates a threshold in the model, where moderate eruptions (AOD = 0.16–0.19) fail to produce the NAO + in the first two years as well as very large ones (AOD = 0.3–0.7). It is interesting to note that the average post EQ-volcanic anomaly in ECHAM5 in year 2 results in an AtR in both δ18O and gph, also detected in Guðlaugsdóttir et al. (Citation2018) for year 2 using 11 EQ eruption composites.
Fig. 4. (a) The δ18O anomaly pattern 1–4 years after three EQ volcanic eruptions according to ECHAM5-wiso. (b) ECHAM5-wiso 500 mb gph post volcanic anomaly fields 1–4 years after calculated from three-eruption composites. (c) ECHAM5-wiso δ18O and GNIP δ18O comparison. Dotted area and red circles (c) are significant at the 95% confidence level.
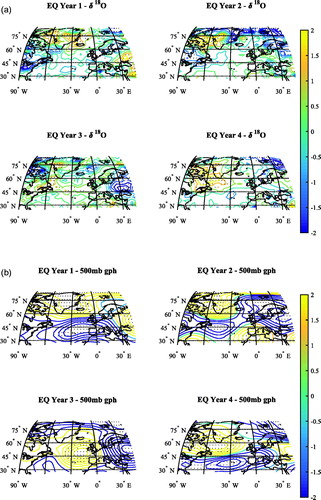
The ECHAM5-wiso gph post-volcanic fields () show clear correlation with NAO − for all years (Table T8), agreeing with the pattern present in the δ18O.
4.1.4. Summary of the response of EQ eruptions
In the first two years a clear NAO + emerges in both the 500 mb gph and T2m of the reanalysis. This NAO + pattern is detected in GNIP δ18O in year 1 but is less clear in year 2. Years 3 and 4 are weakly correlated with ScB or NAO − with the exception of the 500 mb gph in year 3 that is assigned to NAO+. When compared to the average EQ δ18O GNIP response, ECHAM5-wiso seems to under-estimate the average δ18O response in central Europe and at Ottawa in year 1 after EQ eruptions (). In year 2 a consistency is between ECHAM5 δ18O and δ18O of GNIP although the two significant GNIP stations in central Europe (red circles) do show higher anomalies compared to ECHAM5 δ18O. ECHAM5 δ18O shows slightly over-estimates anomalies in year 3 that are especially visible in the significant stations of central Europe and at Ottawa. In year 4 GNIP δ18O are in fairly good agreement with ECHAM5 δ18O although two stations in central Europe show higher anomalies compared to ECHAM5 δ18O (). The average post-volcanic anomaly detected in ECHAM5-wiso δ18O is in support of the GNIP results over Europe for years 2 and 3 where negative anomalies are present ().
4.2. North hemisphere eruptions
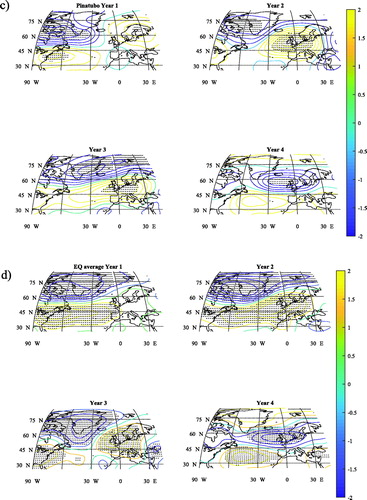
By conducting a model ensemble experiment, Oman et al. (Citation2005) detected a slight weakening of the stratospheric polar vortex in the winter following NH eruptions. This had previously been hypothesized in Graf et al. (Citation1994) where warming of the polar stratosphere would lead to a weaker polar vortex as a result of a prolonged lifetime of aerosols after such eruptions. This, along with surface cooling, can lead to short-term volcanic atmospheric circulation anomalies identifiable in the stable water isotopes of precipitation. Hekla 1970 erupted during boreal solar insolation maxima (June) and lasted 60 days where the eruption column reached 14 km up into the stratosphere (Thórarinsson and Sigvaldason, Citation1972). Sarychev Peak in the Kuril Islands (Russia) also erupted in June and lasted 10 days where it has been suggested that the sulphate aerosols encircled the NH in 14 days (Haywood et al., Citation2010). Since the 20CR dataset only covers 1871–2012, only 3 years can be analyzed after Sarychev Peak and therefore we also analyze 3 post-volcanic years after Hekla in the reanalysis compared to 4 post-volcanic years after EQ eruptions. shows the average response after Hekla 1970 and Sarychev Peak 2009 in the δ18O of GNIP and 500 mb gph of 20CR respectively.
Fig. 5. The atmospheric circulation responses as detected in (a) the δ18O of GNIP in the North Atlantic (coloured circles) and (b) The 20CR 500 mb gph after Hekla and Sarychev Peak along with the average NH response. Shaded areas are significant at the 95% confidence level. Colour bar represents normalized (z-scored) values.
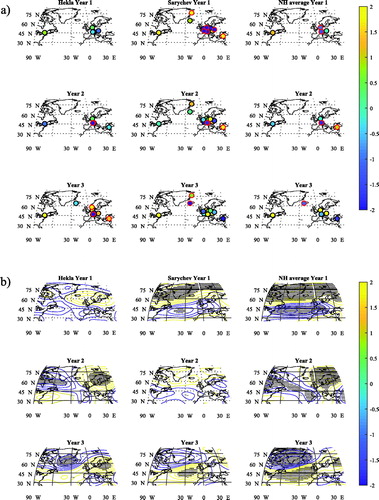
4.2.1. Hekla 1970
In the first year after the eruption an unclear signal emerges in the δ18O where no stations are of significance. This is also the case for the 500 mb gph field in year 1 where nothing is of significance although the T2m shows a tendency towards an NAO+ like pattern (r = 0.38, p < 0.01) ( and F3). In year 2 a more consistent pattern of depleted anomalies over the NA emerges where the 500 mb gph correlates strongly with ScB (r = 0.86) in year 2 as well as the T2m (r = 0.56, . F3 & Table T5). When GNIP δ18O of year 2 is compared with the GNIP ScB pattern in correlation is clear. This changes in year 3 where the δ18O pattern develops towards more enriched anomalies. This agrees well with the atmospheric circulation pattern where NAO+-like pattern is detected in both the 500 mb gph (r = 0.77) and T2m (r = 0.82).
4.2.2. Sarychev peak 2009
The 500mb gph () and T2m (. F3) fields of year 1 show a clear NAO − response (r = 0.88 and r = 0.69, respectively) where the δ18O pattern () follows the T2m. In year 2, the 500 mb gph and T2m fields show a clear NAO − pattern (r = 0.82 and r = 0.59, respectively) although the 500 mb gph is not considered to be significant within the 95% c.l. However, the δ18O GNIP pattern resembles the AtR pattern in with three stations (20%) being significant at the 95% c.l. In year 3, similar to Hekla, the 500 mb gph is assigned to NAO+ (r = 0.64) while T2m has the highest correlation to ScB (r = 0.3, p < 0.01). The GNIP δ18O anomaly pattern of year 3 shows an overall enrichment that is evidence of a warming in central Europe and Ottawa agreeing with the NAO + present in the 500 mb gph.
4.2.4. Summary of the response of NH eruptions
The NH post-volcanic anomaly that is detected in the reanalysis for year 1 is mainly based on Sarychev Peak, since the Hekla eruption does not produce a significant response, where a robust NAO − pattern emerges in both 500 mb gph and T2m. The post-volcanic anomaly of year 2 is then mainly based on Hekla, since Sarychev Peak shows nothing of significance, where year 2 is assigned to ScB in 500 mb gph and weakly in T2m. Year 3 is significant for both Hekla and Sarychev and shows a robust NAO + pattern in both 500 mb gph and T2m of the reanalysis. This atmospheric circulation pattern seem to be well recorded in the average GNIP δ18O, with more depleted anomalies in the first two years that then develops into more enriched anomalies in year 3 that resembles NAO+.
5. Discussions and conclusions
Both modelled and GNIP δ18O show that the four most dominant weather regimes are imprinted in the δ18O of precipitation throughout the North Atlantic. The strongest significant signal in the GNIP δ18O at the 90% c.l. is NAO + followed by AtR, NAO − and ScB (supplementary Table T1). According to ECHAM5-wiso, the centres of action in the δ18O pattern of AtR and ScB are present in NE of Greenland and over Baffin Island. When the centres of action in ECHAM5 are compared to the δ18O of the Station Nord and Danmarkshavn stations in NE-Greenland, the results are in support of NE Greenland being the area of optimal proxy retrieval for AtR and ScB. Previously, Rimbu and Lohmann (Citation2011) revealed a strong relationship between North Atlantic blocking and stable water isotope variability in central Greenland ice cores. To validate our results it is however necessary to retrieve more proxy data in NE Greenland. A task that should be plausible in near-future.
Despite the general high natural variability over the Euro-Atlantic region that can result in a background climate state that dominates the volcanic response (e.g. Wagner and Zorita, Citation2005; Polvani et al., Citation2018) the short-term response after volcanic eruptions seem to be well recorded in the GNIP δ18O data, where in year 1 after EQ eruptions a clear NAO + response in both GNIP and reanalysis is detected, which is significant at the 95% c.l. In year 2 depleted GNIP δ18O anomalies develop in central Europe. The GNIP anomalies do not agree with the NAO + identified in the reanalysis, where the GNIP response to NAO + according to should result in an enrichment of δ18O. ScB/NAO − is associated with both the 500 mb gph and T2m as well as GNIP δ18O and is evident as a robust response in year 3 after EQ eruptions. The equatorial eruptions were also studied using ERA interim (not shown) where the post-volcanic 2 year average 500 mb gph showed a positive-like NAO pattern followed by a negative-like NAO averaged over the post-volcanic years 3 and 4. Similar findings were reported by Toohey et al. (Citation2014) in the first two years after the Pinatubo eruptions. Wunderlich and Mitchell (Citation2017) also assessed the post-volcanic NAO response after both El Chichon and Pinatubo in 10 reanalysis datasets, including 20CR. Their results are generally in good agreement with the results presented here showing a tendency towards the positive phase of the NAO in the first post-volcanic winter. Furthermore, this same study showed that the 20CR was reported to be in good agreement with other reanalysis datasets used where the stratospheric temperature response to volcanic eruptions was generally well represented although it had slightly lower amplitude in comparison to the other reanalysis datasets. The surface cooling due to scattering of short-wave radiation could in theory result in a decrease in the equator-to-pole difference in the surface meridional temperature and thereby favor AtR, ScB and/or NAO−. Due to the ocean´s thermal capacity this would result, in our case, as an NAO − in year 3 according to .
Buchan et al. (Citation2014) presented evidence of similar findings where reemerging North Atlantic SST cold anomalies favored a persistent NAO−. The SST associated with NAO forms a tri-polar pattern, with cold anomalies in the sub-polar region, warm anomalies at mid-latitudes and cold anomalies in the sub-tropical region associated with NAO − whereas the opposite occurs for NAO+ (Deser and Blackmon, Citation1993). This pattern could be detectable in the North Atlantic meridional (latitudinal) temperature gradient and therefore we test this by extending our analysis on the T2m over the North Atlantic (land and ocean) for each post-volcanic year (), where it´s significance is assessed at the 95% c.l. using a two-tailed t-test.
Fig. 6. The North Atlantic meridional T2m (K) anomaly for each EQ (left) and NH (right) post-volcanic year analyzed where anomalies are calculated with respect to 15 years prior to each event. Black circles are significant at the 95% confidence level.
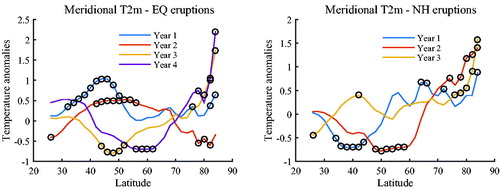
The mid-latitude warming in year 1 as a result of NAO + is evident after EQ eruptions () where significant positive anomalies are present between 30 and 50°N. These anomalies decrease somewhat in year 2, possibly as a result of northward propagation of the anomalies in year 1, the memory of volcanic cooling in the ocean mixed layer over time or other changes in atmospheric circulation due to internal variability. In years 3 and 4, negative significant anomalies at the 95% c.l. have developed in 42–52°N and 55–62°N, respectively, possibly due to northward thermal transport of negative anomalies as a result of volcanic cooling, while 75–82°N show significant positive anomalies, supporting a decrease in the T2m gradient.
From the above we can conclude the following: The average atmospheric circulation response 1–3 years after EQ eruptions with AOD ≤ 0.2 leads to an NAO+, where a robust NAO + occurs in year 2 after both El Chichon and Pinatubo (). The duration and strength of this signal is dependent on the initial state of the climate that we do not explore here as well as our selection of volcanic eruptions. In year 3, a decrease in the T2m gradient develops, offering one explanation of the presence of ScB in year 3 as well as NAO − in year 4. Although more detailed sensitivity studies are needed regarding our criteria for the selection of volcanic eruptions in ECHAM5-wiso, the post-volcanic anomaly we detect in ECHAM5-wiso is generally in good agreement with reanalysis and GNIP. An exception is year 1, where ECHAM5-wiso shows an NAO − while GNIP and reanalysis results in an NAO+-like pattern.
The detected climate response after NH eruptions is consistent in all our results for year 2, where NAO − is detected as an average post-volcanic anomaly in both reanalysis and ECHAM5-wiso and as depleted δ18O anomalies over Europe. In ECHAM5-wiso ScB is present in year 3 while NAO + is present in the reanalysis and GNIP. A common significant post-volcanic anomaly (both Hekla and Sarychev) in the reanalysis was only detected in year 3 (NAO+) and therefore the signal is weaker compared to EQ eruptions. The strong significant response detected after Sarychev in year 1 could be a mixture of Sarychev and another NH eruption, the Kasatochi eruption in 2008 (Waythomas et al., Citation2010). However, since these results are in agreement with previous studies it is not expected to influence the main conclusions. As for the EQ analysis, the meridional surface temperature gradient was estimated by analyzing each NH post-volcanic year (). We observe that significant negative anomalies are present in years 1 and 2 at 32–44°N and 48–60°N, respectively. As in the case after EQ eruptions, significant positive anomalies are present at higher latitudes, where year 1 shows significant positive anomalies at 62–83°N and year 2 in 74–83°N. Both these negative anomalies at low-mid latitudes as well as positive anomalies at higher latitudes could imply a weaker stratospheric polar vortex in years 1 and 2. This agrees well with the average NAO − pattern detected in the T2m (. F1), with cooling over the North Atlantic and warming over Greenland and Baffin Bay area. In year 3, only two latitudinal bands are significant at the 95% c.l. at low-mid latitudes, while significant positive anomalies are present in 74–83°N. This indicates a slight surface warming in mid-latitudes, possibly due to the presence of the tri-polar SST pattern associated with NAO + also suggested by our results.
To assess changes in moisture source due to surface temperature changes after volcanic eruptions, ECHAM5-wiso d-excess was calculated and the pattern associated with the 500 mb gph weather regimes retrieved (). The areas of significant anomalies according to are regions with no GNIP stations, where the main significant areas lie over the Nordic Sea as well as in the North Atlantic Ocean south of Greenland and Iceland. Our assessment on the volcanic signal in the d-excess of GNIP () only weakly indicates a change in regional factors. EQ eruptions do result in more significant GNIP stations where stations of significant positive anomalies (Tables T6 and T7) indicate an Arctic air mass origin (Bonne et al., Citation2014; Steen-Larsen et al., Citation2013), while NH eruptions have no stations with significant anomalies (Tables T6 and T7). This might either demonstrate the low impact NH eruptions have on changes in moisture source or that the area that NH eruptions impact is not covered by the GNIP stations.
Fig. 7. ECHAM5-wiso deuterium excess anomaly pattern associated with each 500 mb gph weather regime. Dotted area is significant at the 95% confidence level.
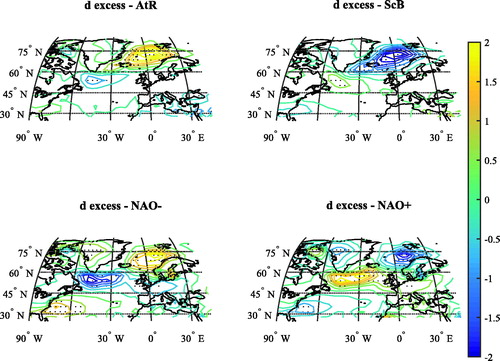
Further assessment would benefit from more stable isotope data from areas with significant anomalies such as S-Greenland, Iceland and Northern Scandinavia as well as multi-ensemble ECHAM5-wiso runs and information on the moisture transport after the eruptions. This would provide realistic information on the SST response to volcanic eruptions and how that would impact the evaporation of moisture and its transport by the atmospheric circulation, and thereby providing an insight into the mechanism controlling the coupled ocean-atmosphere system.
In summary, we report of an NAO + mode in the first two winters following EQ eruptions. Furthermore, our results suggest a dynamic response after EQ volcanic eruptions (AOD ≤ 0.2) as a result of surface cooling and atmosphere-ocean interaction. We show evidence of a decrease in the surface meridional temperature that offers an explanation for the robust NAO − detected in reanalysis, GNIP as well as ECHAM5-wiso in year 2–3. We also see evidence of ScB (e.g. year 4 after El Chichon and year 3 after Pinatubo) in δ18O of GNIP but more stations are required in NE Greenland in order to determine such a response with more certainty. The absence of AtR in the reanalysis, although present in ECHAM5-wiso, is worth mentioning despite AtR having similar frequency of occurrence as NAO − and NAO + during the period of 1871–2012, or 24%, while ScB is the most frequent regime (28%) for this period. This could be explained by our selection of monthly datasets, where hourly daily resolution data could be better suited to capture less persistent atmospheric modes, like AtR, if present. An important factor that needs to be mentioned is that in some cases a different state of the background climate can dominate the post-volcanic climate fingerprint. Since our criteria in the selection of volcanic eruptions prevents the study of more than two volcanic eruptions, the state of the background climate can be assumed to influence our results. However, since our main results are consistent with previous findings it is not considered to be a dominating factor. Despite the coarse model resolution in ECHAM5, Guðlaugsdóttir et al. (Citation2018) showed that the clustered weather regimes resulted in similar main patterns compared to the reanalysis data and therefore this model resolution generally performs well in representing the main modes of atmospheric circulation variability. An important factor that we do not explore here is the state of the climate prior to an eruption, where ocean and atmospheric conditions before and during the eruption as well as changes in solar variability can either amplify or decrease the potential post-volcanic climate fingerprint (Pausata et al., Citation2015). Again, our main results are consistent with previous findings and therefore it is not considered to be a dominating factor in this case. In our analysis, no significant signal is detected in year 1 but a clear NAO − emerges in year 2 after NH eruptions. This is followed by NAO + in year 3 in the reanalysis. According to this, a delayed dynamic response seem to emerge as NAO + in year 3–4 after NH eruptions. Such a delayed response could be related to the recovery of the sea ice cover after the decrease identified in year 3 in Guðlaugsdóttir et al. (Citation2018). By using the same NH eruptions as Guðlaugsdóttir et al. (Citation2018), a clear NAO- pattern emerged in the modelled δ18O fields of ECHAM5-wiso in year 2 after an eruption followed by NAO + in year 4 (not shown). During summer, NH eruptions cool the surface that would in theory have the opposite effect compared to EQ eruptions – to increase the surface meridional temperature gradient. Depending on the size of the eruption and the lifetime of aerosols, this could cause persistent surface cooling into the fall. However, further analysis is needed to assess if such a cooling would result in an NAO + mode during winter. We do see evidence that such a delayed surface response emerge as NAO + in our results, but the link is not robust.
Data from more GNIP stations would improve the NH analysis, where the post-volcanic anomaly pattern that is presented in this study demonstrates the need for a more detailed understanding on the potential global climate impacts of NH eruptions. Although we have not analyzed the stratospheric zonal winds, our results might indicate that NH volcanic eruptions weaken the stratospheric polar vortex.
The d-excess analysis provides an insight into possible ocean-atmosphere dynamics but more detailed studies are needed to support this, e.g. back-trajectory analysis of the air mass transporting the precipitation as well as information on the relative humidity. This, along with the assessment of the sensitivity of the stratospheric and surface temperature gradient to seasonality and magnitude of NH eruptions, is left for future studies.
Supplemental Material
Download PDF (4.9 MB)Additional information
Funding
References
- Aemisegger, F. and Sjolte, J. 2018. A climatology of strong large-scale ocean evaporation events. Part II: relevance for the deuterium excess signature of the evaporation flux. J. Climate 31, 7313–7336. doi: 10.1175/JCLI-D-17-0592.1
- Baldini, L. M., McDermott, F., Foley, A. M. and Baldini, J. U. 2008. Spatial variability in the European winter precipitation δ18O‐NAO relationship: implications for reconstructing NAO‐mode climate variability in the Holocene. Geophys. Res. Lett. 35.
- Bonne, J. L., Masson-Delmotte, V., Cattani, O., Delmotte, M., Risi, C. and co-authors. 2014. The isotopic composition of water vapour and precipitation in Ivittuut, southern Greenland. Atmos. Chem. Phys. 14, 4419–4439. doi: 10.5194/acp-14-4419-2014
- Buchan, J., Hirschi, J. J. M., Blaker, A. T. and Sinha, B. 2014. North Atlantic SST anomalies and the cold north European weather events of winter 2009/10 and December 2010. Mon. Wea. Rev. 142, 922–932. doi: 10.1175/MWR-D-13-00104.1
- Carey, S. and Sigurdsson, H. 1986. The 1982 eruptions of El Chichon volcano, Mexico (2): Observations and numerical modelling of tephra-fall distribution. Bull. Volcanol. 48, 127. https://doi.org/10.1007/BF01046547
- Cassou, C., Terray, L., Hurrell, J. W. and Deser, C. 2004. North Atlantic winter climate regimes: spatial asymmetry, stationarity with time, and oceanic forcing. J. Climate 17, 1055–1068.
- Comas-Bru, L., McDermott, F. and Werner, M. 2016. The effect of the East Atlantic pattern on the precipitation δ18O-NAO relationship in Europe. Clim. Dyn. 47, 2059–2069.
- Compo, G. P., Whitaker, J. S., Sardeshmukh, P. D., Matsui, N., Allan, R. J. and co-authors. 2011. The twentieth century reanalysis project. Qjr. Meteorol. Soc. 137, 1–28.
- Crowley, T. J., Zielinski, G., Vinther, B., Udisti, R., Kreutz, K. and co-authors. 2008. Volcanism and the little ice age. PAGES news 16, 22–23.
- Dansgaard, W., Johnsen, S. J., Clausen, H. B., Dahl-Jensen, D., Gundestrup, N. S., et al. 1993. Evidence for general instability of past climate from a 250-kyr ice-core record. Nature 364, 218.
- Davini, P., Corti, S., D'Andrea, F., Rivière, G. and von Hardenberg, J. 2017. Improved winter European atmospheric blocking frequencies in high-resolution global climate simulations. J. Adv. Model. Earth Syst. 9, 2615–2634. https://doi.org/10.1002/2017MS001082
- Deirmendjian, D. 1973. On volcanic and other particulate turbidlty anomalies. Advances in Geophysics 16, 267–296.
- Deser, C. and Blackmon, M. L. 1993. Surface climate variations over the North Atlantic Ocean during winter: 1900–1989. Journal of Climate 6, 1743–1753.
- Du, Z., Xiao, C., Zhang, Q., Li, C., Wang, F. and co-authors. 2019. Climatic and environmental signals recorded in the EGRIP snowpit, Greenland. Environ. Earth Sci. 78, 170.
- Fischer, E. M., Luterbacher, J., Zorita, E., Tett, S. F. B., Casty, C. and co-authors. 2007. European climate response to tropical volcanic eruptions over the last half millennium. Geophys. Res. Lett. 34,
- Gettleman, A. and Kristjánsson, J. E. 2015. Icelandic volcanic emissions and climate. Nature Geoscience 8, 243.
- Graf, H., Perlwitz, J. and Kirchner, I. 1994. Northern Hemisphere tropospheric mid-latitude circulation after violent volcanic eruptions. Contr. Atmos. Phys. 67, 3–13.
- Guðlaugsdóttir, H., Steen-Larsen, H. C., Sjolte, J., Masson-Delmotte, V., Werner, M. and co-authors. 2018. The influence of volcanic eruptions on weather regimes over the North Atlantic simulated by ECHAM5/MPI-OM ensemble runs from 800 to 2000 CE. Atmos. Res. 213, 211.
- Haywood, J. M., Jones, A., Clarisse, L., Bourassa, A., Barnes, J. and co-authors. 2010. Observations of the eruption of the Sarychev volcano and simulations using the HadGEM2 climate model. J. Geophys. Res. 115.
- Holasek, R. E., Self, S. and Woods, A. W. 1996. Satellite observations and interpretation of the 1991 Mount Pinatubo eruption plumes. J. Geophys. Res. 101, 27635–27655.
- Hurrell, J. W. 1995. Decadal trends in the North Atlantic oscillation: regional temperatures and precipitation. Science 269, 676–679.
- IAEA. 2001. GNIP Maps and Animations, International Atomic Energy Agency, Vienna. Accessible at http://isohis.iaea.org
- International Atomic Energy Agency. 1992. Statistical treatment of data on environmental isotopes in precipitation, Technical Reports Series No. 331, IAEA, Vienna, 781.
- Johnsen, S. J., Dahl‐Jensen, D., Gundestrup, N., Steffensen, J. P. and co-authors. 2001. Oxygen isotope and palaeotemperature records from six Greenland ice‐core stations: Camp Century, Dye‐3, GRIP, GISP2, Renland and NorthGRIP. J. Quaternary Sci. 16, 299–307.
- Johnsen, S. J., Clausen, H. B., Dansgaard, W., Gundestrup, N. S., Hammer, C. U. and co-authors. 1997. The δ18O record along the Greenland Ice Core Project deep ice core and the problem of possible Eemian climatic instability. J. Geophys. Res. 102, 26397–26410.
- Jungclaus, J. H., Lorenz, S. J., Timmreck, C., Reick, C. H., Brovkin, V., and co-authors. 2010. Climate and carbon-cycle variability over the last millennium. Clim. Past 6, 723–737.
- Kodera, K. 1994. Influence of volcanic eruptions on the troposphere through stratospheric dynamical processes in the Northern Hemisphere winter. J. Geophys. Res. 99, 1273–1282.
- Kravitz, B. and Robock, A. 2011. Climate effects of high‐latitude volcanic eruptions: role of the time of year. J. Geophys. Res. 116.
- Merlivat, L. and Jouzel, J. 1979. Global climatic interpretation of the deuterium‐oxygen 18 relationship for precipitation. J. Geophys. Res. 84, 5029–5033.
- Masson-Delmotte, V., M., Schulz, A., Abe-Ouchi, J., Beer, A., Ganopolski, J.F. and co-authors. 2013. Information from Paleoclimate Archives. In: Climate Change 2013: The Physical Science Basis. Contribution of Working Group I to the Fifth Assessment Report of the Intergovernmental Panel on Climate Change (eds. Stocker, T.F., D. Qin, G.-K. Plattner, M. Tignor, S.K. Allen, J. Boschung, A. Nauels, Y. Xia, V. Bex and P.M. Midgley). Cambridge University Press, Cambridge, United Kingdom and New York, NY, USA.
- Pausata, F. S. R., Grini, A., Caballero, R., Hannachi, A. and Seland, Ø. 2015. High-latitude volcanic eruptions in the Norwegian Earth System Model: the effect of different initial conditions and of the ensemble size. Tellus B 67, 26728.
- Pausata, F. S., Chafik, L., Caballero, R. and Battisti, D. S. 2015. Impacts of high-latitude volcanic eruptions on ENSO and AMOC. Proc. Natl. Acad. Sci. U.S.A. 112, 13784–13788.
- Pfahl, S. and Sodemann, H. 2014. What controls deuterium excess in global precipitation? Clim. Past 10, 771–781.
- Polvani, L. M., Banerjee, A. and Schmidt, A. 2018. Northern Hemisphere continental winter warming following the 1991 Mt. Pinatubo eruption: reconciling models and observations. Atmos. Chem. Phys. Discuss. https://doi.org/10.5194/acp-2018-333, in review.
- Reeves Eyre, J. E. and Zeng, X. (2017). Evaluation of Greenland near Surface Air Temperature Datasets. The Cryosphere. 11, 1591–1605.
- Robock, A. and Mao, J. 1992. Winter warming from large volcanic eruptions. Geophys. Res. Lett. 19, 2405–2408.
- Rozanski, K., Araguas, L. and Gonfiantini, R. 1993. Isotope patterns in modern global precipitation, geophysical monograph 78. In: Climate Change in Continental Isotope Records. American Geophysical Union, pp. 1–36.
- Rimbu, N. and Lohmann, G. 2011. Winter and summer blocking variability in the North Atlantic region—evidence from long-term observational and proxy data from southwestern Greenland. Clim. Past 7, 543–555.
- Rimbu, N., Lohmann, G., Werner, M. and Ionita, M. 2017. Links between central Greenland stable isotopes, blocking and extreme climate variability over Europe at decadal to multidecadal time scales. Clim. Dyn. 49, 649–663.
- Robock, A. 2000. Volcanic eruptions and climate. Reviews of Geophysics 38, 191–219.
- Scaife, A. A., Woollings, T., Knight, J., Martin, G. and Hinton, T. 2010. Atmospheric blocking and mean biases in climate models. J. Climate 23, 6143–6152. https://doi.org/10.1175/2010JCLI3728.1
- Sjolte, J., Sturm, C., Adolphi, F., Vinther, B. M., Werner, M. and co-authors. 2018. Solar and volcanic forcing of North Atlantic climate inferred from a process-based reconstruction. Clim. Past 14, 1179–1194.
- Steen-Larsen, H. C., Johnsen, S. J., Masson-Delmotte, V., Stenni, B., Risi, C. and co-authors. 2013. Continuous monitoring of summer surface water vapor isotopic composition above the Greenland Ice Sheet. Atmos. Chem. Phys. 13, 4815–4828.
- Steen-Larsen, H. C., Masson-Delmotte, V., Hirabayashi, M., Winkler, R., Satow, K. and co-authors. 2014. What controls the isotopic composition of Greenland surface snow?. Climate of the Past 10, 377–392.
- Steen‐Larsen, H. C., Sveinbjörnsdottir, A. E., Jonsson, T., Ritter, F. and co-authors. 2015. Moisture sources and synoptic to seasonal variability of North Atlantic water vapor isotopic composition. J. Geophys. Res. Atmos. 120, 5757–5774.
- Steffensen, J. P., Andersen, K. K., Bigler, M., Clausen, H. B., Dahl-Jensen, D. and co-authors. 2008. High-resolution Greenland ice core data show abrupt climate change happens in few years. Science 321, 680–684.
- Stenchikov, G., Robock, A., Ramaswamy, V., Schwarzkopf, M. D., Hamilton, K. and co-authors. 2002. Arctic Oscillation response to the 1991 Mount Pinatubo eruption: Effects of volcanic aerosols and ozone depletion. Journal of Geophysical Research: Atmospheres 107 (D24).
- Toohey, M., Krüger, K., Bittner, M., Timmreck, C. and Schmidt, H. 2014. The impact of volcanic aerosol on the Northern Hemisphere stratospheric polar vortex: mechanisms and sensitivity to forcing structure. Atmos. Chem. Phys. 14, 13063–13079.
- Toon, O. and Pollack, J. 1980. Atmospheric aerosols and climate: Small particles in the Earth's atmosphere interact with visible and infrared light, altering the radiation balance and the climate. American Scientist 68, 268–278.
- Thórarinsson, S. and Sigvaldason, G. E. 1972. The Hekla eruption of 1970. Bull. Volcanol. 36, 269–288. https://doi.org/10.1007/BF02596870
- Oman, L., Robock, A., Stenchikov, G., Schmidt, G. A. and Ruedy, R. 2005. Climatic response to high‐latitude volcanic eruptions. J. Geophys. Res. 110.
- Ortega, P., Swingedouw, D., Masson-Delmotte, V., Risi, C., Vinther, B. and co-authors. 2014. Characterizing atmospheric circulation signals in Greenland ice cores: insights from a weather regime approach. Climate Dyn. 43, 2585–2605.
- Ortega, P., Lehner, F., Swingedouw, D., Masson-Delmotte, V., Raible, C. C. and co-authors. 2015. A model-tested North Atlantic Oscillation reconstruction for the past millennium. Nature 523, 71.
- Wagner, S. and Zorita, E. 2005. The influence of volcanic, solar and CO2 forcing on the temperatures in the Dalton Minimum (1790–1830): a model study. Clim. Dyn. 25, 205–218.
- Waythomas, C. F., Scott, W. E., Prejean, S. G., Schneider, D. J., Izbekov, P. and co-authors. 2010. The 7–8 August 2008 eruption of Kasatochi Volcano, central Aleutian Islands, Alaska. J. Geophys. Res. 115
- Werner, M., Langebroek, P. M., Carlsen, T., Herold, M. and Lohmann, G. 2011. Stable water isotopes in the ECHAM5 general circulation model: Toward high‐resolution isotope modeling on a global scale. J. Geophys. Res. 116
- Wunderlich, F. and Mitchell, D. M. 2017. Revisiting the observed surface climate response to large volcanic eruptions. Atmos. Chem. Phys. 17, 485–499.
- Yoshimura, K. and Kanamitsu, M. 2008. Dynamical global downscaling of global reanalysis. Mon. Wea. Rev. 136, 2983–2998.