
 ?Mathematical formulae have been encoded as MathML and are displayed in this HTML version using MathJax in order to improve their display. Uncheck the box to turn MathJax off. This feature requires Javascript. Click on a formula to zoom.
Abstract
Early daily actinometric and cloud cover data from Cáceres (SW of Spain) were recovered for the period 1913–1920. The task of retrieving and digitising early actinometric data series turn out highly required due to the lack of solar radiation data throughout the first half of twentieth century. Firstly, the Arago actinometer and the procedure employed to record the actinometric data were described in detail. Additionally, in spite of being a short series, trends from recovered actinometric data were analysed. A negative trend of (−0.16 ± 0.03) °C/year was obtained for all-sky conditions, reaching a marked value of (−0.26 ± 0.04) °C/year when cloud-free days were selected in the analysis. Both trends were statistically significant at the 95% confidence level. The Katmai eruption in June 1912 likely caused anomalous low actinometric records in 1913 and 1914. These results suggest a decrease of solar radiation in Cáceres during the second decade of the twentieth century which is in accordance with the final stage of the long-term negative trend in solar radiation data observed at several European sites from late nineteenth century to the beginning of the twentieth century (‘early dimming’).
1. Introduction
Recovering meteorological measurements of the past is a task of great interest due to the fact that long-term changes in the Earth climate are the most serious issue among environmental problems at present (IPCC, Citation2013). Therefore, there is a huge interest in recovering early meteorological data that are only available in manuscript and printed books. There are several initiatives to provide machine-readable versions of these data. For example, Domínguez-Castro et al. (Citation2017) recovered more than 300,000 meteorological data for the period 1754–1905 in Latin America and the Caribbean. Moreover, other initiatives can be cited such as the Atmospheric Circulation Reconstructions over the Earth (ACRE) (Allan et al., Citation2011, Citation2016) (http://www.met-acre.org/) and the International Data Rescue (I-DARE) (https://www.idare-portal.org/). In particular, some efforts have been made in Iberia (Alcoforado et al., Citation2012; Domínguez-Castro et al., Citation2014a, 2014Citationb). These works have recovered a lot of meteorological data, mainly related to temperature, pressure and rainfall, but other meteorological variables as cloudiness or solar radiation are under-represented. There are only some works that have started this task (Antón et al., Citation2014; Laken and Vaquero, Citation2015; Antón et al., Citation2017).
Since solar radiation is the primary energy source for physical processes and phenomena in the atmosphere, early data of this variable are necessary for long-term studies (see, e.g., Russak, Citation2009). Unfortunately, solar radiation data in the past are very scarce because the measure of this variable is relatively recent. In general, systematic measurements of solar radiation are available since the second half of the twentieth century and we only have a few records before 1950 (Wild, Citation2005; Antón et al., Citation2014; Stanhill and Achiman, Citation2017). In the case of actinometric data, the first regular continuous measurements in the world were initiated in the middle of the twentieth century (Matuszko, Citation2014). We have found and recovered early actinometric measurements in Cáceres (Spain; 39° 28′ N, 6° 22′ W) for the period 1913–1920. This dataset could contribute to the reconstruction of the solar radiation climate series in that epoch.
Thanks to the studies carried out about solar radiation, it can be shown how the amount of solar radiation that reaches the Earth's surface is not steady, suffering significant decadal variations (Wild, Citation2009). Studies analysing long-term records of surface radiation measurements suggest a widespread decrease in surface solar radiation between the 1950s and 1980s (‘global dimming’), with a more recent partial recovery at many locations (‘brightening’) (Wild, Citation2009). For example, Russak (Citation2009) analysed direct solar radiation measurements (recorded by an actinometer) and diffuse solar radiation measures (recorded by a pyranometer) for the period 1955–2007 in Estonia. Results show a statistically significant decrease of solar radiation (global and direct) for the period 1955–1992. Many authors showed this decrease (e.g. Stanhill and Cohen, Citation2001; Hatzianastassiou et al., Citation2005; Wild, Citation2005; Ohmura, Citation2009; Sanchez-Lorenzo et al., Citation2013).
On the other hand, other authors found an ‘early brightening’ in the first half of the twentieth century, which seems to be statistically significant (e.g. Stanhill and Cohen, Citation2005, Citation2008; Lachat and Wehrli, Citation2013). However, other solar radiation datasets show no evidences of this ‘early brightening’. For instance, Antón et al. (Citation2014), who studied solar radiation for the period 1911–1928 in Madrid (Spain) from pirheliometric data, observed a small decrease for the period 1914–1928, although it was not statistically significant. This finding agrees with other results, which do not evidence an increase of solar radiation values during this period (e.g. Hoyt, Citation1979; Ohvril et al., Citation2009; Antón et al., Citation2017; Kazadzis et al., Citation2018).
Therefore, there is a controversy in the scientific community about the trend of the solar radiation at the Earth's surface in the first half of the twentieth century, and the analysis of the actinometric data recovered in Cáceres (Spain) for the period 1913–1920 can contribute to clarify this open issue.
Thus, the two aims of the present work were (1) to describe in detail the Arago actinometer and the data recorded by this instrument in Cáceres observatory and (2) to analyse the behaviour of the actinometric series (1913–1920) for both all sky and cloud-free conditions, taking into account cloud cover information which is also available together with actinometric records for the study period. The structure of the paper is as follows: Section 2 describes the instrument data used for the study. The method used for the analysis of the actinometric data, and the corresponding results are presented in Sections 3 and 4, respectively. Finally, conclusions of this study are presented in Section 5.
2. Instrument and data
The dataset of actinometric measurements here recovered and analysed were recorded in Cáceres (Spain) with an Arago actinometer during the period 1913–1920. Thus, the actinometric data are used as an indirect measurement of solar radiation. The first references to an actinometer appeared at the middle of the nineteenth century (Herschel, Citation1844). The actinometer evolved in a multitude of variants related only for its same purpose: the measurement of the solar radiation. One of these versions was named Arago actinometer. Although there is not any reference to this instrument in the works of Arago, a prototype was found in his scientific instrument collection (Besson, Citation1927). It is also known as Arago-Davy actinometer since M. H. Marié-Davy used extensively this instrument at the Montsouris Observatory (Marié-Davy, Citation1875).
Marié-Davy (Citation1875) explains in detail this instrument and its characteristics. Arago actinometer () consists on a pair of bright- and black-bulb thermometers, each one enclosed in a plane-glass spherical envelop from which the air has been exhausted. The installation of this instrument in the Montsouris Observatory by H. Marié-Davy can be seen in . When it is exposed to the sunshine, the black bulb attains a higher temperature than the bright-bulb, and the difference between the two thermometers is an index of the amount of solar radiation reaching the Earth's surface (Marié-Davy, Citation1875).
Fig. 1. Installation of Arago actinometer from Marie-Davy (1875).

Marié-Davy (Citation1875) proposed the equation to convert the difference of temperatures
to solar irradiance I, a being a calibration constant obtained by a linear fit. Years later, Besson (Citation1927) improve this first methodology proposing the equation
where
and T are the temperatures of the black and the bright bulk thermometers, respectively, and the constants a and b must be determined. To find the value of these constants, Besson (Citation1927) made a series of measurements during the years 1923 and 1924 using a Crova actinometer as a reference (Crova, Citation1888) and making a fit using the least squares method.
In other studies of that epoch, other methods to carry out that transformation were proposed. For example, Guilmet (Citation1931) proposed the following equation
where C1 and C2 are two coefficients to be determined, n is the amount of cloudiness measured in tenths of covered sky, H is the height of the Sun and
is the temperature difference. For the calculation of the coefficients C1 and C2, measurements are taken on completely clear days (n = 0) and on completely cloudy days (n = 1), respectively. Guilmet (Citation1931) calculates C1 and C2 comparing the Arago actinometer measurements with Gorezynski solarimeter measurements. This author obtained that coefficient C1 is a function of the height of the Sun (H) taking the values 0.290, 0.266, 0.242, 0.218 and 0.205 cal cm−2 min−1 °C−1 for H values equal to 15°, 30°, 45°, 60° and 75°, respectively. The coefficient C2 obtained by Guilmet (Citation1931) was equal to 0.164 cal cm−2 min−1 °C−1.
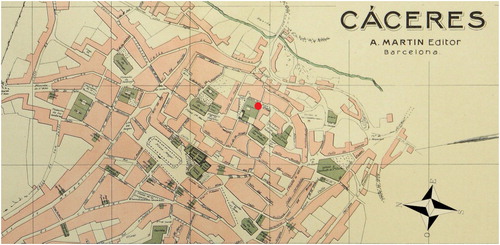
During the nineteenth century, several attempts to establish a meteorological station in Cáceres were made. However, these activities did not have continuity. At the best of our knowledge, the oldest meteorological data were published in the newspaper entitled ‘Boletín de la Agencia de Cáceres’ in 1844. Continuous meteorological data began in Cáceres in 1906 on a terrace of the ‘Instituto Provincial de Segunda Enseñanaza’, located in the historic centre of the city, World Heritage Site by UNESCO since 1986 (Cardallaiguet, Citation1997). The coordinates of this place are: 39° 28′ 23″ N, 6° 22′ 12″, 460 masl (see ). This station belongs to the Spanish official network of meteorological stations managed by AEMET (Almarza et al., Citation1996).
Fig. 2. Old map of the city of Cáceres (Spain) showing the position of the meteorological station located at the terrace of the High School.
Original data of actinometric measurements and cloud cover are preserved in the Library of the Regional Office in Extremadura of State Meteorological Agency of Spain (AEMET), in a log-book of the Cáceres station that covers the period 1906–1923. Unfortunately, there are not actinometric data in other log-books for this station.
A brief description of the installation of the Arago actinometer in the terrace of this High School appears in this log-book. According to this annotation, the Arago actinometer used in Cáceres consisted on a pair of bright- and black-bulb thermometers made by Tonnelot with reference numbers 38140 and 38135. They were located on a board in the terrace. Unfortunately, the difference of temperatures of the actinometric data series here presented cannot be transformed to solar irradiance. The Arago actinometer was probably lost when the High School was transferred to another building in the year 1964. Therefore, it is impossible to estimate the coefficients of the equation used by Guilmet (Citation1931).
Cloud cover measurements were also taken in the same period in Cáceres. Actinometric data were registered at 16:00 (Local Time, LT) (for the period 1913–1920) and at 13:00 (LT) (for the year 1923). Unfortunately, there is a gap for the period 1921–1922. Cloud cover data were recorded in fraction of covered sky, from 0 (clear sky) to 4/4 or 10/10 (covered sky) depending on the period as follows. For the period 1913–1920, cloud cover measurements were registered at 8:00 (LT) and at 16:00 (LT) in fourths of covered sky. For the period 1921–1922, measurements were taken at 8:00 (LT), at 13:00 (LT) and at 18:00 (LT) in tenths of covered sky. Finally, for the year 1923, measurements were taken at 8:00 (LT) and 16:00 (LT) in tenths of covered sky.
In the present study, actinometric and cloud cover data were analysed for the period 1913–1920, in which both data series were read at the same time (16:00 LT). Therefore, it can be assumed that the two observations are strongly related each other.
3. Analysis method of actinometric series
The study of trends for actinometric series is performed by the linear regression analysis applied on the daily time series. Since the evolution of actinometric measurements present a clear seasonal behaviour (not shown) related to the well-known global solar radiation dependence on the annual cycle of the solar elevation (Iqbal, Citation1983), the seasonal behaviour has been evaluated and thus the daily time series has been deseasonalised.
This seasonal behaviour of the difference of the readings of the pair of bright- and black-bulb thermometers in the Arago actinometer, S, can be estimated as the average of all actinometric measurements recorded in the same day of the year (from 1 to 365) of the whole period (1913–1920). Once this seasonal pattern has been calculated, the deseasonalised daily values, D, can be obtained as:
(1)
(1)
where the seasonal values (Sj) are subtracted from the daily values of actinometric measurements (Aij). The sub-index i denotes the year (from 1913 to 1920), and the sub-index j the day of the year. Finally, actinometric series trends can be evaluated for the period 1913–1920 using the deseasonalised daily values.
Cloud cover data are used to analyse actinometric series trends without the effects of clouds. Thus, those days with all cloud cover observations equal to zero fourth (0/4) are selected in order to analyse the trends exclusively under cloud-free conditions.
Furthermore, the trends are calculated for each season of the year as for all-sky conditions as for cloud-free cases. For this goal, a linear regression analysis is applied to four annual time series inferred from the deseasonalised daily values for winter (Dec–Jan–Feb), spring (Mar–Apr–May), summer (Jun–Jul–Aug) and autumn (Sep–Oct–Nov).
4. Results and discussion
shows the evolution of the deseasonalised daily time series (EquationEq. (1)(1)
(1) ) derived from the actinometric data from January 1913 to December 1920 in Cáceres (Spain). This time series is smoothed with deseasonalised monthly values (black line), which have been obtained in a similar way to deseasonalised daily values.
Fig. 3. Evolution of the deseasonalised daily time series for actinometric data from January 1913 to December 1920 in Cáceres (Spain).
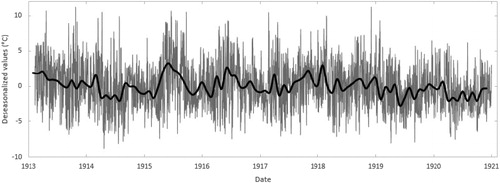
A slightly decline in the deseasonalised daily values can be seen over the 1913–1920 period. To verify this assumption, the trend from these deseasonalised daily values is obtained for the whole period. The slope of the trend line (±standard error) is negative with a value of (−0.16 ± 0.03) °C/year, being statistically significant at the 95% confidence level. When only cloud-free days (0/4 cloud cover) are included in the analysis, the resulting trend is notably more negative (−0.26 ± 0.04 °C/year), being also statistically significant. It is worth to mention the marked decrease observed in the beginning of the period, over the years 1913–1914, which may likely be related to the effects of the Katmai eruption in early June 1912 in Alaska. The Katmai eruption was the most powerful in the twentieth century in the world (Hildreth and Fierstein, Citation2012).
shows the slope of the trend lines analysis of deseasonalised daily values for each season, and their uncertainty (standard error) for the whole period 1913–1920. Additionally, linear trends are also calculated under cloud free conditions, that is, those days with all cloud cover observations equal to zero fourth (0/4). Those trends statistically significant at the 95% confidence level are in bold. Spring, summer and autumn show negative trends for both all-sky and cloud-free analysis, being all statistically significant. For these three season, it must be highlighted that the magnitude of cloud-free trends are substantial larger than all-sky trends. Winter trends are positive but without statistical significance.
Table 1. Deseasonalised daily values linear trends for each season in °C/year (±standard error) at Cáceres for the whole period 1913–1920.
The notable magnitude of the trends obtained in the present study using cloud-free days may be likely related to the non-negligible influence of atmospheric aerosols over the annual variations of the solar radiation reaching the surface. This remarkable result is in agreement with two recent works using measurements recorded in Madrid. The first of them, Antón et al. (Citation2017) (see their ) who showed a significant decrease of the clearness index under cloud-free conditions in summer for the period 1915–1922. The other one, Aparicio et al. (2019) who also reported a significant decrease in atmospheric column transparency from pyrheliometer measurements (selecting cloud-free solar disk cases) during the period 1910–1925.
All results reported above are also in accordance with several works (Brazdil et al., Citation1994; Brunetti et al., Citation2009; Sanchez-Lorenzo and Wild, Citation2012; Founda et al., Citation2014; Matuszko, Citation2014; Stanhill and Achiman, Citation2017) which reported a significant decline of the solar radiation data between the last part of the nineteenth century and the beginning of the twentieth century in different European areas, calling this phenomenon as ‘early dimming’. Therefore, the negative trends observed for the actinometric data in Cáceres could be associated with the final evolution of this ‘early dimming’, which has been related to the strong increase of black carbon emissions since mid-nineteenth century (Novakov et al., Citation2003; McConnell et al., Citation2007; Lamarque et al., Citation2010).
Finally, it must be highlighted that the ‘early brightening’ likely started after 1920s in Spain, in agreement with other studies in different European sites, which centred this controversial issue between the late 1930s and the mid-1950s (Sanchez-Lorenzo and Wild, Citation2012; Founda et al., Citation2014; Matuszko, Citation2014; Manara et al., Citation2015; Sanchez-Lorenzo et al., Citation2015).
5. Conclusions
Early daily actinometric and cloud cover data from Cáceres (Spain) have been recorded and digitised for the period 1913–1920. The functioning of the Arago actinometer and its characteristics are known thanks to the early publications described in Section 2. The scarcity of solar radiation data during first half of twentieth century highlights the recovery and study of series with a great potential for clarify the past evolution of the surface solar radiation.
In spite of being a short series, trends from recovered actinometric data were analysed in Cáceres for the period 1913–1920. It has been found a decrease of (−0.16 ± 0.03) °C/year, which is statistically significant at the 95% confidence level. Under cloud-free conditions, a statistically significant decrease of (−0.26 ± 0.04) °C/year at the 95% confidence level has also been found. The analysis of the actinometric data for each season shows statistically significant negative trends for summer, spring and autumn for both all-sky and cloud-free condition.
To sum up, the solar radiation reaching at surface likely suffered a decrease during the second decade of the twentieth century in Cáceres, with a high evidence for cloud-free days. This decrease may be included in the final stage of the long-term negative trend observed in the solar radiation data at several European sites between the last part of the nineteenth century and the beginning of the twentieth century (‘early dimming’).
Acknowledgements
The authors thank AEMET for the access to the manuscripts used in this study.
Additional information
Funding
References
- Alcoforado, M. J., Vaquero, J. M., Trigo, R. M. and Taborda, J. P. 2012. Early Portuguese meteorological measurements (18th century). Clim. Past 8, 353–371. doi:10.5194/cp-8-353-2012
- Allan, R., Brohan, P., Compo, G. P., Stone, R., Luterbacher, J. and co-authors. 2011. The international atmospheric circulation reconstructions over the earth (ACRE) initiative. Bull. Am. Meteor. Soc. 92, 1421–1425. doi:10.1175/2011BAMS3218.1
- Allan, R., Endfield, G., Damodaran, V., Adamson, G., Hannaford, M. and co-authors. 2016. Toward integrated historical climate research: the example of atmospheric circulation reconstructions over the earth. WIREs Clim. Change 7, 164–174. doi:10.1002/wcc.379
- Almarza, C., López, J. A. and Flores, C. 1996. Homogeneidad y variabilidad de los registros históricos de precipitación de España. Ministerio de medio ambiente, Dirección General del Instituto Nacional de Meteorología.
- Antón, M., Román, R., Sanchez-Lorenzo, A., Calbó, J. and Vaquero, J. M. 2017. Variability analysis of the reconstructed daily global solar radiation under all-sky and cloud-free conditions in Madrid during the period 1887–1950. Atmos. Res. 191, 94–100. doi:10.1016/j.atmosres.2017.03.013
- Antón, M., Vaquero, J. M. and Aparicio, A. J. P. 2014. The controversial early brightening in the first half of 20th century: a contribution from pyrheliometer measurements in Madrid (Spain). Global Planet. Change 115, 71–75. doi:10.1016/j.gloplacha.2014.01.013
- Aparicio, A. J. P., Antón, M., Gallego, M. C., Sanchez-Lorenzo, A. and Vaquero, J. M. 2019. Re-evaluation of trends in atmospheric column transparency from pyrheliometer measurements in Madrid (1910–1929). Atmos. Res. 217, 165–171. doi:10.1016/j.atmosres.2018.11.003
- Besson, M. L. 1927. Sur l’actinomètre d’Arago. Annal Serv Tech d’Hygiène de la Ville de Paris IX, 149–166.
- Brazdil, A., Flocas, A. A. and Sahsamanoglou, H. S. 1994. Fluctuation of sunshine duration in central and South-Eastern Europe. Int. J. Climatol. 14, 1017–1034. doi:10.1002/joc.3370140907
- Brunetti, M., Lentini, G., Maugeri, M., Nanni, T., Auer, I. and co-authors. 2009. Climate variability and change in the Greater Alpine Region over the last two centuries based on multi-variable analysis. Int. J. Climatol. 29, 2197–2225. doi:10.1002/joc.1857
- Cardallaiguet, M. 1997. El Instituto Provincial de Segunda Enseñanza (ciento cincuenta años de historia educativa) (1839–1989). Instituto de Bachillerato «El Brocense», Cáceres.
- Crova, A. 1888. Etude de l’intensité calorifique de la radiation solaire au moyen de l’actinomètre enregistreur. Ann. Chim. Phys. XIV, 541.
- Domínguez-Castro, F., Vaquero, J. M., Gallego, M. C., Farrona, A. M. M., Antuña-Marrero, J. C. and co-authors. 2017. Early meteorological records from Latin-America and the Caribbean during the 18th and 19th centuries. Sci. Data 4, 170169. doi:10.1038/sdata.2017.169
- Domínguez-Castro, F., Vaquero, J. M., Rodrigo, F. S., Farrona, A. M. M., Gallego, M. C. and co-authors. 2014a. Early Spanish meteorological records (1750–1850). Int. J. Climatol. 34, 593–603. doi:10.1002/joc.3709
- Domínguez-Castro, F., de Miguel, J. C., Vaquero, J. M., Gallego, M. C. and García-Herrera, R. 2014b. Climatic potential of Islamic Chronicles in Iberia: extreme droughts (AD 711–1010). Holocene 24, 370–374. doi:10.1177/0959683613518591
- Founda, D., Kalimeris, A. and Pierros, F. 2014. Multi annual variability and climatic signal analysis of sunshine duration at a large urban area of Mediterranean (Athens). Urban Clim. 10, 815–830. doi:10.1016/j.uclim.2014.09.008
- Guilmet, B. 1931. Observations actinométriques de l’Observatoire Central de l’Indochine a Phu-Liên. Bull Économ l’Indochine. Agric Elevage, Forêts 34, 1114B–1127B.
- Hatzianastassiou, N., Matsoukas, C., Fotiadi, A., Pavlakis, K. G., Drakakis, E. and co-authors. 2005. Global distribution of Earth’s surface shortwave radiation budget. Atmos. Chem. Phys. 5, 2847–2867. doi:10.5194/acp-5-2847-2005
- Herschel, J. F. W. 1844. Tratado de astronomía. Imprenta de la Sociedad Literaria y Tipográfica, Madrid (España).
- Hildreth, W. and Fierstein, J. 2012. The Novarupta-Katmai Eruption of 1912 – Largest Eruption of the Twentieth Century: Centennial Perspectives. US Geological Survey Professional Paper.
- Hoyt, D. V. 1979. Atmospheric transmission from the Smithsonian Astrophysical Observatory Pyrheliometric measurements from 1923 to 1957. J. Geophys. Res. 84, 5018–5028. doi:10.1029/JC084iC08p05018
- IPCC. 2013. Climate change 2013: the physical science basis. In: Contribution of Working Group I to the Fifth Assessment Report of the Intergovernmental Panel on Climate Change (eds. T. F. Stocker, D. Qin, G.-K. Plattner, M. Tignor, S. K. Allen, J. Boschung, et al.), Cambridge, United Kingdom and New York.
- Iqbal, M. 1983. An Introduction to Solar Radiation.Elsevier, New York, USA.
- Kazadzis, S., Founda, D., Psiloglou, B. E., Kambezidis, H., Mihalopoulos, N. and co-authors. 2018. Long-term series and trends in surface solar radiation. Atmos. Chem. Phys. 18, 2395–2411. doi:10.5194/acp-18-2395-2018
- Lachat, D. and Wehrli, C. 2013. Dimming and brightening trends in direct solar irradiance from 1909 to 2010 over Davos, Switzerland: proportions of aerosol and gaseous transmission. J. Geophys. Res. Atmos. 118, 3285–3291. doi:10.1002/jgrd.50344
- Laken, B. A. and Vaquero, J. M. 2015. An early clear sky record from Eastern Spain: 1837–1879. Int. J. Climatol. 35, 999–1006. doi:10.1002/joc.4033
- Lamarque, J.-F., Bond, T. C., Eyring, V., Granier, C., Heil, A. and co-authors. 2010. Historical (1850–2000) gridded anthropogenic and biomass burning emissions of reactive gases and aerosols: methodology and application. Atmos. Chem. Phys. 10, 7017–7039. doi:10.5194/acp-10-7017-2010
- Manara, V., Beltrano, M. C., Brunetti, M., Maugeri, M., Sanchez-Lorenzo, A. and co-authors. 2015. Sunshine duration variability and trends in Italy from homogenized instrumental time series (1936–2013). J. Geophys. Res. Atmos. 120, 3622–3641. doi:10.1002/2014JD022560
- Marié-Davy, M. H. 1875. Instructions pour les observations météorologiques. Bull. Mens. l’Observatoire Mont. IV, 237–261.
- Matuszko, D. 2014. Long-term variability in solar radiation in Krakow based on measurements of sunshine duration. Int. J. Climatol. 34, 228–234. doi:10.1002/joc.3681
- McConnell, J. R., Edwards, R., Kok, G. L., Flanner, M. G., Zender, C. S. and co-authors. 2007. 20th-century industrial black carbon emissions altered Arctic climate forcing. Science 317, 1381–1384. doi:10.1126/science.1144856
- Novakov, T., Ramanathan, V., Hansen, J. E., Kirchstetter, T. W., Sato, M. and co-authors. 2003. Large historical changes of fossil-fuel black carbon aerosols. Geophys. Res. Lett. 30, 1324.
- Ohmura, A. 2009. Observed decadal variations in surface solar radiation and their causes. J. Geophys. Res. 114, D00D05.
- Ohvril, H., Teral, H., Neiman, L., Kannel, M., Uustare, M. and co-authors. 2009. Global dimming and brightening versus atmospheric column transparency, Europe, 1906–2007. J. Geophys. Res. 114, D00D12.
- Russak, V. 2009. Changes in solar radiation and their influence on temperature trend in Estonia (1955–2007). J. Geophys. Res. 114, D00D01.
- Sanchez-Lorenzo, A. and Wild, M. 2012. Decadal variations in estimated surface solar radiation over Switzerland since the late 19th century. Atmos. Chem. Phys. 12, 8635–8644. doi:10.5194/acp-12-8635-2012
- Sanchez-Lorenzo, A., Wild, M., Brunetti, M., Guijarro, J. A., Hakuba, M. Z. and co-authors. 2015. Reassessment and update of long-term trends in downward surface shortwave radiation over Europe (1939–2012). J. Geophys. Res. Atmos. 120, 9555–9569. doi:10.1002/2015JD023321
- Sanchez-Lorenzo, A., Wild, M. and Trentmann, J. 2013. Validation and stability assessment of the monthly mean CM SAF surface solar radiation dataset over Europe against a homogenized surface dataset (1983–2005). Remote Sens. Environ. 134, 355–366. doi:10.1016/j.rse.2013.03.012
- Stanhill, G. and Achiman, O. 2017. Early global radiation measurements: a review. Int. J. Climatol. 37, 1665–1671. doi:10.1002/joc.4826
- Stanhill, G. and Cohen, S. 2001. Global dimming: a review of the evidence for a widespread and significant reduction in global radiation with discussion of its probable causes and possible agricultural consequences. Agr. Forest Meteorol. 107, 255–278. doi:10.1016/S0168-1923(00)00241-0
- Stanhill, G. and Cohen, S. 2005. Solar radiation changes in the United States during the twentieth century: evidence from sunshine duration measurements. J. Climate 18, 1503–1512. doi:10.1175/JCLI3354.1
- Stanhill, G. and Cohen, S. 2008. Solar radiation changes in Japan during the 20th century: evidence from sunshine duration measurements. J. Meteorol. Soc. Jpn. 86, 57–67. doi:10.2151/jmsj.86.57
- Wild, M. 2005. From dimming to brightening: decadal changes in solar radiation at Earth’s surface. Science 308, 847–850. doi:10.1126/science.1103215
- Wild, M. 2009. Global dimming and brightening. In: Handbook of Global Environmental Pollution (ed. B. Freedman), Springer, Dordrecht.