
 ?Mathematical formulae have been encoded as MathML and are displayed in this HTML version using MathJax in order to improve their display. Uncheck the box to turn MathJax off. This feature requires Javascript. Click on a formula to zoom.
Abstract
The influence of shipping on air quality over the Southern Baltic Sea was investigated by characterizing the horizontal and vertical distribution of aerosols and trace gases using airborne measurements in the summer of 2015. Generally, continental and anthropogenic emissions affected the vertical distribution of atmospheric pollutants, leading to pronounced stratification in and above the marine boundary layer and controlling the aerosol extinction. Marine traffic along the shipping corridor “Kadet Fairway” in the Arkona Basin is shown to influence the presence and properties of both trace gases and aerosol particles in the lowest atmospheric layer. Total particle number concentration and NOy mixing ratio increased in the corridor plumes, relative to background, by a factor 1.55 and 3.45, respectively. Titration, triggered by the enhanced presence of nitrogen compounds, led to a median ozone depletion of 19% in the corridor plumes. The enforcement of the Sulphur Emission Control Area (SECA) might be responsible for the minor sulphur dioxide increase (20%) in the corridor plumes. Ship traffic caused a minor enhancement of black carbon mass concentration, estimated to be around 10%. The study of individual ship plumes indicated that ship emitted aerosol was substantially different from background aerosol: fresh ship exhaust was preferentially enriched in aerosol particles with diameters below 100 nm and in black carbon particles with core diameters above 300-400 nm. With the present work the impact of marine traffic on the concentration and properties of atmospheric components within the marine boundary layer over the open water of the Southern Baltic Sea is assessed with airborne observations for the first time. Due to the high uncertainty affecting the estimations of ship emissions, this dataset represents a valuable reference for the assessment of ship emission inventories and related environmental-climatic impacts on the Southern Baltic Sea.
1. Introduction
The Baltic Sea environment has changed remarkably in the past few decades, showing warming of surface atmospheric temperature (Rutgersson et al., Citation2015), sea eutrophication (Andersen et al., Citation2017), and a strong acidification of surface waters (Brutemark et al., Citation2011). Anthropogenic forcers such as greenhouse gases and aerosol particles contribute to such processes (HELCOM, Citation2018a).
Besides continental emissions, marine traffic is responsible for up to 30%, 20% and 6% of NO2, SO2, and PM2.5 annual concentrations in the Baltic Sea respectively (Karl et al., Citation2019). The contribution drastically increases in the vicinity of major shipping lanes, where marine traffic is responsible for up to 80% of the total SO2 and NOx concentrations and approximately 20% of PM2.5 concentration (Claremar et al., Citation2017). As a consequence, the Baltic shipping sector can influence the radiative budget, promote sea acidification as well as eutrophication, and degrade the coastal air quality. No estimates of radiative forcing due to ship exhaust in the Baltic Sea are available at present. The acidification of Baltic Sea water caused by the ship exhaust is approximately one order of magnitude lower than by the continental emissions (Omstedt et al., Citation2015). Intense ship traffic may impact the human health by shortening of 0.1-0.2 years the life expectancy in the coastal areas of the Baltic Sea (Jonson et al., Citation2015). However, ship emissions and subsequent environmental and climatic impacts on the Baltic Sea are expected to change in the future. First of all, the growing trend of marine traffic is expected to continue over the next 20 years (HELCOM, Citation2018b). Thus, due to the combination of decreasing land-based emissions, shipping will become the major acidification source of the Baltic Sea (Turner et al., Citation2017), especially with the implementation of open-loop scrubbers (Claremar et al., Citation2017). The environmental emission policies such as the Sulphur Emission Control Area (SECA, enforced since 2015) and the incoming Nitrogen Emission Control Area (NECA, planned from 2021) will modify the gas phase composition of ship exhaust, which will be dominated by CO2 and expected to shift from a cooling to a warming effect (Fuglestvedt et al., Citation2009). On the other hand, it is noted that the implementation of the nitrogen emission control area in the Baltic Sea will improve the overall air quality and reduce the “year of lives lost” index (Jonson et al., Citation2015).
Several studies investigated the presence and variability of trace gases and aerosol particles in the Baltic Sea region with in-situ ground observations (Kikas et al., Citation1996; Kuśmierczyk-Michulec et al., Citation2001; Ovadnevaitė et al., Citation2007; Kikas et al., Citation2008) and shipborne observations (Plauškaitė et al., Citation2017). The influence of intense marine traffic along the shipping corridors on the presence and properties of atmospheric pollutants (defined as ‘shipping corridor effect’; Schlager et al., Citation2006) in the Baltic Sea was assessed from coastal ground based observations only (Kecorius et al., Citation2016; Ausmeel et al., Citation2019). To the best of the authors’ knowledge, no airborne nor in-situ observations of shipping corridor effect over open water were ever conducted in the Southern Baltic Sea. However, the studies conducted by Schlager et al. (Citation2006) and Petzold et al. (Citation2008) dealt with the ‘shipping corridor effect’ with in-situ observations over the open water of the English Channel and reported that high vessel density may control the presence of trace gases and aerosol particles in open water on a local scale. Due to the scarcity of studies addressing the influence of ship emissions on the local air quality by in-situ measurements, we aim to provide a better characterization of the spatial and vertical distribution of aerosol and trace gases over the Southern Baltic Sea. We particularly focus on the local influence of a shipping corridor on the presence as well as properties of atmospheric pollutants through airborne observations.
2. Methods
In this section, the airborne operations, aerosol and trace gas measurements, and back trajectory analysis are described. A full list of the in-situ observations, subsequent nomenclature and implemented technique is provided in .
Table 1. List of observed properties, deployed instrumentation and consequent nomenclature adopted in the present study. The operational time resolution of both trace gas and aerosol measuring instruments was of 1 second.
2.1. Airborne operations
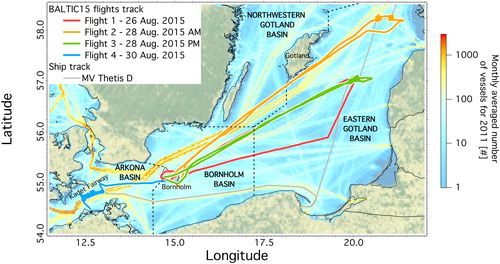
The airborne BALTIC’15 campaign took place in summer 2015, between 26 and 30 August. Four airborne surveys were performed with the Alfred Wegener Institute research aircraft “Polar 5” (Herber et al., Citation2012). We focused on the main sectors of the Southern Baltic Sea: the Arkona, the Bornholm, the Eastern Gotland, and the North Western Gotland Basins (). Flight 1 (afternoon of 26 August) covered a large area of the Bornholm and Eastern-Gotland Basins. Flights 2 and 3 took place in the morning and afternoon of 28 August, respectively. Both flights covered the north-eastern part of the Bornholm Basin and the central part of the Eastern Gotland Basin. In the morning of 30 August (Flight 4), measurements were performed in the Arkona Basin, south-west of the Bornholm Island and intersected the shipping corridor “Kadet Fairway”. All research flights covered a similar altitude range, between 60 and 1200 m asl, and lasted approximately 4 hours with a horizontal speed between 50 and 110 m s−1. A few attempts at sampling the direct exhaust from the container ship MV Thetis D were made during the campaign, however, only the encounters with the MV Thetis D and other ships within the “Kadet Fairway” will be discussed. The operational time resolution of both trace gas and aerosol measuring instruments was 1 second. However, in order to investigate the size distribution of aerosol and black carbon particles with robust counting statistic, data were averaged over 10 seconds.
Figure 1. Map of the Baltic Sea including vessels density for 2011 (HELCOM) and the flight patterns of the AWI research aircraft Polar 5 during the BALTIC’15 campaign. The grey line represents the track of the cargo vessel “Thetis D”.
2.2. Aerosol measuring instrumentation
Aerosol properties, their instrumentation, and reported units, together with the abbreviation used in the present study, are listed in . All aerosol observations refer to standard temperature and pressure (273.15 K, 1013.25 hPa). Aerosols were sampled through a shrouded inlet diffuser (diameter 0.35 cm at intake point), which is the same inlet discussed by Leaitch et al. (Citation2010). For the airspeed range of the present study, the particle transmission by the inlet is near unity for particles from 20 nm to 1 μm diameter. The intake was connected inside the cabin to a 1.9 cm outer diameter stainless steel manifold from which sample lines were fed to the various instrument racks using angled connectors. The total flow at the intake point was approximately isokinetic at 55 L min−1 based on the sum of flows drawn by the instrumentation (35 L min−1) and the measured manifold exhaust flow. The manifold exhaust flowed freely into the back of the cabin such that the intake flow varied with aircraft true airspeed and the manifold was not significantly over pressurized.
2.2.1. Aerosol number concentration and size distribution
The deployed IAGOS (In-service Aircraft for a Global Observing System; Petzold et al., Citation2015) package for aerosol microphysics included a Condensation Particle Counter (CPC), a denuded CPC (CPCDN) and an Optical Particle Counter (OPC). A complete technical description of all IAGOS aerosol probes is given by Bundke et al. (Citation2015); however, the instrumentation and observed parameters are briefly discussed as follows. The number concentration of the total aerosol particles (N) with diameter above 13 nm was measured with a CPC (Model 5.411, GRIMM Aerosol Technik, Ainring, Germany). The number concentration of non-volatile particles (Dp>13 nm) was measured using a second GRIMM CPC equipped with a thermodenuder inlet heated at 250 °C. The residence time of 1 second at temperature higher than 235 °C ensured the evaporation of 93% of volatile particles. The number concentration of volatile particles (Nv) was then calculated as the difference between the total and non-volatile number particle concentrations. Qualitative information of the aerosol mixing state can be derived from the fraction of volatile particles (FV), which was calculated as the ratio of Nv over N. The OPC (Model 1.12, GRIMM Aerosol Technik, Ainring, Germany) provided the number size distribution of particles with optical diameter (DOpt) between 250 nm and 2500 nm. Beside the IAGOS OPC, a second aerosol optical spectrometer, the Ultra High Sensitivity Aerosol Spectrometer (UHSAS, Droplet Measurement Technologies, Longmont, CO, USA) was also operated. The UHSAS, described by Cai et al. (Citation2008), allows a 100% counting efficiency of particles having optical diameters between 60 and 1000 nm. Due to low signal-to-noise ratio at small sizes, the concentration and size distribution estimated from the UHSAS in this work are valid within the optical diameter range of 80-1000 nm.
By merging the CPC data with the UHSAS and the OPC data it was possible to calculate the contribution of different aerosol size modes to the total aerosol number concentration. The aerosol concentration of coarse particles having a diameter between 1000 and 2500 nm was extracted directly from the OPC measurements and here after abbreviated as NCrs. The number concentration of particles in the accumulation mode, between 100 and 1000 nm, was extracted by the UHSAS measurements and called NAcc. The number concentration of the Aitken particles (NAit), spanning between 13 and 100 nm was calculated as the difference between the total aerosol number concentration, measured with the CPC, and the sum of the NAcc and NCrs. By normalizing NAit, NAcc, NCrs over N, it was possible to calculate the relative contribution of the different aerosol size modes (Aitken, Accumulation and Coarse) to the total particle concentration. Due to the low contribution of super micron particles to the total aerosol number concentration over the Baltic Sea (Kuśmierczyk-Michulec and Marks, Citation2000) the potential positive bias in NAit induced by the possible presence of particles larger than 2500 nm was here considered marginal and thus ignored.
2.2.2. Refractory black carbon
The single particle soot photometer (SP2, Droplet Measurement Technologies, Longmont, CO, USA) was used to determine concentration and size distribution of refractory black carbon particles (rBC). Briefly, the SP2 is based on the laser-induced incandescence technique that allows quantifying the mass of refractory BC-containing particles despite the presence of other non-absorbing or non-refractory components. The operation principles are given by Stephens et al. (Citation2003). The calibration of the incandescence and scattering signal was performed using size selected (with a differential mobility analyser) fullerene soot particles (Alfa Aesar, stock #40971, lot #FS12S011) and monodisperse polystyrene latex spheres (Thermo Scientific), respectively. A complete description of the calibration set-up and standard material properties can be found in Moteki and Kondo (Citation2010), Gysel et al. (Citation2011), Baumgardner et al. (Citation2012) and Laborde et al. (Citation2012b, Citation2012a). The number and mass size distribution, the number concentration (NrBC) and mass concentration (MrBC) of rBC particles were obtained for the rBC cores having a mass between 0.46 and 350 fg. This particle mass range corresponds to a mass equivalent diameter (DrBC) range of 80-720 nm. DrBC was derived from the rBC core mass using a void-free material density of 1800 kg m−3 (Moteki et al., Citation2010). Due to misalignment of the position sensitive scattering detector, the quantification of coating thickness was not possible. Information on rBC mixing state was derived from the lag-time between the occurrence of the scattering and incandescence signals (Subramanian et al., Citation2010 and references therein). Throughout the campaign, the lag-time showed a bimodal distribution with a minimum between the two peaks at 1.3 microseconds. In this work, we considered all the rBC-containing particles showing a lag-time larger than 1.5 microseconds as thickly coated. Due to the occurrence of particle fragmentation in the laser beam (Dahlkötter et al., Citation2014), this approach may be affected by a high uncertainty and it must be considered only semi quantitative. The relative abundance of rBC particles was calculated as the ratio of NrBC over the number concentration derived from the UHSAS (80 nm <DOpt<1000 nm), similar to Schulz et al. (Citation2018) and can be used to identify potential smoke episodes.
2.2.3. Single particle aerosol chemical composition
The chemical composition of single particles was measured with the Aircraft-based Laser Ablation Aerosol Mass Spectrometer ALABAMA (Brands et al., Citation2011; Köllner et al., Citation2017). Single aerosol particles with diameters between approximately 200 and 1000 nm are optically detected, aerodynamically sized and finally ablated and ionized by a 266 nm laser shot. The formed ions are analysed by a bipolar time-of-flight mass spectrometer. During the BALTIC’15 campaign, the ALABAMA recorded 8598 single particle mass spectra, whereby 5082 and 3516 spectra had dual and single (solely positive ions) polarity, respectively. The lack of negative ions might be associated with the high humidity environment (Neubauer et al., Citation1998; Köllner et al., Citation2017). The fuzzy c-means clustering (e.g. Hinz et al., Citation1999) of dual and single polarity mass spectra resulted in 49 groups. About 10% of the data were not classified and are therefore not discussed. Cluster mean mass spectra were assigned to six particle types based on reference mass spectra and identification of marker peaks that were observed in prior ALABAMA laboratory and field studies (Brands et al., Citation2011; Roth et al., Citation2016; Köllner et al., Citation2017; Schmidt et al., Citation2017). The number of obtained particle clusters was reduced by merging clusters of the same particle type. The resulting types are: EC1-, EC2-, K-, Na/Cl-, OC-, and Fe/V-containing particles. The mean mass spectra are given in Figure S1 and Figure S2. Mass spectra of EC1 and EC2 are characterized by positive and negative elemental carbon cluster ions (12C1,24C2,36C3,…,Cn), whereby the EC2 type shows Cn-fragments with n ≤ 5. Mass spectra of EC1 and EC2 are further characterized by less intense organic carbon markers (27C2H3+/CHN+,37C3H+,43C3H7+/CH3CO+/CHNO+), and particularly for EC2 type by secondary markers for sulphate (97HSO4-), nitrate (46NO2-,62NO3-), and ammonium (18NH4+). The K-containing particle type is characterized by a dominant potassium signal (39/41K+) with less intense sodium (23Na+). Mass spectra of Na/Cl particle type are characterized by dominant sodium chloride fragments (23Na+, 46Na2+,62Na2O+, 63Na2OH+, 81/83Na2Cl+) indicating the presence of primary sea spray aerosol (O’Dowd and Leeuw, Citation2007; Prather et al., Citation2013). The mean mass spectrum of OC-containing particle type is dominated by organic carbon cluster ions with less intense elemental carbon, ammonium, potassium, trimethylamine (59(CH3)3N+, 58C3H8N+), nitrate, and sulphate ions. According to laboratory studies of Schmidt et al. (Citation2017), the OC particle type can be associated with secondary organic aerosol. The Fe/V particle type is characterized by dominant peaks at 51V+, 67VO+, and 56/54Fe+ with less intense ion peaks at 58/60Ni+ (Dall’Osto et al., Citation2008). Vanadium might serve as a tracer for ship fuel combustion (Agrawal et al., Citation2008).
2.2.4. Observed and estimated extinction coefficient
The aerosol extinction coefficient (σep) was measured at a wavelength of 630 nm by means of the Cavity Attenuated Phase Shift Particle Extinction Monitor (CAPS-PMex, Aerodyne Research, Billerica, MA, USA). The commercial version of the CAPS is fully described by Massoli et al. (Citation2010) and evaluated by Petzold et al. (Citation2013). During the BALTIC’15 campaign we deployed the airborne version of the CAPS, which was specifically developed for the IAGOS package and validated by de Faria et al. (Citation2017).
By means of the “BHCOAT” code (Bohren and Huffman, Citation1998), which is a numerical implementation of Mie theory, we attempted to reproduce the aerosol extinction coefficient from the observed aerosol size distribution. The size dependent scattering cross-section (Csp) of non-absorbing particles was estimated at 630 nm from particles having a diameter between 100 nm and 2500 nm. The estimated scattering coefficient (σspMie) was then calculated at a wavelength of 630 nm as:
(1)
(1)
where N(DOpt) indicates the number concentration of particles within a specific diameter range. Aerosol number concentrations and particle number size distributions were calculated on 10 seconds intervals from the UHSAS and OPC measurements in the 100-1000 nm and in the 1000-2500 nm diameter ranges, respectively. According to the instruments’ calibration, a refractive index of 1.59, (polystyrene latex standard material), was used for the Mie calculations (de Faria et al., Citation2017). From here forward, the scattering coefficient estimated for NAcc is called σspAcc, while for the NCrs is named σspCrs. Considering that the scattering contribution of black carbon particles should be already included in σspAcc and σspCrs, a second set of calculations was performed in order to determine the absorption of rBC containing particles. Following EquationEquation (2)
(2)
(2) , the absorption coefficient of rBC-containing particles (σapBC) was calculated from the rBC-cores number size distribution observed by the SP2 between a DrBC range of 80-720 nm.
(2)
(2)
Following Bond and Bergstrom (Citation2006), we used 1.95 - 0.79i as refractive index for the rBC cores. In order to account for the absorption enhancement caused by the presence of coatings (e.g. Liu et al., Citation2017), we considered the rBC-containing particles to be internally mixed with a simplified core-shell geometry. Due to the absence of BC coating quantification during the present campaign, we assumed that all rBC particles were homogeneously coated with a shell having a thickness of 44 nm, resulting in the total diameter of rBC coated particles DrBC-C (EquationEquation (2)(2)
(2) ). The chosen coating thickness value is representative of aged rBC particles over central Europe (Laborde et al., Citation2013) and thus, suitable for our estimations. Though the real part of the refractive index of typical coating material was found to vary between 1.43 (OPAC sulphate; Hess et al., Citation1998) and 1.63 (humic like matter; Dinar et al., Citation2008), in order to be consistent with scattering estimation for non-absorbing aerosols, we assumed a refractive index of 1.59 for the coating material. The final contribution of Aitken mode particles to extinction was estimated as the difference between the observed and the Mie calculated accumulation-coarse-rBC particles extinction.
2.3. Gas measuring instrumentation
Trace gases including CO2, NOy, SO2 and O3 were sampled through a backward facing Teflon inlet (9.5 mm inner diameter) that was reduced to 6.4 mm within the cabin. The inlet was connected to a Venturi valve located in the back of the aircraft on the fuselage. Using the forward motion of the aircraft, an average flow of ∼20 l min−1 was maintained in the main inlet line. Carbon dioxide (CO2) was measured with a LI-7200 closed CO2/H2O Analyzer from LI-COR Biosciences GmbH. The measurement principle is based on an optical source emitting infrared light through a chopper filter wheel and the enclosed sample path to a temperature-controlled lead selenide detector. By using the ratio of absorption by carbon dioxide in the sample path to a reference, the density of CO2 and H2O, and thus their mixing ratios can be calculated. The instrument was mounted in a 19”, 3 HE rack mount including additional components for flow control and in-situ calibrations during inflight operations. These calibrations were performed on a regular time interval of 15 to 30 minutes using a NIST traceable calibration gas with a known CO2 concentration at atmospheric levels and a water vapor concentration close to zero. Ozone (O3) was measured with a Dual Beam Ozone Monitor Model 205 from 2B Technologies. Ozone is measured based on the attenuation of UV light at 254 nm passing through two separate 15 cm long absorption cells. The cells are alternately flushed with ambient air and ozone-scrubbed ambient air to determine the respective light intensities (I and I0) which are used to derive the ozone mixing ratios. Sulphur dioxide (SO2) was measured using a Thermo Scientific 43iTLE analyser based on pulsed fluorescence, while reactive nitrogen oxide compounds (NOy) were measured using a Thermo Scientific 42iTLE analyser based on chemiluminescence. For both SO2 and NOy measurements, ambient air was drawn through 6.35 mm diameter PFA tubing. Data were recorded at a time resolution of 1 second and instrument zeros were performed periodically in-flight by passing ambient air through an in-line Koby air purifier cartridge. Calibrations were performed before and after the study with NIST-traceable standards (Scott Marrin Inc.). A summary of the trace gas measurements can be found in .
2.4. Flexpart simulations
The Lagrangian particle dispersion model FLEXible PARTicle (FLEXPART) (Stohl et al., Citation2015) driven by operational data from the European Center for Medium-Range Weather Forecasts (ECMWF) was used to study the history of air masses prior to sampling during BALTIC’15 flights. The ECMWF data have a horizontal grid spacing of 0.25°, 137 vertical hybrid sigma-pressure levels, and 3 hours time resolution. Here, we operated FLEXPART-ECMWF in backward mode to study the recent transport history of air influencing the aircraft-based aerosol and trace gas measurements. FLEXPART-ECMWF output is available every six hours over the 10 days period, with horizontal grid spacing of 0.25 and 5 vertical levels. In backward mode, FLEXPART provides potential emission sensitivity (PES) maps, which show the response function of a source-receptor relationship and measure the simulated concentration at the receptor (i.e. the release point that a source of unit strength in that air volume has for an inert tracer). Moreover, it is proportional to the particles residence time in the output grid cell and its values are given in our case in units of seconds (Seibert and Frank, Citation2004; Stohl, Citation2006). Individual FLEXPART parcels were initialized along the flight track for each five minutes period and then traced back in time for 10 days, providing time-resolved distributions of PES.
3. Results
3.1. Vertical distribution of aerosol and trace gases over the Southern Baltic Sea
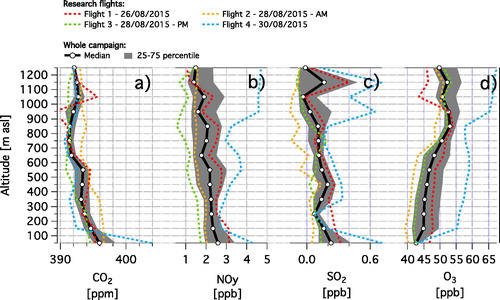
In order to investigate the vertical variability of pollution between the surface and 1200 m asl, statistics of aerosol particles and trace gases were calculated for equally spaced atmospheric layers with a vertical extent of 100 m. Higher vertical resolution was avoided in order to guarantee an acceptable level of statistical significance. However, the data acquired above 700 m asl might be affected by high uncertainty due to low counting statistics. The single flights and campaign averaged vertical profiles of aerosol properties and trace gas concentrations are shown in and , respectively. Although some flight-to-flight variations were observed, most of the aerosol and gas concentrations decreased with altitude. The total number concentration of the aerosol decreased from a median value of 3980 cm−3 at the surface to 2120 cm−3 in the top layer (. The surface observations are comparable to summer observations at sites in southern Scandinavian background (Tunved et al., Citation2003) and Lithuanian coast (Byčenkienė et al., 2013). The campaign median aerosol extinction coefficient decreased by more than a factor of 4 from the surface to the top layer (. However, the decrease was less prominent compared to Continental Europe, where extinction coefficient values at the surface can be one order of magnitude higher than the BALTIC’15 surface median of 11.7 Mm−1 (Morgan et al., Citation2010; Rosati et al., Citation2016). Similarly, the black carbon mass concentration decreased from a surface value of 76 ng m−3 to approximately 30 ng m−3 above 1000 m asl (. The MrBC surface median was in a comparable range with respect to southern Scandinavia in summer, but significantly lower compared to Continental European background sites (Zanatta et al., Citation2016). In addition, the general vertical trend of the trace gases, with the exception of O3, was fairly comparable to the aerosol vertical distribution (). Campaign median CO2 showed a gradual decrease of its mixing ratio from the surface to the highest layer, with a net decrease of 3.4 ppm (. A similar trend was observed for NOy (), with a net decrease from the surface (median of 2.4 ppb) to the uppermost sampled atmospheric level (median of 1.25 ppb). Alhough the mixing ratio of SO2 was extremely low and flights showed a discrete variability (), a vertical decreasing trend from 0.2 ppb to below detection limit was observed. In contrast, the campaign median ozone mixing ratio increased from approximately 40-45 ppb in the lowest 200 m asl to roughly 50 ppb above 800 m asl (. The cause of this vertical increase might be deposition and titration by other chemical species present at the surface (e.g. Brönnimann et al., Citation2000). However, the low availability of photochemically active compounds over the Baltic Sea resulted in high surface ozone concentration and weaker vertical increase compared to the continent (Chevalier et al., Citation2007).
Figure 2. Vertical profiles of each single flight and whole campaign for: (a) aerosol number concentration of particle with diameter larger than 13 nm (N); (b) aerosol extinction coefficient measured at 630 nm (σep); (c) rBC mass concentration of rBC particles with a diameter between 80-700 nm (MrBC). Statistics calculated for equidistant altitude steps starting at the surface (0 m asl) and 100 m thick.
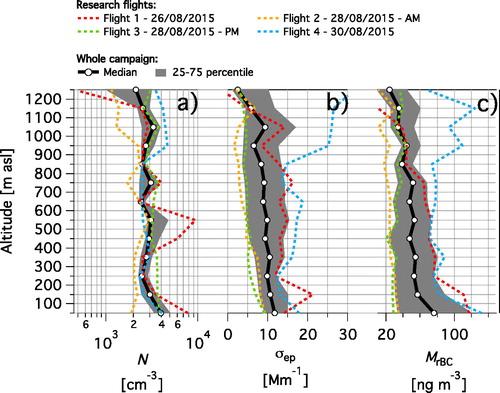
Figure 3. Vertical profiles of each single flight and whole campaign for mixing ratios of: (a) carbon dioxide (CO2); (b) reactive nitrogen compounds (NOy ); (c) sulphur dioxide (SO2); (d) ozone (O3). Statistics calculated for equidistant altitude steps starting at the surface (0 m asl) and 100 m thick.
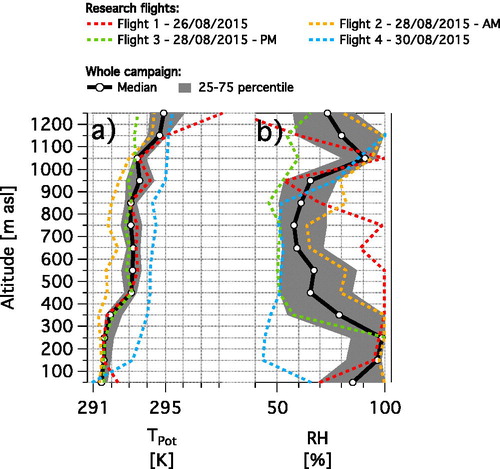
Overall, the flights showed some marked differences in the lowest atmospheric layers, suggesting the influences of different emission regions or source types in the marine boundary layer (MBL) of the Baltic Sea. During all flights, excluding Flight 4, potential temperature profiles showed the presence of a capping inversion between 400 m asl and 600 m asl with enhanced moisture confined below the capping (). This observations are in agreement with previous studies showing that the marine boundary layer over the Baltic Sea during summer extends from the surface to approximately 400-500 m asl (Sempreviva and Gryning, Citation2000; Gryning and Batchvarova, Citation2002). Thus, the observations at altitudes below 400 m asl are expected to be representative of the marine boundary layer over the Baltic Sea in summer. Considering the limited number of studies based on in-situ observations performed over the open water of the Baltic Sea and the importance of pollution levels close to the surface for processes such as sea acidification, sea eutrophication and human health, the properties and concentration of aerosol and trace gases in the MBL (altitude < 400 m asl) were assessed in more details.
Figure 4. Vertical profiles of each single flight and whole campaign for: (a) Potential temperature (TPot); (b) Relative humidity (RH). Statistics calculated for equidistant altitude steps starting at the surface (0 m asl) and 100 m thick.
3.2. Presence and properties of aerosol and trace gases in the Baltic boundary layer
In this part of the work, we investigated the variability of aerosol and trace gases properties in the lowest 400 m of the atmosphere, representative of marine boundary layer conditions (Section 3.1). We first assess the contribution of different particle size modes and aerosol chemical species to the total aerosol extinction coefficient (Section 3.2.1). Second, the occurrence of pollution events is investigated in the Baltic boundary layer as function of longitude (Section 3.2). The data were thus organized in longitudinal bins of 0.5-degree, covering an area spanning between 12°E-54.5°N and 21°E-59°N.
3.2.1. Contribution to extinction in the MBL
The aerosol extinction coefficient measured at a wavelength of 630 nm in the MBL (altitude below 400 m asl) was prone to high variability, with the minimum and maximum median of the entire campaign ranging between 3.5 Mm−1 and 26.9 Mm−1 (. The low correlation coefficient between σep and the total aerosol number concentration (campaign R of 0.16) suggested that the aerosol concentration did not entirely explain the variability of the extinction coefficient, and that other aerosol properties such as particle size might contribute to the observed variability. In fact, as shown in Figure S3, σep exhibited the highest correlation with NAcc (R = 0.76) and the lowest with NAit and NCrs (R < 0.50). It thus appears that, though NAcc contributed up to approximately 30% of the total aerosol number concentration in the MBL (), it might control the overall aerosol extinction. In order to verify this hypothesis, the scattering coefficient of both accumulation (σspAcc) and coarse (σspCrs) particles was calculated at a wavelength of 630 nm from the observed aerosol size distributions by means of Mie theory, as described in Section 2.2.4. The relative contribution to extinction coefficient in the MBL is expressed as the ratio of the scattering coefficient calculated for NAcc and NCrs over the observed extinction coefficient (). σspAcc dominated the overall extinction, accounting for 55% (IQR:45-64%) of the observed extinction, while σspCrs represented only 5.4-11% (IQR) of observed extinction.
Figure 5. Longitudinal variability in the marine boundary layer (altitude below 400 m asl) of: (a) aerosol extinction coefficient measured at 630 nm (σep); (b) aerosol number concentration of particle with diameter larger than 13 nm (N); c) aerosol number fraction of accumulation particles having diameter between 100-1000 nm (FAcc) d) mass concentration of black carbon particles with a diameter between 80-700 nm (MrBC); e) CO2 mixing ratio; (f) NOy mixing ratio; (g) SO2 mixing ratio; (h) O3 mixing ratio. Median and 25-75 % percentiles calculated with 0.5 degrees resolution and displayed as line and shadow, respectively.
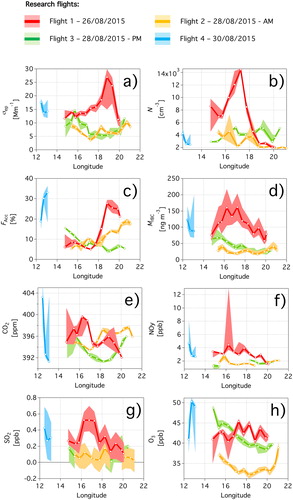
Figure 6. Relative contribution of different aerosol types to the extinction coefficient observed in the marine boundary layer (altitude below 400 m asl): scattering of Aitken, accumulation and coarse mode particles; absorption of BC particles; extinction of accumulation-coarse-rBC particles. Percentage contributions to extinction are calculated as the ratio of scattering-absorption-extinction of the different aerosol components estimated with Mie theory over the extinction coefficient observed with the CAPS at a wavelength of 630 nm. Absolute scattering and absorption coefficient are calculated with Mie theory from the observed total aerosol and rBC size distributions, respectively. Aitken particles: diameter between 10-100 nm; accumulation particle diameter between 100-1000 nm; coarse particle diameter between 1000-2500 nm; rBC particle diameter between 80-700 nm.
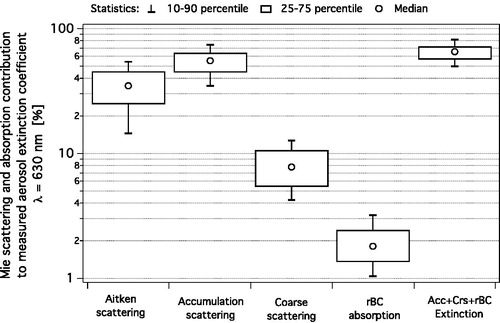
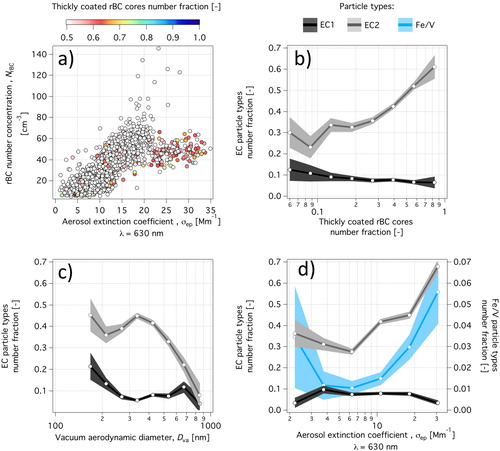
Due to the low number fraction of black carbon particles in the MBL (campaign median below 5%), its absolute contribution to the observed aerosol extinction is expected to be negligible. Nevertheless, SP2 and ALABAMA observations were used to investigate the potential influence of combustion emissions to the aerosol extinction. NrBC and σep showed a monotonic positive proportionality characterised by a correlation coefficient of 0.75 (. Moreover, the highest observed extinction coefficient values were associated with a dominant fraction of thickly coated rBC particles (. This suggests that extinction peaks in the Baltic MBL might be associated with aged and internally mixed aerosol of combustion origin. The dominant presence of aged and internally mixed soot particles in the Baltic boundary layer was confirmed by the ALABAMA data, which indicated that a significant fraction of EC-containing particles (38%) was internally mixed with organic carbon, sulphate, nitrate, and ammonium (EC2 particle type, see mean spectrum in Figure S1b). While EC1 fraction was slightly negatively correlated with the fraction of thickly coated rBC particles measured with the SP2, the EC2 particle type showed a positive correlation (), confirming the internally mixed nature of the EC2 type. This is consistent with previous mass spectrometer measurements attributing a similar particle type to aged and transported soot particles from shipping/refinery (Healy et al., Citation2009; Moffet and Prather, Citation2009; Ault et al., Citation2010). Moreover, the size distribution of the EC2 particle type compared to the EC1 type was shifted towards larger diameters (), suggesting the influence of a different origin or processing of the two EC types. The aerosol extinction coefficient was found to increase with the presence of the aged EC2 type, with the highest extinction observations associated with the highest fraction of EC2 type (60-70%; . Despite the low particle fraction below 1%, Fe/V-containing particles showed an increase with extinction. Similar to EC2 particle type, vanadium containing particles are good tracers for anthropogenic emissions, in particular oil and coal combustion and production (Schlesinger et al., Citation2017). Particularly interesting for marine environments, earlier studies showed the presence of the Fe/V particle type to be associated with ship emission (Agrawal et al., Citation2008; Ault et al., Citation2010; Coggon et al., Citation2012). On the contrary, the fresh EC1 type did not appear to be correlated with the aerosol extinction. The interpretation of SP2 and ALABAMA data indicates that combustion generated aerosol, which underwent atmospheric ageing, might be the driving force of optically thick pollution events in the Baltic MBL. The other aerosol species (OC-, K- and Na/Cl-containing particles), present at diameters larger than 250 nm did not correlate with the aerosol extinction coefficient (not shown here).
Figure 7. Aerosol chemical composition measured by the ALABAMA and rBC mixing measured by the SP2 in the marine boundary layer at altitude below 400 m asl during the whole BALTIC’15 campaign: (a) Comparison between the rBC number concentration measured with the SP2 with the aerosol extinction observations at 630 nm; (b) Comparison between the particle number fractions of EC1 and EC2 types detected with the ALABAMA and the fraction of thickly coated rBC particles quantified with the SP2; (c) Size distribution of EC1 and EC2 particle types; (d) Comparison of the aerosol extinction observations at 630 nm with the particle number fractions of EC1, EC2, and Fe/V types. The particle types fraction was calculated as the number of the identified components normalized to the total number of particles analysed by the ALABAMA. ALABAMA uncertainties, based on binomial statistics, are shown as shadow.
After assessment of the mixing degree of black carbon particles, the light absorption of rBC particles (σapBC) was calculated with Mie theory. As suggested by the SP2 and ALABAMA observations, a consistent fraction of BC particles was internally mixed; hence, the estimation of BC absorption should account for the potential presence of coatings and the resulting lensing effect (Bond and Bergstrom, Citation2006). Absorption of BC was estimated from the rBC number size distribution assuming the entire population of BC to be internally mixed with non-absorbing material in a core shell geometry. The coating thickness was assumed to be constant at 44 nm, as reported for Continental Europe (Laborde et al., Citation2013). Due to the lensing effect, the BC absorption increased up to a factor ∼1.5, close to the upper limit of absorption predicted by Bond et al. (Citation2006) and observed by Liu et al. (Citation2017). As a consequence of the mixing state assumptions (full internally mixed BC population and a homogeneous coating thickness of 44 nm), our estimations represent an upper limit of BC absorption in the Baltic boundary layer. Finally, σapBC was calculated to contribute less than 3.2% (90th percentile) to the observed extinction at 630 nm (). Overall, the scattering (σspAcc and σspCrs) and absorption (σapBC) explained 65% (median) of total extinction in the MBL, with the 90th percentile of 82% (). Thus, although the Aitken mode particles represented between 70-95% of total particles number, their contribution to extinction might be of 35% (campaign median value), making its radiative relevance second after the accumulation mode particles. This estimation might be, however, subject to errors caused by the choice of the refractive index used in the Mie calculation. The refractive index of polystyrene latex spheres might be considerably higher than the one of ambient aerosol, and its use might lead to a systematic overestimation of σspAcc and σspCrs. In order to quantify the potential bias introduced by the assumption of 1.59 as refractive index, additional Mie calculations were performed using a refractive index of 1.53, a medium value representative of continental aerosol (Ebert et al., Citation2002; Stock et al., Citation2011). The use of a smaller refractive index led to a decrease of accumulation-coarse-rBC particles extinction coefficient of 0.6 Mm−1. As a consequence, the Aitken scattering shown in might be systematically underestimated. However, this bias represents, approximately, 7% of the median extinction coefficient observed at 630 nm during the entire BALTIC’15 in the marine boundary layer, and lays within the error of σep observed with a CAPS instrument (10%; Massoli et al., Citation2010). Given that water uptake might induce changes in the aerosol size distribution and optical properties (Seinfeld and Pandis, Citation2006), our extinction estimations did not consider any influence of humidity and are thus representative of the dry aerosol only. Considering the absence of an active drying system at the inlet during the BALTIC’15 campaign, the potential hygroscopic growth induced by RH values of 81% (campaign average) should induce a scattering enhancement of almost 3 times compared to dry conditions in marine environments (Wang et al., Citation2007). Due to the good agreement and correlation between the estimated and observed light extinction coefficients, we might conclude that our measurements did not particularly suffer from the high RH conditions, although we have to state that the sampled aerosol was not completely dried prior to the optical measurements. However, after reducing the dataset to observation showing RH smaller than 50%, the fractional contribution of the different aerosol components to extinction remained largely unchanged.
3.2.2. Spatial variability of pollutants in the MBL
The vicinity of source regions leads to a generally higher temporal and spatial variability of atmospheric pollutants over the Baltic Sea compared to open oceans (Rutgersson et al., Citation2009; Lansø et al., Citation2015; and references therein). In order to understand the potential influence of different sources on aerosol and gas spatial distribution in the MBL over the Southern Baltic Sea, a set of FLEXPART (Stohl et al., Citation2015) simulations in backward mode was performed in the altitude range of 0-400 m asl along the flight patterns. Measurements during Flight 1 (26 August 2015) and Flight 4 (30 August 2015) showed the highest aerosol and trace gases concentration in the MBL (). The high pollution values might be related to influences of continental pollution caused by the low-level transport of air masses over Germany on 26 August, and over northern Poland and northern Germany on 30 August (Figure S4). On 28 August the spatial variability of all investigated properties () was relatively small in the morning (Flight 2) and in the afternoon (Flight 3), and might be related with a reduced influence of continental emissions caused by a more northern transport pattern over the coastal regions and open waters of the North Sea (Figure S4). Moreover, the precipitation event occurring between 27-28 August over the Southern Baltic Sea (Figure S5) might have caused significant washout of atmospheric aerosol particles. In summary, the aerosol and trace gas presence in the Baltic Sea boundary layer showed significant temporal-horizontal variability, being potentially controlled by anthropogenic/continental emissions (26 and 30 August) or being representative of marine background (28 August). Considering the different location and atmospheric conditions, the pollution events observed in the MBL (altitude below 400 m asl) during Flight 1 and Flight 4 will be discussed separately in more details. Due to the feeble changes in the aerosol and trace gases properties, the horizontal variability observed during Flight 2 and Flight 3 will not be additionally discussed.
3.2.2.1. Pollution events over the Bornholm Basin
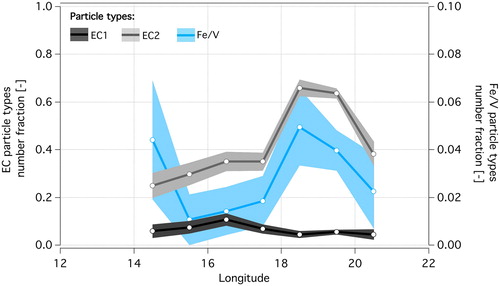
On 26 August, two separate pollution events were observed at altitudes below 400 m asl over open water. The first important feature of Flight 1 is given by enhanced aerosol extinction coefficient values in the longitude range 18-20°E, south of Gotland. The median σep doubled its background value to 26.9 Mm−1 (. This increase was not mirrored by the total particle number concentration, which remained relatively low (. However, the accumulation mode fraction increased from 5-8% to more than 25% above 18°E (. As discussed in Section 3.2.1, the accumulation mode enhancement might easily explain the increase of the total extinction, but does not explain the origin of the plume. Although marine aerosol controls the aerosol extinction background in the lowest 30 m asl over the Baltic Sea, the influence of continental emission on aerosol optical properties under south-western transport, as in the case of Flight 1 (Figure S4), might not be negligible (Zieliński and Zieliński, Citation2002). In fact, a second increase of CO2 and MrBC between 18-20°E suggested the combustion origin of this optically thick aerosol layer ( and . Moreover, the simultaneous increase of the EC2 and Fe/V particle type fractions () confirms the combustion nature of the aerosol. The increase of the EC2 type indicates the rather aged character of the plume, and Fe/V might suggest the influence of ship fuel combustion (Agrawal et al., Citation2008; Ault et al., Citation2010). Nevertheless, vanadium containing particles are emitted by other industrial activities (Schlesinger et al., Citation2017) and due to the limited understanding of the chemical speciation of vanadium in primary aerosol sources (Shafer et al., Citation2012), the direct influence of shipping on this particular extinction event cannot be confirmed.
Figure 8. Longitudinal variability with 1-degree resolution of the single particle chemical composition measured by the ALABAMA in the marine boundary layer observed during Flight 1 on 26 August 2015. Fractions are normalized to the total number of particles detected by the ALABAMA. Uncertainties based on binomial statistics are shown as shadow.
Outstanding N values were observed in the MBL (altitude below 400 m asl) during Flight 1 between 16 and 18°E, where median values reached 14500 cm−3 (. Enhanced N in a similar range was already observed in the South Eastern Baltic Sea and was associated with new particle formation (Plauškaitė et al., Citation2017). Although no specific instrumentation was deployed for the study of nucleation processes during the BALTIC’15, the simultaneous increase of precursors such as NOy () and SO2 () might support the hypothesis of a new particle formation event. In fact, SO2 takes part in the new particle formation as a sulphuric acid precursor (Kulmala et al., Citation2004), and enhanced presence of SO2, together with NO2, was already associated in the past with nucleation events over the Baltic Sea (Ulevicius et al., Citation2002). Though the actual role of SO2 and NO2 in new particles formation over the Baltic Sea is not unanimously verified (Plauskaite et al., Citation2010), other aerosol properties might point to new particle formation event. The low fraction of accumulation mode particles, the predominant presence of Aitken mode particles (∼95%), the high fraction of volatile aerosol component (40%), and the enhanced EC1 type particle fraction () at longitudes below 18°E, suggested the presence of a small and externally mixed aerosol, representative of a fresh aerosol population. Moreover, the increase of tracers of combustion processes such as CO2, NOy and BC suggested that new particle formation over open waters of the Baltic sea might be triggered by pollution plume of anthropogenic combustion origin. Although it would be speculative to argue that ship emissions would contribute to this specific event, it is interesting to note that nucleation episodes on coastal sites of the Baltic Sea can be associated with emission of precursors from ships (Kristensson et al., Citation2008; Hyvärinen et al., Citation2008).
The two events were sampled at different altitudes, whereas N enhancement was observed in the 50-100 m altitude range, the σep enchantment was observed in the top part of the boundary layer (200-400 m asl). Although the altitude of interception and the properties of trace gasses and aerosol indicated the distinct type of the two events, it is evident that combustion activities trigger atmospheric processes leading to a change in both the aerosol properties and gases presence over open waters of the Baltic Sea.
3.2.2.2. Inversion and pollution event over the Arkona Basin
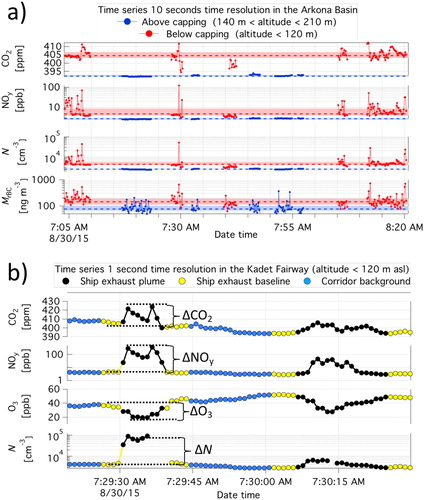
In the morning of 30 August 2015, the aircraft activity covered the area of the Arkona Basin, located south-west of the Bornholm Island. Below 400 m of altitude, the strong median fluctuation and wide interquartile range of the trace gases and aerosol components was particularly remarkable () and suggested the episodic influence of local emission on the air quality of the MBL. The vertical profile of the potential temperature () indicated the presence of an inversion event in the lowest 200 m of altitude. A detailed analysis of the vertical gradient of temperature and relative humidity confirmed the presence of two atmospheric layers separated by a strong capping inversion at approximately 120 m asl. The aircraft crossed the capping multiple times, diving from approximately 200 m asl into the major shipping lane of the Arkona Basin, the “Kadet Fairway”. The five measurement periods below 120 m asl showed enhanced median concentrations of both aerosol and trace gases compared to the four transects above the capping (. As an example, NOy, N and MrBC increased by 77%, 74% and 89% respectively, while σep and SO2 increased by a factor 1.46 and 10, respectively (not shown). On the other hand, the mixing ratio of observed O3 decreased by 25% (not shown). These measurements describe an obviously stratified shallow MBL, with a change in aerosol and gas properties suggesting the dominant influence of anthropogenic emission types at the surface. Though the entrainment of continental airmasses might dominate the aerosol and gas population below capping, this pollution event appeared to be substantially different from the events observed on 26 August and the influence of vessel transit in the “Kadet Fairway” should not be ignored.
Figure 9. Time series of Flight 4 occurred on 30 August 2015 in the Arkona Basin. (a) Time series with 10 seconds time resolution of trace gases and aerosol particles used for the identification of two atmospheric layers separated by a capping at approximately 120 m asl. Dotted line and shading represent the median and interquartile range, respectively. (b) Example of single ship exhaust peaks sampled below capping (< 120 m asl) in the shipping corridor "Kadet Fairway" (1 second time resolution). N: number concentration of particle with diameter larger than 13 nm; MrBC: rBC mass concentration of rBC particles with a diameter between 80-700 nm.
3.3. Ship emissions in the Arkona Basin
3.3.1. The “Kadet Fairway”corridor effect
In this part of the work we aim to assess the impact of intense vessel traffic on the local air quality along the shipping corridor “Kadet Fairway”. Shipping corridors, alternatively called shipping lanes, were already identified as responsible for degrading the air quality of the marine boundary layer over the English Channel. This process was defined as “corridor effect” (Schlager et al., Citation2006; Petzold et al., Citation2008). Though Kecorius et al. (Citation2016) and Ausmeel et al., (Citation2019) assessed the corridor effect on aerosol concentration by means of land-based measurements at coastal sites of Southern Baltic Sea, no in-situ observations of corridor effect over the open Baltic Sea are available in the literature.
During the low-altitude (<120 m asl) measurements of 30 August (), we sampled air within the "Kadet Fairway", which is one of the main gateways to the Baltic Sea, accounting for approximately 160 vessels transiting every day (HELCOM database 2012). A total of 9 periods, lasting between few seconds and a couple of minutes, were directly affected by single or multiple ships exhaust, having an estimated ageing time between 200 and 800 seconds (Section 3.3.2). The enhancement ratios (indicated with E-) of aerosol and gases were calculated as the ratio of the overall median of all ship exhaust plumes and the overall median of the corridor background. This approach should provide a rough estimate of the impact of busy shipping lane on the local air quality. Enhancement ratios for both aerosol and trace gasses are listed in .
Table 2. Statistics of the aerosol and gas concentration-property observed during Flight 4 occurred on 30 August 2015 in the Arkona Basin. First two columns: median values for air sampled in the ship exhaust and in the corridor background. Third column: enchantment ratio (unit less) calculated as the ratio of ship exhaust median over corridor background median.
The increase of SO2 from above to below capping (factor 10, Section 3.2.2.2) and its small enhancement ratio of 1.20 suggest that land-based emissions dominated the concentration of SO2 in the lowest atmospheric level. This result might be in large part a consequence of the recent enforcement of the Sulphur Emission Control Area (SECA; active since January 2015, MARPOL Annex VI), as already verified at coastal sites of the North Sea (Kattner et al., Citation2015; Seyler et al., Citation2017). On the contrary, ship exhaust appeared to be the main contributor to NOy mixing ratio, leading to E-NOy of 3.45. As a consequence of the high concentration of nitrogen oxides, O3 decreased by 19% in the corridor plumes. In fact, ozone might be virtually titrated to zero in ship plumes due to the enhanced presence of NOx (Song et al., Citation2003). Model simulations with high spatial resolution nicely reproduce the ozone titration and subsequent depletion in the proximity of shipping corridors in the Baltic Sea (Karl et al., Citation2019). However, photochemical reactions involving nitrogen oxides, CO and volatile organic compounds lead to ozone production at greater distances from shipping corridors (Karl et al., Citation2019). In model simulations with coarser spatial resolution, this process might control the ozone chemistry and lead to an overall O3 increase of approximately 5% along Baltic Shipping lanes (Aksoyoglu et al., Citation2016).
The total aerosol number concentration in ship plumes increased by a factor 1.55 and was dominated by the smallest particles (E-NAit = 1.67), while no significant change was observed in the accumulation (E-NAit = 0.98) and coarse (E-NAit = 1.03) modes. These findings are confirmed by previous studies: the enhancement of smaller particles (<50 nm) is expected for cargo and passenger ship plumes (Jonsson et al., Citation2011), and the absolute contribution of ship emission to coarse mode particles was observed to be minor (Viana et al., Citation2009). The absolute increase of NAit in ship plumes was estimated to be approximately 2100 cm−3. Due to the vicinity of our observations to the shipping lane, our NAit absolute increase was ∼40% higher than medium-aged (Ausmeel et al., Citation2019) and long-aged (Kecorius et al., Citation2016) ship plumes observed from ground sites in the Southern Baltic Sea. Despite the increase of aerosol concentration, the aerosol extinction coefficient did not show any significant increase in the corridor plumes compared to the corridor background (). The contribution to extinction of Aitken particles increased from 39% to 43%, being compensated by the relative decrease of accumulation extinction from 48% to 54% in the corridor plumes. For our case study we can argue that extinction was dominated by entrainment of continental pollution and that, due to the preferential emission of small particles, shipping did not affect the overall aerosol extinction. Due to the fact that the ALABAMA lower size cut-off is 200 nm, the small diameter of ship emitted particles prevented a chemical “speciation” of extinction, as done in Section 3.2.1. The black carbon mass concentration slightly increased within the shipping corridor (E-MrBC = 1.11; ), suggesting that most of BC observed below capping was emitted by continental sources, rather than marine traffic. Likewise, ships were observed not to be a major contributor of BC concentrations in costal sites of the Falsterbo peninsula in Southwestern Sweden (Ausmeel et al., Citation2019). However, the BC particle type sampled in the corridor plumes appeared to be significantly different from the corridor background. In fact, the rBC mass size distribution was shifted towards larger diameters leading to an increase of the rBC geometric mass mean diameter (DrBC-g) from 195 nm in the background to 225 nm in the corridor plumes (). Although a similar range was observed for several ship plumes by Buffaloe et al. (Citation2014), note that their upper size quantification limit was 300 nm of DrBC, the in-situ observations of ship emitted rBC size distribution are currently constrained to very few publications (e.g. Buffaloe et al., Citation2014; Cappa et al., Citation2014). The variability of rBC particles in ship exhaust will be evaluated in more detail in Section 3.3.2.
3.3.2. Properties of ship exhaust in the "Kadet Fairway"
In this part of the study we aim to evaluate the temporal evolution of ship-emitted gas and aerosol during plume dilution, which can be approximated as function of the excess (Δ) of CO2. The excess of CO2 and other atmospheric pollutants was calculated as the difference between the peak-maximum and peak-baseline of each ship exhaust plume (. Due to the fact that CO2 is inert, after emission it undergoes dilution without additional losses, excluding a negligible downward flux of CO2 caused by ocean uptake. Thus, the excess of CO2 decreases with distance or elapsed time from the emission point and provides a rough indication of the plume “age”. It is important to note that both the baseline and maximum of each individual ship exhaust peak must be clearly resolved. 8 direct ship peaks of both aerosol concentration and trace gas mixing ratio were identified in "Kadet Fairway" at altitude below 120 m asl. Among the 9 plume periods presented in Section 3.3.1, one prolonged case was excluded from the present analysis due to the occurrence of multiple merged peaks, preventing the clear identification of peak base and peak maximum. Finally, due to high background values and slow time response of some instruments, we focused on the clearly distinguishable peaks of CO2, NOy, O3, N, MrBC, DOpt and DrBC. The calculated CO2 excesses ranged from 3 ppm to 18 ppm (). Due to the fact that we sampled plumes belonging to unidentified ships, providing a precise estimation of the plume age would be unrealistic. However, the maximum and minimum observed ΔCO2 might be representative of dilution time of approximately 200 s and 800 s (Schlager et al., Citation2006; Petzold et al., Citation2008). This estimation, based on previous studies, should be considered highly uncertain and only qualitative, especially considering that the high background concentration of CO2 might lead to an overall underestimation of ΔCO2 and thus overestimation of dilution time.
Figure 10. Scatter plot of different exhaust species over the CO2 excess (ΔCO2) for the specific ship plumes observed in the "Kadet Fairway". (a) Reactive nitrogen compounds excess (ΔNOy); (b) ozone excess (ΔO3); (c) number concentration excess of particles with diameter larger than 13 nm (ΔN); (d) mass concentration excess of black carbon particles with diameter between 80-700 nm (ΔMrBC); (e) total particles number mean diameter (DOpt); (f) black carbon mass mean diameter (DrBC). Standard deviation represented as error bars.
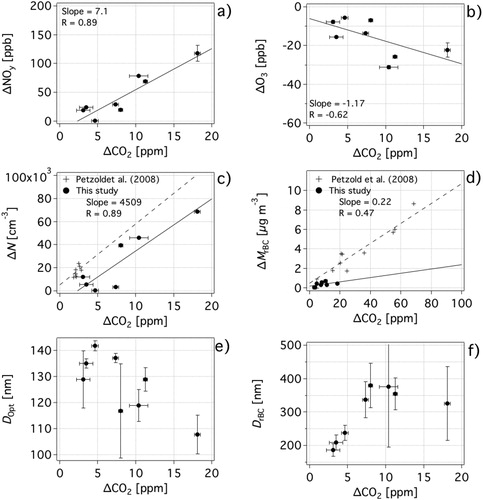
By comparing the excess of different exhaust species with ΔCO2, we investigated the potential evolution of the atmospheric pollutants after emission. The excess values for 8 single ship plumes of different atmospheric components are plotted against ΔCO2 in . ΔNOy showed the best correlation with ΔCO2, suggesting a similar dilution rate as CO2 (. Nevertheless, the high presence of NOy, and thus NO, might trigger the titration of O3, as already reported by Song et al. (Citation2003) and as shown in . In the most fresh plumes (ΔCO2 > 10 ppm and ΔNOy >60 ppb) ozone might decrease by approximately 20-30 ppb, representing a reduction of 50-75% with respect to the “Kadet Fairway” background. However, the chemistry of nitrogen and ozone will most probably change in the near future. In fact, starting from 2021, the North and Baltic Seas will become Nitrogen Emission Control Areas (NECAs; MARPOL, Annex VI). According to model predictions in a business-as-usual scenario the reduction of ship emitted NO will reduce the titration rate of ozone in shipping lanes and decrease the photochemical production of ozone at greater distances from shipping corridors (Karl et al., Citation2019).
ΔN and ΔCO2 shared a similar trend, with a correlation coefficient of 0.71, suggesting a dispersion with limited transformation processes such as new particle formation or intense coagulation (. Nevertheless, the correlation between ΔN and ΔCO2 observed in the “Kadet Fairway” was different compared to aged ship plumes observed in the English Channel, where higher ΔN values were found at parity of ΔCO2 (Petzold et al., Citation2008). The mass concentration excess of rBC also increased with ΔCO2, but showed a low correlation coefficient of 0.47 and smaller ΔMrBC compared to Petzold et al. (Citation2008) (. One of the reasons for the discrepancy between the present work and the results of Petzold et al. (Citation2008) might be the influence of continental emissions, which potentially caused higher background concentration of N, MrBC and CO2, thus leading to an underestimation of the excess values presented in this study. A different reason might be related to the implementation of SECA, which potentially caused the decrease of aerosol and BC particles emission. Nerveless, contradictory results on the impact of distillate fuels on the emission of particulate matter and BC particles are currently present in the literature (Aakko-Saksa and Lehtoranta, Citation2019), leaving several open questions on the impact of control emission areas on the presence and properties of ship emitted aerosols in the Baltic Sea. By means of single particles instruments, it was possible to investigate the evolution of both aerosol and rBC particles diameter during plume ageing. Aerosol number mean optical diameter (DOpt) increased with dilution (. This might be due to a combination of coagulation and mixing of background particles within the more aged plumes. In contrast to the diameter of the total aerosol particles, larger rBC cores were found to correspond to high CO2 excess (), suggesting that ship traffic was responsible for emission of large BC particles. After dilution (e.g. with decreasing ΔCO2) the mean DrBC decreased towards the corridor average (DrBC-g =195 nm; ).
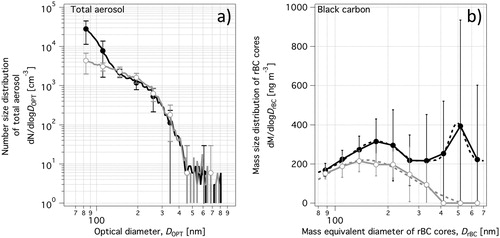
The size distribution of rBC (80 nm < DrBC < 720 nm) and total aerosol particles (80 nm < DOpt < 1000 nm) particles was averaged for 4 peaks showing a ΔCO2 > 10 ppm (dilution time < 300 s) and for 3 peaks showing a ΔCO2 < 5 ppm (dilution time > 800 s), representative of fresh and more aged ship exhausts, respectively (). The particle size distributions in the shipping corridor might evolve due to a combination of coagulation and dilution processes (Russell et al., Citation1999). While coagulation plays a major role in the depletion of particles with diameter below 50-60 nm; dilution simultaneously drives the decrease of small aerosol particles and the increase of accumulation mode particles in the first 100 s from emission, due to blending of background aerosol within the plume (Tian et al., Citation2014). During the BALTIC’15, the aerosol particles population in the fresh plumes (ΔCO2 > 10 ppm) was clearly dominated by small particles (DOpt < 100 nm, ), in agreement with previous fresh ship plumes observations (Petzold et al., Citation2008). Nevertheless, a remarkable decrease of the smaller particles (DOpt < 100 nm) and a slight enhancement of accumulation mode particles were observed in more diluted plumes (ΔCO2 < 5 ppm). This evolution agrees with the simulation of Tian et al. (Citation2014), indicating an “ageing process” controlled by dilution. Different behaviour was observed concerning rBC particles (. In the diluted plumes the rBC size distribution was monomodal and showed a wide peak in the 150-200 nm diameter range. On the other hand, in the less aged plumes, the size distribution was bimodal with the second mode peaking at ∼500 nm of DrBC. As a consequence, the large majority of the BC mass concentration was contained in particles larger than 200 nm of DrBC. The absolute absence of the large BC particles in the older plumes might be explained by their extremely scarce number abundance, which, especially after dilution, makes their sampling probability very low. Although previous in situ observations did not report a second peak at larger DrBC (Buffaloe et al., Citation2014), recent laboratory tests (Corbin et al., Citation2018) confirmed that vessel engines running on heavy fuel oil emit large BC cores. Under such conditions, the rBC size volume distribution is bimodal, with geometric mean of the smaller and larger peak of 150 nm and 640 nm respectively.
Figure 11. Averaged mass size distribution observed in fresh ship plumes (ΔCO2>10 ppm) and in more diluted plumes (ΔCO2<5 ppm) for (a) total aerosol particles measured with the UHSAS and (b) refractory black carbon cores measured with the SP2. Standard deviation displayed as error bars and lognormal fit (only for refractory black carbon) as dotted line.
4. Conclusion
The presence of aerosol particles and trace gases was assessed above the Southern Baltic Sea by means of airborne observations in summer 2015. Vertical profiles and FLEXPART simulations suggested the establishment of three different regimes: polluted conditions with a layered atmosphere under continental influence on 26 August, a clean and well mixed atmosphere with negligible continental influence on 28 August and a shallow marine boundary layer affected by intense shipping on 30 August.
Entrainment of continental air masses caused intense and distinct pollution events over the open water of the Bornholm Basin, potentially related to new particle formation or characterized by high extinction coefficient. The most optically thick events were associated with a dominant fraction of thickly coated rBC particles, and related with elemental carbon particle type internally mixed with organic carbon, sulphate, nitrate, and ammonium, and with Fe/V particle type, indicating aged and processed anthropogenic emissions.
The so-called “shipping corridor effect” was found to affect the presence and properties of both aerosol and trace gases in the marine boundary layer in the Arkona Basin. The intense marine traffic within the "Kadet Fairway" contributed to the enhancement of the total aerosol number concentration (factor 1.55) and, of combustion generated species such as black carbon (factor 1.11), NOy (factor 3.45) and SO2 (factor 1.20) in the lowest atmospheric layer. However, the rather small increase of rBC and SO2 in the corridor plumes suggested land-based emissions to be the major sources of these particular pollutants over the Arkona Basin.
The analysis of single ship plumes indicated that the ship corridor affected, on local scale, the size distribution of the total aerosol and black carbon particles. In the fresh ship exhausts aerosol was enriched in sub-150 nm particles, while the black carbon mass size distribution was shifted towards larger diameters. In fact, the black carbon particles sampled in the less diluted exhausts showed a bimodal size distribution, with one mode below 200 nm, comparable to background, and a second mode around 500 nm, attributable to ship emission only. Moreover, the high excess of NOy in fresh ship plumes triggered an efficient titration of ozone, which decreased by a maximum of 75% compared to the corridor background mixing ratio. However, the implementation of nitrogen emission restrictions will potentially decrease the ozone titration rate along shipping corridors in the near future.
With the general assessment on the variability of aerosol and trace gases, and the study of a shipping corridor over the Sothern Baltic Sea, we provide evidence that intense shipping clearly influences the level and properties of atmospheric pollutants on a local scale. Such impact is of great interest for subsequent sea acidification, the radiative budget and air quality issues.
Acknowledgments
Special thanks go to the Kenn Borek Air Ltd and the AWI aircraft engineers for ensuring the flight operations, and to the crew of the “Thetis D” and the Drevin Bereederungs- GmbH & Co. KG for the ship operations. The authors would also like to thank Hans-Christian Clemen (MPI-C) and Dirk Kalmbach (AWI) for their support during the integration phase in Bremerhaven.
Data availability
The data that support the findings of this study are openly available in the PANGAEA database. Trace gas concentration, aerosol and blak carbon concetration and size distribution data can be downloaded at https://doi.org/10.1594/PANGAEA.908088. Aerocol chemical composition data can be downloaded at https://doi.pangaea.de/10.1594/PANGAEA.908041.
Additional information
Funding
Related Research Data
References
- Aakko-Saksa, P. and Lehtoranta, K. 2019. Ship emissions in the future – review, [online]. Online at: https://cris.vtt.fi/en/publications/ship-emissions-in-the-future-review (Accessed 9 October 2019).
- Agrawal, H., Malloy, Q. G. J., Welch, W. A., Wayne Miller, J. and Cocker, D. R. III, 2008. In-use gaseous and particulate matter emissions from a modern ocean going container vessel. Atmos. Environ. 42, 5504–5510. 2008. doi:10.1016/j.atmosenv.2008.02.053
- Aksoyoglu, S., Baltensperger, U. and Prévôt, A. S. H. 2016. Contribution of ship emissions to the concentration and deposition of air pollutants in Europe. Atmos. Chem. Phys. 16, 1895–1906. 2016. doi:10.5194/acp-16-1895-2016
- Andersen, J. H., Carstensen, J., Conley, D. J., Dromph, K., Fleming-Lehtinen, V. and co-authors. 2017. Long-term temporal and spatial trends in eutrophication status of the Baltic Sea. Biol. Rev. 92, 135–149.: doi:10.1111/brv.12221
- Ault, A. P., Gaston, C. J., Wang, Y., Dominguez, G., Thiemens, M. H. and co-authors. 2010. Characterization of the single particle mixing state of individual ship plume events measured at the Port of Los Angeles. Environ. Sci. Technol. 44, 1954–1961. doi: 10.1021/es902985h
- Ausmeel, S., Eriksson, A., Ahlberg, E. and Kristensson, A. 2019. Methods for identifying aged ship plumes and estimating contribution to aerosol exposure downwind of shipping lanes, Atmospheric Meas. Tech. Discuss. 1–20. doi:, 2019.
- Baumgardner, D., Popovicheva, O., Allan, J., Bernardoni, V., Cao, J. and co-authors. 2012. Soot reference materials for instrument calibration and intercomparisons: a workshop summary with recommendations. Atmos. Meas. Tech. 5, 1869–1887. 2012. doi:10.5194/amt-5-1869-2012
- Bohren, C. F. and Huffman, D. R. 1998. Classical theories of optical constants, in absorption and scattering of light by small particles, pp. 226–267, Wiley-VCH Verlag GmbH. [online]. Online at: http://onlinelibrary.wiley.com/doi/10.1002/9783527618156.ch9/summary (Accessed 23 March 2015),
- Bond, T. C. and Bergstrom, R. W. 2006. Light absorption by carbonaceous particles: an investigative review. Aerosol Sci. Technol. 40, 27–67. doi:10.1080/02786820500421521
- Bond, T. C., Habib, G. and Bergstrom, R. W. 2006. Limitations in the enhancement of visible light absorption due to mixing state. J. Geophys. Res. 111, D20211. 2006. doi:10.1029/2006JD007315
- Brands, M., Kamphus, M., Böttger, T., Schneider, J., Drewnick, F. and co-authors. 2011. Characterization of a newly developed Aircraft-Based Laser Ablation Aerosol Mass Spectrometer (ALABAMA) and first field deployment in urban pollution plumes over paris during MEGAPOLI 2009. Aerosol Sci. Technol. 45, 46–64.: doi:10.1080/02786826.2010.517813
- Brönnimann, S., Schuepbach, E., Zanis, P., Buchmann, B. and Wanner, H. 2000. A climatology of regional background ozone at different elevations in Switzerland (1992–1998). Atmos. Environ. 34, 5191–5198. doi:10.1016/S1352-2310(00)00193-X
- Brutemark, A., Engström-Öst, J. and Vehmaa, A. 2011. Long-term monitoring data reveal pH dynamics, trends and variability in the Western Gulf of Finland. Oceanol. Hydrobiol. Stud. 40, 91–94. doi:10.2478/s13545-011-0034-3
- Buffaloe, G. M., Lack, D. A., Williams, E. J., Coffman, D., Hayden, K. L. and co-authors. 2014. Black carbon emissions from in-use ships: a California regional assessment. Atmos. Chem. Phys. 14, 1881–1896. 2014. doi:10.5194/acp-14-1881-2014
- Bundke, U., Berg, M., Houben, N., Ibrahim, A., Fiebig, M. and co-authors. 2015. The IAGOS-CORE aerosol package: instrument design, operation and performance for continuous measurement aboard in-service aircraft. Tellus B Chem. Phys. Meteorol. 67, 28339. doi:10.3402/tellusb.v67.28339
- Byčenkienė, S., Ulevicius, V., Prokopčiuk, N. and Jasinevičienė, D. 2013. Observations of the aerosol particle number concentration in the marine boundary layer over the south-eastern Baltic Sea**The research leading to these results has received funding from Lithuanian-Swiss cooperation programme to reduce economic social disparities within the enlarged European Union under project AEROLIT agreement No. CH-3-ŠMM-01/08. Oceanologia 55, 573–597. doi:10.5697/oc.55-3.573
- Cai, Y., Montague, D. C., Mooiweer-Bryan, W. and Deshler, T. 2008. Performance characteristics of the ultra high sensitivity aerosol spectrometer for particles between 55 and 800 nm: Laboratory and field studies. J. Aerosol Sci. 39, 759–769. 2008. doi:10.1016/j.jaerosci.2008.04.007
- Cappa, C. D., Williams, E. J., Lack, D. A., Buffaloe, G. M., Coffman, D. and co-authors. 2014. A case study into the measurement of ship emissions from plume intercepts of the NOAA ship Miller Freeman. Atmos. Chem. Phys. 14, 1337–1352. : 2014. doi:10.5194/acp-14-1337-2014
- Chevalier, A., Gheusi, F. and Delmas, R. 2007. Influence of altitude on ozone levels and variability in the lower troposphere: a ground-based study for Western Europe over the period 2001–2004. Atmos. Chem. Phys. 7, 4311–4326. doi:10.5194/acp-7-4311-2007
- Claremar, B., Haglund, K. and Rutgersson, A. 2017. Ship emissions and the use of current air cleaning technology: contributions to air pollution and acidification in the Baltic Sea. Earth Syst. Dynam. 8, 901–919. 2017. doi:10.5194/esd-8-901-2017
- Coggon, M. M., Sorooshian, A., Wang, Z., Metcalf, A. R., Frossard, A. A. and co-authors. 2012. Ship impacts on the marine atmosphere: insights into the contribution of shipping emissions to the properties of marine aerosol and clouds. Atmos. Chem. Phys. 12, 8439–8458. 2012. doi:10.5194/acp-12-8439-2012
- Corbin, J. C., Pieber, S. M., Czech, H., Zanatta, M., Jakobi, G. and co-authors. 2018. Brown and black carbon emitted by a marine engine operated on heavy fuel oil and distillate fuels: optical properties, size distributions, and emission factors. J. Geophys. Res. Atmos. 123, 6175–6195.: doi:10.1029/2017JD027818
- Dahlkötter, F., Gysel, M., Sauer, D., Minikin, A., Baumann, R. and co-authors. 2014. The Pagami Creek smoke plume after long-range transport to the upper troposphere over Europe – aerosol properties and black carbon mixing state. Atmos. Chem. Phys. 14, 6111–6137.: 2014. doi:10.5194/acp-14-6111-2014
- Dall’Osto, M., Booth, M. J., Smith, W., Fisher, R. and Harrison, R. M. 2008. A study of the size distributions and the chemical characterization of airborne particles in the vicinity of a large integrated steelworks. Aerosol Sci. Technol. 42, 981–991. doi:10.1080/02786820802339587
- Dinar, E., Riziq, A. A., Spindler, C., Erlick, C., Kiss, G. and co-authors. 2008. The complex refractive index of atmospheric and model humic-like substances (HULIS) retrieved by a cavity ring down aerosol spectrometer (CRD-AS). Faraday Discuss. 137, 279–295. discussion 297-318, doi:10.1039/B703111D
- Ebert, M., Weinbruch, S., Rausch, A., Gorzawski, G., Helas, G. and co-authors. 2002. Complex refractive index of aerosols during LACE 98#x2010; as derived from the analysis of individual particles. J. Geophys. Res. Atmospheres 107, LAC 3-1-LAC 3-15. doi:10.1029/2000JD000195
- de Faria, J. P., Bundke, U., Berg, M., Freedman, A., Onasch, T. B. and co-authors. 2017. Airborne and laboratory studies of an IAGOS instrumentation package containing a modified CAPS particle extinction monitor. Aerosol Sci. Technol. 51, 1240–1253. 2017. doi:10.1080/02786826.2017.1355547
- Fuglestvedt, J., Berntsen, T., Eyring, V., Isaksen, I., Lee, D. S. and co-authors. 2009. Shipping emissions: from cooling to warming of climate—and reducing impacts on health. Environ. Sci. Technol. 43, 9057–9062. doi:10.1021/es901944r
- Gryning, S.-E. and Batchvarova, E. 2002. Marine boundary layer and turbulent fluxes over the Baltic Sea: measurements and modelling. Bound.-Layer Meteorol. 103, 29–47. doi:10.1023/A:1014514513936
- Gysel, M., Laborde, M., Olfert, J. S., Subramanian, R. and Gröhn, A. J. 2011. Effective density of Aquadag and fullerene soot black carbon reference materials used for SP2 calibration. Atmos. Meas. Tech. 4, 2851–2858. 2011. doi:10.5194/amt-4-2851-2011
- Healy, R. M., O'Connor, I. P., Hellebust, S., Allanic, A., Sodeau, J. R. and co-authors. 2009. Characterisation of single particles from in-port ship emissions. Atmos. Environ. 43, 6408–6414. 2009. doi:10.1016/j.atmosenv.2009.07.039
- HELCOM. 2018a. HELCOM:: State of the Baltic Sea – Second HELCOM holistic assessment 2011–2016.
- HELCOM. 2018b. HELCOM: Assessment on maritime activities in the Baltic Sea 2018, 256.
- Herber, A. B., Haas, C., Stone, R. S., Bottenheim, J. W., Liu, P. and co-authors. 2012. Regular airborne surveys of Arctic sea ice and atmosphere. Eos Trans. Am. Geophys. Union. 93, 41–42. 2012. doi:10.1029/2012EO040001
- Hess, M., Koepke, P. and Schult, I. 1998. Optical Properties of Aerosols and Clouds: The Software Package OPAC. Bull. Amer. Meteor. Soc. 79, 831–844. > 2.0.CO;2, 1998. doi:10.1175/1520-0477(1998)079<0831:OPOAAC>2.0.CO;2
- Hinz, K.-P., Greweling, M., Drews, F. and Spengler, B. 1999. Data processing in on-line laser mass spectrometry of inorganic, organic, or biological airborne particles. J. Am. Soc. Mass Spectrom. 10, 648–660. doi:10.1016/S1044-0305(99)00028-8
- Hyvärinen, A.-P., Komppula, M., Engler, C., Kivekäs, N., Kerminen, V.-M. and co-authors. 2008. Atmospheric new particle formation at Utö, Baltic Sea 2003–2005. Tellus B. 60, 345–352. doi:10.1111/j.1600-0889.2008.00343.x
- Jonson, J. E., Jalkanen, J. P., Johansson, L., Gauss, M. and Denier van der Gon, H. A. C. 2015. Model calculations of the effects of present and future emissions of air pollutants from shipping in the Baltic Sea and the North Sea. Atmos. Chem. Phys. 15, 783–798. 2015. doi:10.5194/acp-15-783-2015
- Jonsson, Å. M., Westerlund, J. and Hallquist, M. 2011. Size‐resolved particle emission factors for individual ships. Geophys. Res. Lett. 38, L13809. doi:10.1029/2011GL047672
- Karl, M., Jonson, J. E., Uppstu, A., Aulinger, A., Prank, M. and co-authors. 2019. Effects of ship emissions on air quality in the Baltic Sea region simulated with three different chemistry transport models. Atmospheric Chem. Phys. 19, 7019–7053. doi:10.5194/acp-19-7019-2019
- Kattner, L., Mathieu-Üffing, B., Burrows, J. P., Richter, A., Schmolke, S. and co-authors. 2015. Monitoring compliance with sulfur content regulations of shipping fuel by in situ measurements of ship emissions. Atmos. Chem. Phys. 15, 10087–10092. doi:10.5194/acp-15-10087-2015
- Kecorius, S., Kivekäs, N., Kristensson, A., Tuch, T., Covert, D. S. and co-authors. 2016. Significant increase of aerosol number concentrations in air masses crossing a densely trafficked sea area. Oceanologia 58, 1–12.: doi:10.1016/j.oceano.2015.08.001
- Kikas, Ü., Mirme, A., Tamm, E. and Raunemaa, T. 1996. Statistical characteristics of aerosol in Baltic Sea region. J. Geophys. Res. Atmospheres. 101, 19319–19327. doi:10.1029/95JD03758
- Kikas, Ü., Reinart, A., Pugatshova, A., Tamm, E. and Ulevicius, V. 2008. Microphysical, chemical and optical aerosol properties in the Baltic Sea region. Atmospheric Res. 90, 211–222. 2008. doi:10.1016/j.atmosres.2008.02.009
- Köllner, F., Schneider, J., Willis, M. D., Klimach, T., Helleis, F. and co-authors. 2017. Particulate trimethylamine in the summertime Canadian high Arctic lower troposphere. Atmos. Chem. Phys. 17, 13747–13766.: 2017. doi:10.5194/acp-17-13747-2017
- Kristensson, A., Dal Maso, M., Swietlicki, E., Hussein, T., Zhou, J. and co-authors. 2008. Characterization of new particle formation events at a background site in Southern Sweden: relation to air mass history. Tellus B Chem. Phys. Meteorol. 60, 330–344.: 2008. doi:10.1111/j.1600-0889.2008.00345.x
- Kulmala, M., Vehkamäki, H., Petäjä, T., Dal Maso, M., Lauri, A. and co-authors. 2004. Formation and growth rates of ultrafine atmospheric particles: a review of observations. J. Aerosol Sci. 35, 143–176.: doi:10.1016/j.jaerosci.2003.10.003
- Kuśmierczyk-Michulec, J. and Marks, R. 2000. The influence of sea-salt aerosols on the atmospheric extinction over the Baltic and the north seas. J. Aerosol Sci. 31, 1299–1316. doi:10.1016/S0021-8502(00)00032-X
- Kuśmierczyk-Michulec, J., Schulz, M., Ruellan, S., Krüger, O., Plate, E. and co-authors. 2001. Aerosol composition and related optical properties in the marine boundary layer over the Baltic Sea. J. Aerosol Sci. 32, 933–955.: doi:10.1016/S0021-8502(00)00122-1
- Laborde, M., Mertes, P., Zieger, P., Dommen, J., Baltensperger, U. and co-authors. 2012a. Sensitivity of the single particle soot photometer to different black carbon types. Atmos. Meas. Tech. 5, 1031–1043. 2012a. doi:10.5194/amt-5-1031-2012
- Laborde, M., Schnaiter, M., Linke, C., Saathoff, H., Naumann, K.-H. and co-authors. 2012b. Single particle soot photometer intercomparison at the AIDA chamber. Atmos. Meas. Tech. 5, 3077–3097.: 2012b. doi:10.5194/amt-5-3077-2012
- Laborde, M., Crippa, M., Tritscher, T., Jurányi, Z., Decarlo, P. F. and co-authors. 2013. Black carbon physical properties and mixing state in the European megacity Paris. Atmos. Chem. Phys. 13, 5831–5856.: 2013. doi:10.5194/acp-13-5831-2013
- Lansø, A. S., Bendtsen, J., Christensen, J. H., Sørensen, L. L., Chen, H. and co-authors. 2015. Sensitivity of the air–sea CO2 exchange in the Baltic Sea and Danish inner waters to atmospheric short-term variability. Biogeosciences 12, 2753–2772. doi:, 2015. doi:10.5194/bg-12-2753-2015
- Leaitch, W. R., Lohmann, U., Russell, L. M., Garrett, T., Shantz, N. C. and co-authors. 2010. Cloud albedo increase from carbonaceous aerosol. Atmos. Chem. Phys. 10, 7669–7684. doi:, 2010. doi:10.5194/acp-10-7669-2010
- Liu, D., Whitehead, J., Alfarra, M. R., Reyes-Villegas, E., Spracklen, D. V. and co-authors. 2017. Black-carbon absorption enhancement in the atmosphere determined by particle mixing state. Nature Geosci. 10, 184–188. doi:10.1038/ngeo2901
- Massoli, P., Kebabian, P. L., Onasch, T. B., Hills, F. B. and Freedman, A. 2010. Aerosol Light Extinction Measurements by Cavity Attenuated Phase Shift (CAPS) Spectroscopy: Laboratory Validation and Field Deployment of a Compact Aerosol Particle Extinction Monitor. Aerosol Sci. Technol. 44, 428–435. doi:10.1080/02786821003716599
- Moffet, R. C. and Prather, K. A. 2009. In-situ measurements of the mixing state and optical properties of soot with implications for radiative forcing estimates. Proc. Natl. Acad. Sci. 106, 11872–11877. doi:10.1073/pnas.0900040106
- Morgan, W. T., Allan, J. D., Bower, K. N., Esselborn, M., Harris, B. and co-authors. 2010. Enhancement of the aerosol direct radiative effect by semi-volatile aerosol components: airborne measurements in North-Western Europe. Atmos. Chem. Phys. 10, 8151–8171. 2010. doi:10.5194/acp-10-8151-2010
- Moteki, N. and Kondo, Y. 2010. Dependence of laser-induced incandescence on physical properties of black carbon aerosols: measurements and theoretical interpretation. Aerosol Sci. Technol. 44, 663–675. 2010. doi:10.1080/02786826.2010.484450
- Moteki, N., Kondo, Y. and Nakamura, S. 2010. Method to measure refractive indices of small nonspherical particles: application to black carbon particles. J. Aerosol Sci. 41, 513–521. 2010. doi:10.1016/j.jaerosci.2010.02.013
- Neubauer, K. R., Johnston, M. V. and Wexler, A. S. 1998. Humidity effects on the mass spectra of single aerosol particles. Atmos. Environ. 32, 2521–2529. doi:10.1016/S1352-2310(98)00005-3
- O’Dowd, C. D. and Leeuw, G. 2007. de: Marine aerosol production: a review of the current knowledge. Philos. Trans. R. Soc. Lond. Math. Phys. Eng. Sci. 365, 1753–1774. doi:10.1098/rsta.2007.2043
- Omstedt, A., Edman, M., Claremar, B. and Rutgersson, A. 2015. Modelling the contributions to marine acidification from deposited SOx, NOx, and NHx in the Baltic Sea: past and present situations. Cont. Shelf Res 111, 234–249. 2015. doi:10.1016/j.csr.2015.08.024
- Ovadnevaitė, J., Kvietkus, K. and Šakalys, J. 2007. Evaluation of the impact of long-range transport and aerosol concentration temporal variations at the Eastern Coast of the Baltic Sea. Environ. Monit. Assess. 132, 365–375. doi:10.1007/s10661-006-9540-y
- Petzold, A., Hasselbach, J., Lauer, P., Baumann, R., Franke, K. and co-authors. 2008. Experimental studies on particle emissions from cruising ship, their characteristic properties, transformation and atmospheric lifetime in the marine boundary layer. Atmos. Chem. Phys. 8, 2387–2403. doi:10.5194/acp-8-2387-2008
- Petzold, A., Onasch, T., Kebabian, P. and Freedman, A. 2013. Intercomparison of a Cavity Attenuated Phase Shift-based extinction monitor (CAPS PMex) with an integrating nephelometer and a filter-based absorption monitor. Atmos. Meas. Tech. 6, 1141–1151. 2013. doi:10.5194/amt-6-1141-2013
- Petzold, A., Thouret, V., Gerbig, C., Zahn, A., Brenninkmeijer, C. A. M. and co-authors. 2015. Global-scale atmosphere monitoring by in-service aircraft – current achievements and future prospects of the European Research Infrastructure IAGOS. Tellus B Chem. Phys. Meteorol. 68, 28452.
- Plauskaite, K., Ulevicius, V., Spirkauskaite, N., Bycenkiene, S., Zielinski, T. and co-authors. 2010. Observations of new particle formation events in the South-Eastern Baltic Sea. Oceanologia 52, 53–75.: doi:10.5697/oc.52-1.053
- Plauškaitė, K., Špirkauskaitė, N., Byčenkienė, S., Kecorius, S., Jasinevičienė, D. and co-authors. 2017. Characterization of aerosol particles over the southern and South-Eastern Baltic Sea. Mar. Chem. 190, 13–27.: 2017. doi:10.1016/j.marchem.2017.01.003
- Prather, K. A., Bertram, T. H., Grassian, V. H., Deane, G. B., Stokes, M. D. and co-authors. 2013. Bringing the ocean into the laboratory to probe the chemical complexity of sea spray aerosol. Proc. Natl. Acad. Sci. 110, 7550–7555.: doi:10.1073/pnas.1300262110
- Rosati, B., Herrmann, E., Bucci, S., Fierli, F., Cairo, F. and co-authors. 2016. Studying the vertical aerosol extinction coefficient by comparing in situ airborne data and elastic backscatter lidar. Atmos. Chem. Phys. 16, 4539–4554.: doi:, 2016. doi:10.5194/acp-16-4539-2016
- Roth, A., Schneider, J., Klimach, T., Mertes, S., van Pinxteren, D. and co-authors. 2016. Aerosol properties, source identification, and cloud processing in orographic clouds measured by single particle mass spectrometry on a central European mountain site during HCCT-2010. Atmos. Chem. Phys. 16, 505–524.: doi:, 2016. doi:10.5194/acp-16-505-2016
- Russell, L. M., Seinfeld, J. H., Flagan, R. C., Ferek, R. J., Hegg, D. A. and co-authors. 1999. Aerosol dynamics in ship tracks. J. Geophys. Res. Atmospheres 104, 31077–31095.: 1999. doi:10.1029/1999JD900985
- Rutgersson, A., Norman, M. and Åström, G. 2009. Atmospheric CO2 variation over the Baltic Sea and the impact on air–sea exchange. Boreal Enviorn. Res. 14, 238–249.
- Rutgersson, A., Jaagus, J., Schenk, F., Stendel, M., Bärring, L. and co-authors. 2015. Recent Change—Atmosphere, in Second Assessment of Climate Change for the Baltic Sea Basin. Springer, Cham, pp. 69–97.
- Schlager, H., Baumann, R., Lichtenstern, M., Petzold, A., Arnold, F. and co-authors. 2006. Aircraft-based trace gas measurements in a primary European ship corridor. TAC-Conf. Oxf. UK. 83–88.
- Schlesinger, W. H., Klein, E. M. and Vengosh, A. 2017. Global biogeochemical cycle of vanadium. Proc. Natl. Acad. Sci. USA. 114, E11092–E11100. doi:10.1073/pnas.1715500114
- Schmidt, S., Schneider, J., Klimach, T., Mertes, S., Schenk, L. P. and co-authors. 2017. Online single particle analysis of ice particle residuals from mountain-top mixed-phase clouds using laboratory derived particle type assignment. Atmos. Chem. Phys. 17, 575–594.: doi:, 2017. doi:10.5194/acp-17-575-2017
- Schulz, H., Bozem, H., Zanatta, M., Leaitch, W. R., Herber, A. B. and co-authors. 2018. High–Arctic aircraft measurements characterising black carbon vertical variability in spring and summer. Atmos. Chem. Phys. 19, 2361–2384. doi:10.5194/acp-19-2361-2019
- Seibert, P. and Frank, A. 2004. Source-receptor matrix calculation with a Lagrangian particle dispersion model in backward mode. Atmos. Chem. Phys. 4, 51–63. doi:, 2004. doi:10.5194/acp-4-51-2004
- Seinfeld, J. H. and Pandis, S. N. 2006. Atmospheric Chemistry and Physics: From Air Pollution to Climate Change, 2nd Edition, (eds. J. H. Seinfeld and S. N. Pandis). John Wiley & Sons, Inc., Hoboken, New Jersey.
- Sempreviva, A. M. and Gryning, S.-E. 2000. Mixing height over water and its role on the correlation between temperature and humidity fluctuations in the unstable surface layer. Bound.-Layer Meteorol. 97, 273–291. doi:10.1023/A:1002749729856
- Seyler, A., Wittrock, F., Kattner, L., Mathieu-Üffing, B., Peters, E. and co-authors. 2017. Monitoring shipping emissions in the German Bight using MAX-DOAS measurements. Atmos. Chem. Phys. 17, 10997–11023. doi:, 2017. doi:10.5194/acp-17-10997-2017
- Shafer, M. M., Toner, B. M., Overdier, J. T., Schauer, J. J., Fakra, S. C. and co-authors. 2012. Chemical speciation of vanadium in particulate matter emitted from diesel vehicles and urban atmospheric aerosols. Environ. Sci. Technol. 46, 189–195. doi:10.1021/es200463c
- Song, C. H., Chen, G., Hanna, S. R., Crawford, J. and Davis, D. D. 2003. Dispersion and chemical evolution of ship plumes in the marine boundary layer: Investigation of O3/NOy/HOx chemistry. J. Geophys. Res. 4143. doi:10.1029/2002JD002216, D4
- Stephens, M., Turner, N. and Sandberg, J. 2003. Particle identification by laser-induced incandescence in a solid-state laser cavity. Appl. Opt. 42, 3726–3736. doi:10.1364/AO.42.003726
- Stock, M., Cheng, Y. F., Birmili, W., Massling, A., Wehner, B. and co-authors. 2011. Hygroscopic properties of atmospheric aerosol particles over the Eastern Mediterranean: implications for regional direct radiative forcing under clean and polluted conditions. Atmos. Chem. Phys. 11, 4251–4271. doi:. doi:10.5194/acp-11-4251-2011
- Stohl, A. 2006. Characteristics of atmospheric transport into the Arctic troposphere. J. Geophys. Res. 111, D11306. doi:10.1029/2005JD006888
- Stohl, A., Aamaas, B., Amann, M., Baker, L. H., Bellouin, N. and co-authors. 2015. Evaluating the climate and air quality impacts of short-lived pollutants. Atmos. Chem. Phys. 15, 10529–10566.: 2015. doi:10.5194/acp-15-10529-2015
- Subramanian, R., Kok, G. L., Baumgardner, D., Clarke, A., Shinozuka, Y. and co-authors. 2010. Black carbon over Mexico: the effect of atmospheric transport on mixing state, mass absorption cross-section, and BC/CO ratios. Atmos. Chem. Phys. 10, 219–237. 2010. doi:10.5194/acp-10-219-2010
- Tian, J., Riemer, N., West, M., Pfaffenberger, L., Schlager, H. and co-authors. 2014. Modeling the evolution of aerosol particles in a ship plume using PartMC-MOSAIC. Atmos. Chem. Phys. 14, 5327–5347. 2014. doi:10.5194/acp-14-5327-2014
- Tunved, P., Hansson, H.-C., Kulmala, M., Aalto, P., Viisanen, Y. and co-authors. 2003. One year boundary layer aerosol size distribution data from five nordic background stations. Atmos. Chem. Phys. 3, 2183–2205.: 2003. doi:10.5194/acp-3-2183-2003
- Turner, D. R., Edman, M., Gallego-Urrea, J. A., Claremar, B., Hassellöv, I.-M. and co-authors. 2017. The potential future contribution of shipping to acidification of the Baltic Sea. Ambio. 47, 1–11. doi: 10.1007/s13280-017-0950-6
- Ulevicius, V., Mordas, G. and Plauškaitė, K. 2002. Evolution of aerosol particle size distribution in the coastal environment: effect of relative humidity, SO2 and NO2. Environ.Chem. Phys. 24, 13–17.
- Viana, M., Amato, F., Alastuey, A., Querol, X., Moreno, T. and co-authors. 2009. Chemical tracers of particulate emissions from commercial shipping. Environ. Sci. Technol. 43, 7472–7477.: doi:10.1021/es901558t
- Wang, W., Rood, M. J., Carrico, C. M., Covert, D. S., Quinn, P. K. and co-authors. 2007. Aerosol optical properties along the northeast coast of North America during the New England Air Quality Study-Intercontinental Transport and Chemical Transformation 2004 campaign and the influence of aerosol composition: RH-CONTROLLED NEPHELOMETRY MEASUREMENTS. J. Geophys. Res. Atmospheres. 112, D10S23.
- Zanatta, M., Gysel, M., Bukowiecki, N., Müller, T., Weingartner, E. and co-authors. 2016. A European aerosol phenomenology-5: Climatology of black carbon optical properties at 9 regional background sites across Europe. Atmos. Environ. 145, 346–364. 2016. doi:10.1016/j.atmosenv.2016.09.035
- Zieliński, T. and Zieliński, A. 2002. Aerosol extinction and aerosol optical thickness in the atmosphere over the Baltic Sea determined with lidar. J. Aerosol Sci. 33, 907–921. doi:10.1016/S0021-8502(02)00043-5