
 ?Mathematical formulae have been encoded as MathML and are displayed in this HTML version using MathJax in order to improve their display. Uncheck the box to turn MathJax off. This feature requires Javascript. Click on a formula to zoom.
Abstract
Aerosol emissions in South Asia are large. The emitted aerosols can travel significant distances and, during the Asian southwest monsoon especially, are prone to modification through cloud processing and wet scavenging while being transported. The scale of emissions and transport means that the global climate impact of these aerosols are sensitive to modification en route, but the process-level understanding is still largely lacking. In this study, we analyse long-term aerosol data measured at an observatory established in Hanimaadhoo, Republic of Maldives, to investigate the long-term properties of aerosols over the Indian Ocean as well as to understand the effect of precipitation on the aerosol particle size distribution during long-range transport. The observatory location is ideal because it is a receptor site with little local influence, and, depending on the season, receives either polluted air masses coming from the Indian subcontinent or clean marine air masses from the Indian Ocean. We analysed the sub-micron particle number size distribution measured during the years 2004–2008, and 2014–2017, and this is the first inter-seasonal long-term study of the sub-micron aerosol features in the region. The aerosol origin and its relative exposure to wet scavenging during long-range transport were analysed using back-trajectory analysis from HYSPLIT. By comparing aerosol measurements to precipitation along its transport, this study shows that there is a substantial change in particle number size distributions and concentrations depending on the amount of rainfall during transport. During the southwest monsoon season, the aerosol size distribution was notably bi-modal and total particle concentrations clearly reduced in comparison with the prevailing aerosol size distribution during the northeast monsoon season. Precipitation during transport usually corresponded with a greater reduction in accumulation mode concentrations than for smaller sizes, and the shape of the median size distribution showed a clear dependence on the trajectory origin and route taken.
1. Introduction
Aerosol particles are ubiquitous in the Earth’s atmosphere, originating both from natural and anthropogenic sources. After greenhouse gases, aerosols are thought to be the second most important human-induced climate forcing agent and the level of scientific understanding with regards to the mechanisms of the aerosol climate impact is low (Stocker et al., Citation2013).
Aerosols affect climate directly by scattering and absorbing solar radiation, and indirectly by acting as a seed for cloud droplet formation. The quantity and properties of cloud-activated aerosols further modify cloud macroscopic properties such as the reflectivity (Haywood and Boucher, Citation2000; Lohmann and Feichter, Citation2005) and lifetime (Albrecht, Citation1989; Jiang et al., Citation2006). On a global scale, the net aerosol climate impact leads to surface temperature cooling. However, the local and regional impacts are highly variable and thus, any quantitative estimate is subject to very high uncertainties (Stocker et al., Citation2013). The climate impact primarily depends on the quantity of aerosols, while one of the most important properties of an individual aerosol particle, in addition to single-scattering albedo, is its size (Dusek et al., Citation2006).
The aerosol emissions and concentration levels in a global scale are the highest in Asia (Lelieveld et al., Citation2001; Van Donkelaar et al., Citation2010; Zhang and Reid, Citation2010). The concentrations are particularly elevated during the northeast (NE) monsoon when the South Asian aerosol outflow is towards the Indian Ocean. The Indian Ocean Experiment (INDOEX) campaign was one of the first comprehensive studies of the aerosols in this outflow (Ramanathan et al., Citation2001), and was a large-scale scientific experiment consisting of a pre-phase and a series of coordinated measurement and modelling efforts focusing on the year of 1999. The main finding of the campaign was the persistent phenomenon of the Asian ‘brown cloud’ during the NE monsoon where urban-like air pollution was observed over the ocean (Ramanathan and Crutzen, Citation2003). During the pre-INDOEX cruise, the total number concentration of submicron size particles was about an order of magnitude higher close to the coast than over the Indian Ocean (Jayaraman et al., Citation1998). Subsequent research noted that, during the NE monsoon, South and Southeast Asian emissions cause significant air quality degradation over an area of 10 million km2 (Lelieveld et al., Citation2001) and that the most obvious changes in local pollution were due to changes in the air mass origin (Lobert and Harris, Citation2002).
The Atmospheric Brown Cloud project continued the study of the aerosols in the Asian region (Ramanathan and Crutzen, Citation2003). Corrigan et al. (Citation2006) focused on the transition between the southwest (SW) and NE monsoon seasons and investigated the changes in aerosol properties during the transition. A rapid increase in the particle concentration was observed when the air mass origin transitioned to the Indian subcontinent during the NE monsoon.
The gradual concentration decrease and the corresponding changes in aerosol composition during its transport over the Indian Ocean have been studied by several groups since. It has become clear that the quantity of aerosol is not the only property that is changing (e.g. Ramachandran, Citation2004), but also an aerosol brightness increase caused by photochemical ageing during transport (Dasari et al., Citation2019). This has clear implications for the first direct aerosol climate effect.
The likelihood of aerosol particles to activate into cloud droplets, providing an estimate of their indirect climate effect, can be determined from measurements of aerosol particle size and number. Despite intensive scientific efforts, very few long-term aerosol monitoring efforts focusing on these climatically important aerosol properties have been made in the Indian Ocean region to date. The global circulation and chemical transport models that currently include aerosols require better estimates of these important properties to correctly represent the Asian aerosol emissions and to accurately calculate their climate impacts. Moreover, knowledge on aerosol particle number concentrations and particle number size distributions are needed for the parametrization of the aerosol transport processes.
An important aerosol removal process during the SW monsoon is wet scavenging. However, there are uncertainties in how efficiently precipitation can scavenge aerosols from the atmosphere, over which size ranges the removal is the most efficient, and how it affects the long-range aerosol transport (Rasch et al., Citation2000; Textor et al., Citation2006; Koch et al., Citation2009; Liu et al., Citation2012). Wet scavenging coefficients of for rain intensities of
were calculated for
during the winter monsoon season over the Sea of Japan (Okita et al., Citation1996). Andronache (Citation2004) calculated wet scavenging coefficient values ranging between
for
and observed that the wet scavenging coefficient had a significant correlation with the rainfall rate. Wet scavenging ratios were also calculated for different aerosol components, with
having the highest observed scavenging ratio and that the removal of
and
was more efficient with rain intensities around
(Kulshrestha et al., Citation2009). The effect of precipitation on aerosol particle size distribution was studied in the Arctic and it was found that precipitation largely controls the aerosol dynamics (Tunved et al., Citation2013). In this study, our aim is to investigate the effect of precipitation on aerosol size distributions using a similar approach to that of Tunved et al. (Citation2013) but applied here for the first time to the tropical Indian Ocean.
The main objective of this study is to provide long-term statistics of the properties of the aerosol number size distributions measured over the Indian Ocean by combining historical campaign data with recent measurements. A description of the location and the measurement setup are presented in Section 2. In Section 3, all measurements are analysed in the context of the meteorological seasons characteristic for South Asia. The values reported in this study can be considered representative of the surrounding Indian Ocean. This is the first multi-year study of aerosol size distribution data in this region.
2. Instrumentation and methods
2.1. Site description
The measurements presented in this study were obtained from the Maldives Climate Observatory at Hanimaadhoo (MCOH, 678′ N, 73
18′ E) situated in the Indian Ocean approximately 500 km to the south-west from the southernmost tip of India (see ). The MCOH observatory is located in the northern part of the Maldives on Hanimaadhoo island, which is a member of the Thiladhummathi Atoll. The terrain at the measurement site is flat, with the highest point of the island being only two metres above mean sea level. The observatory is surrounded by forest, which consists mostly of palm trees. A detailed site description can be found in previous publications (e.g. Corrigan et al. Citation2006; Ramanathan et al. Citation2007). The observatory is a well-recognised receptor site for the South-Asian outflow and has been utilised in various previous studies to understand the aerosol ageing processes during long-range transport (Dasari et al., Citation2019).
Fig. 1. Location of the Maldives Climate Observatory of Hanimaadhoo (MCOH) in the Indian Ocean.
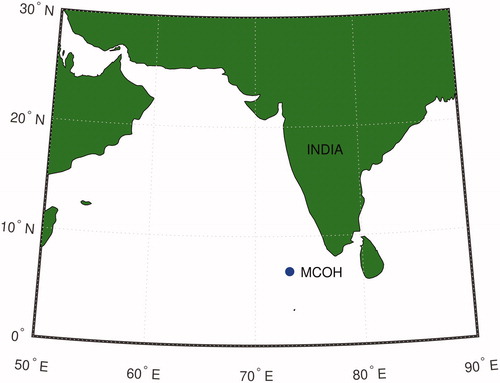
The climate in the Maldives presents two very distinct seasons: NE and SW monsoons. During mid-May to November, the Maldives experiences the SW monsoon, which brings marine air consisting of natural aerosols from the Indian Ocean. During the NE monsoon season, air masses coming to the Maldives originate from the Indian subcontinent, which is highly polluted by various human activities. The full set of seasons that the Maldives experience are determined from the information provided by the Maldives Meteorological Service: NE monsoon season from January to March, pre-monsoon from April to mid-May, SW monsoon from mid-May to November, and post-monsoon during December.
On shorter timescales, the weather variability at the Maldives is affected by the Madden-Julian Oscillation (MJO), which is an eastward moving low-pressure anomaly at the equator associated with a warming of the troposphere, increased tropopause height and increased convection leading to enhanced precipitation (Madden and Julian, Citation1971; Holton and Hakim, Citation2012). One cycle of the oscillation lasts 30–60 days, and it is usually first observed over the Indian Ocean. The timing of the monsoon transitions is often associated with the phase of the MJO (Taraphdar et al., Citation2018).
2.2. Measurements and instrumentation
We analysed surface-based aerosol and meteorological data from two different time periods. The first measurement period (Period 1) consisted of intensive campaigns that took place between the years 2004 and 2008 together with longer term measurements. These measurements were performed as a continuation of the Indian Ocean Experiment (INDOEX, Ramanathan et al., Citation2001).
The second measurement period (Period 2) provides more continuous measurements and, here, we analysed data starting from 18 November 2014, when the instrumentation for aerosol size distribution measurements was installed, until 20 November 2017. Period 2 also includes an intensive campaign: the South Asian Pollution Experiment 2016 (SAPOEX-16, Dasari et al., Citation2019).
Data from both measurement periods were partitioned into the four pre-determined seasons. However, data from December 2004 was included in the NE monsoon season in Period 1 because the physical aerosol properties during this month exhibited the characteristics of the NE monsoon season. This also provided more NE monsoon season data for Period 1 to compare with Period 2.
2.2.1. Aerosol size distribution
During Period 1, fine aerosol particle number size distributions were measured with a Scanning Mobility Particle Sizer (SMPS; TSI Inc., model 3936), which measured particle number size distributions between 10 and 500 nm in 108 size bins with a 5-minute time resolution. The details of this instrument and its operation are given by Corrigan et al. (Citation2006).
During Period 2, a Differential Mobility Particle Sizer (DMPS) measured particle number size distributions in the size range 7–800 nm in 35 size bins with a 10-minute time resolution. The DMPS comprised a 28.5 cm long HAUKE-type Differential Mobility Analyzer (DMA), with a Condensation Particle Counter (CPC; TSI Inc., model 3010) until 23 February 2017 and a model 3772 CPC (TSI Inc.) from there onward. The sample flow rate was and the sheath flow rate was
The measurement setup is described in Budhavant et al. (Citation2018). During the both measurement periods the inlet height was 15 metres above ground level, and the aerodynamic cut-off was
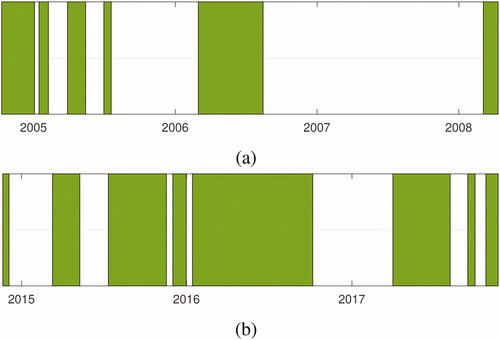
The SMPS data was post-processed as described previously (Corrigan et al., Citation2006). The DMPS data was inverted using a pseudo-inversion method; see Wiedensohler et al. (Citation2012) for details on the inversion method, the instrument specific functions and the parametrizations used in the method. After the inversion, the DMPS data was cleaned manually based on visual inspection of daily data plots. Very high and short concentration peaks were removed from the data to avoid including contamination from local sources in the analysis; this amounted to a very minor fraction of data as, in general, there is little human activity around the measurement location (Ramana and Ramanathan, Citation2006). The target was to keep the DMPS sample flow relative humidity under 40%, but in the humid tropical conditions this limit was difficult to maintain full time. The aerosol sample was dried using a silica gel dryer and the gel was changed by the station manager once the RH exceeded 40%. However, occasionally this required daily replacement of the dryer gel. Hence, we also included data where the sample relative humidity was between 40 and 50% after comparing the median size distributions measured in various RH regimes and concluding that no discernible difference with RH up to 50% could be observed. During Period 1, the total number concentration was additionally measured with a CPC (TSI Inc., model 3022a) that was used for cross-check. A maximum of 20% deviation in total number concentration between the CPC and the SMPS integrated number concentration was permitted, or otherwise the SMPS data were discarded from the further analysis. shows the data coverage of post-processed SMPS and DMPS data for Periods 1 and 2, respectively. Note that the SMPS measurement campaigns cover different seasons and that the multi-year DMPS data coverage from April to September is better than from October to March.
Fig. 2. Measurement periods at MCOH for which (a) SMPS data was available and (b) DMPS data was available.
2.2.2. Meteorological parameters
For Period 1, meteorological parameters, such as wind speed and direction, temperature, pressure and relative humidity, were measured with a R. M. Young weather station that provided data at an hourly time resolution. During years 2014–2015, the meteorological data were obtained from the Hanimaadhoo Airport meteorological station, which is an official meteorological measurement station fulfilling the WMO standards (World Meteorological Organization, Citation1992). This data was available only at a daily time resolution. Since November 2015, the meteorological parameters have been measured at the MCOH site with a Vaisala Weather Transmitter (WXT520) and recorded with a 3-minute time resolution. There was also daily precipitation data available until November 2015 from the Maldives Meteorological Service, and after that with a 3-minute time resolution measured with the WXT520.
2.3. Air mass back trajectories
To estimate the air mass origin, we calculated 14-day air mass back trajectories using the NOAA HYSPLIT (Hybrid Single-Particle Lagrangian Integrated Trajectory, Draxler and Hess, Citation1997, Citation1998, Draxler et al., Citation1999, Stein et al., Citation2015) back-trajectory model version 4.9. The starting height of the trajectories was 250 metres, and they were calculated with an hourly resolution. The meteorological fields for the model runs were obtained from the global GDAS (Global Data Assimilation System) dataset from the National Center for Atmospheric Research (Kanamitsu, Citation1989). The HYSPLIT model output also includes precipitation values, taken from the GDAS data, for each point in the back-trajectory and this data was used to estimate the accumulated rainfall during the last four days before the air mass arrived over the MCOH site. Four-day accumulated rainfall was selected as representative, considering the expected particle lifetime in the lower troposphere being typically less than a week (Raes et al., Citation2000).
3. Results and discussion
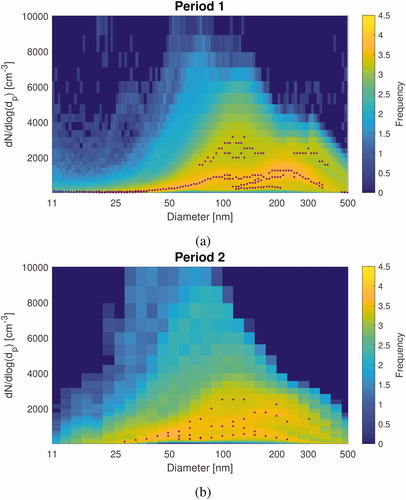
The aerosol size distribution frequency histograms for the Periods 1 and 2 show a tendency for certain size distribution shapes (). A typical aerosol size distribution at MCOH exhibits a bimodal form. The persistent size distribution shapes indicate particular frequent conditions. Our further aim is to reveal the boundaries of these conditions and to examine which atmospheric processes dominate in the wide range of aerosol size distributions observed in the Maldives.
. Histogram figures of fine particle size distributions during (a) Period 1 measured with the SMPS, and (b) Period 2 measured with the DMPS. On the x-axis is the particle diameter (nm) and on the y-axis is the concentration (
). Colours indicate the frequency of measured particle size distributions. The purple dots indicate the maximum peaks in frequency for each size bins. For values lower than 1259 on the y-axis the minimum for peak height is 3.5 and for values higher than 1259 the minimum peak height is 3.0. The figures comprise all data we have during the respective measurement periods.
3.1. Aerosol size distribution characteristics during the NE and SW monsoon seasons
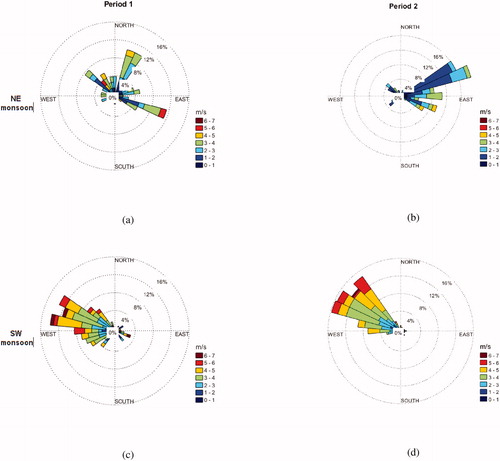
The Maldives experiences two major climatological seasons: a NE monsoon and a SW monsoon. The change in the prevailing meteorological conditions between the seasons is also reflected in the aerosol characteristics (Corrigan et al., Citation2006). Our results confirm the typically observed wind pattern where northeasterly winds prevail during the NE monsoon season, and shift to dominant westerly winds during the SW monsoon (). In addition, the surface wind speeds are higher during the SW monsoon than the NE monsoon season, being 8% more likely to exceed The location of the site near the equator and surrounded by the ocean is a plausible explanation for the observed weak inter-annual temperature variation. The median temperature and relative humidity were 28 ± 1.5
C and 76 ± 6.8% in Period 1, and 28 ± 1.5
C and 75 ± 7% in Period 2, respectively. The uncertainties indicate the interquartile ranges.
. Wind roses for different seasons at the Maldives: (a) NE monsoon season in Period 1, (b) NE monsoon season in Period 2, (c) SW monsoon season in Period 1, and (d) SW monsoon season in Period 2. The colours indicate wind speed () and the percentages the prevalence in wind directions per season. The meteorological data used in the figures corresponds with the aerosol particle data availability and averaged daily.
The aerosols measured in the Maldives during the SW monsoon season show the typical characteristics of marine aerosols (Fitzgerald, Citation1991). They show a bimodal size distribution with a distinguishable Hoppel minimum observed around 100 nm in diameter, separating the cloud activated particles (Hoppel et al., Citation1990). The bimodal distribution shape is most pronounced during the SW monsoon season when the particle number concentration is low (). In Period 1, the Hoppel minimum is observed between 110 and 150 nm and in Period 2 between 70 and 150 nm (SW monsoon and NE monsoon season, respectively). The change in activation diameter between the seasons suggests that the aerosol chemical composition changes, making the aerosol more CCN-active during the SW monsoon. This further suggests that natural aerosols are more favourable cloud nuclei than the Asian-originated long-range transported anthropogenic particles.
. Box-and-whisker plots of hourly-averaged particle size distributions during (a) Period 1 and (b) Period 2. X-axis is the particle diameter and y-axis the particle concentration (
). Blue color indicates the NE monsoon season, and red SW monsoon season. Panel (a) depicts SMPS measurements for which the data has been interpolated to similar bin sizes as for the DMPS data in panel (b). The central line in the boxes indicate the median, and the bottom and top lines of the boxes indicate the
and
percentiles. The whiskers mark the most extreme data points that are not considered as outliers.
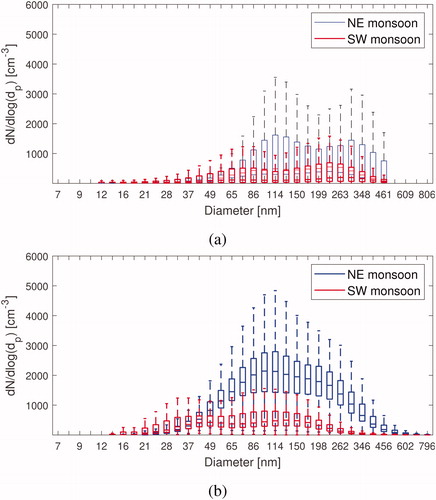
A typical size distribution observed during the NE monsoon season shows a pronounced accumulation mode (>100 nm particles) presumably consisting of aged long-range transported particles. This mode is much less pronounced and is shifted towards smaller sizes during the SW monsoon. In addition, a fresh nucleation mode (<50 nm particles) is apparent during the SW monsoon in Period 2. This suggests an additional secondary aerosol source.
We observed nucleation mode particles mainly in connection with local pollution events shortly before or after, suggesting that the source of the nucleating and condensing vapours were anthropogenic. Local pollution events were observed in the data as very short and rapid increases in the aerosol particle concentration. A typical example of an pollution event is when the total number concentration increases from to
lasts for 2 hours, and then returns back to around
Likely local anthropogenic sources include burning of rubbish, and the vehicular emissions from cars, ships or aircraft. All such events were removed from the time series. However, local pollution events were uncommon and clear evidence of clean marine boundary layer nucleation locally was not found. Overall, new particle formation events were very rare at MCOH, despite the available marine and land biomass organic precursors.
Aerosol number concentration during the NE monsoon season was clearly higher than during the SW monsoon (see ). Overall, higher particle number concentrations were observed in Period 2 than in Period 1, with median concentrations during the NE monsoon season in Period 2 being 66% higher, and for SW monsoon season 34% higher. There were 27 days where total number concentrations exceeded during the NE monsoon in Period 1, and 29 days exceeding
in Period 2, respectively. During the SW monsoon season the corresponding values were 7 days exceeding
in Period 1 and 31 days exceeding
in Period 2. The increasing trend in total number concentration could be indicative of the long-term trends in South-Asian aerosol sources and transport, such as seen for example in Lu et al. (Citation2011). However, only a few previous long-term aerosol studies made in South-East Asia have focused on the aerosol number, but rather on aerosol mass and with contradicting results. In addition, particle mass and number concentrations are typically not correlated; while the majority of number originates from the secondary sources, the mass relates to rather local and regional primary sources. Temporal changes in aerosol source regions will be studied in the next section.
Table 1. Particle total number concentrations measured during NE and SW monsoon in Period 1 and 2.
The shape of the size distribution manifests some changes between Periods 1 and 2 (). The nucleation mode, particles <50 nm, is more frequently observed during Period 2. This could indicate that secondary aerosol sources have gained more regional importance within the past 10 years. We are however cautious to make this conclusion, understanding that the nucleation mode size range is subject to increased diffusional losses and higher measurement uncertainties (e.g. Wiedensohler et al. (Citation2012)). Finally, the uncertainties arising from the relatively short measurement periods (especially during Period 1) and the changes made in the instrumental set-up have also to be considered as possible explanations for the observed differences.
3.2. Aerosol characteristics of different source regions
Air mass back trajectories were calculated to identify the sources of aerosol particles measured at MCOH (). and c, show that, during the NE monsoon season, the aerosol was mainly transported from the Indian subcontinent, over the Bay of Bengal and the Arabian Sea. These source regions were also identified by Budhavant et al. (Citation2018).
. Frequency map of the HYSPLIT back trajectories calculated for (a) 2004–2008 NE monsoon season, (b) 2004–2008 SW monsoon season, (c) 2014–2017 NE monsoon season, and (d) 2014–2017 SW monsoon season. The back-trajectories are calculated for every hour when there exists particle number size distribution data and each back-trajectory extends 14 days back in time.
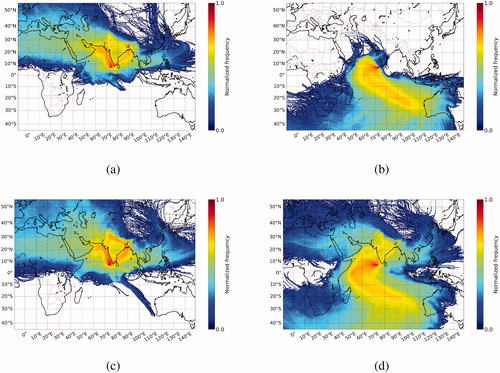
and d show the frequency map of the back trajectories calculated for the SW monsoon season, showing the Indian Ocean as the main source region. Occasional air masses originating from the Indian subcontinent were also observed, especially during Period 2. These trajectories may be responsible for the higher particle number concentrations measured during the SW monsoon in Period 2.
To investigate this we further separated the SW monsoon season air masses into subgroups of (1) purely marine and (2) those having a continental influence. Marine air masses were defined as those passing through a box between latitudes 0–10 N and longitudes 50–70
E within the past seven days before arriving at the station (). In Period 2 an additional condition was applied to eliminate continental air masses passing through a box defined by latitudes 15–30
N and longitudes 65–80
E. Applying these criteria eliminated 346 out of 2225 trajectories in Period 1 and 628 out of 6232 trajectories in Period 2. This left 84% of the back-trajectories in Period 1 and 90% in Period 2 classified as purely marine.
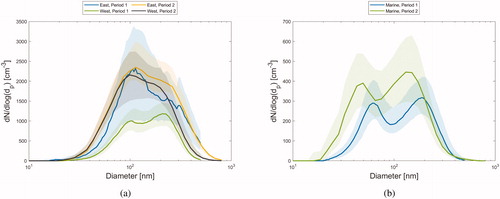
The median particle number size distributions for the purely marine air masses during the SW monsoon are shown in . During both periods the size distribution has a bimodal shape. In Period 1, the peaks in the size distribution are around 65 nm and 200 nm, whereas for Period 2 the peaks in the size distribution shift towards smaller sizes, around 50 nm and 160 nm. The mean total number concentration was 268 ± 114 (median 250
) for the marine air masses during Period 1. In Period 2, the mean total number concentration was 379 ± 256
(median 332
).
Fig. 7. Particle median size distributions for identified air masses during (a) the NE monsoon season, travelling down either the eastern or western side of the Indian subcontinent, and (b) over the ocean during the SW monsoon season. On the x-axis is the particle diameter (nm) and on the y-axis is the particle concentration (
). The shaded areas indicate the median ± the interquartile range of the distributions.
For the NE monsoon season we separated the air masses into two transport routes: the eastern and western coastlines of the Indian subcontinent. A box between latitudes 15–20 N and longitudes 68–78
E (western side) and a box between latitudes 15–20
N and longitudes 78–87
E (eastern side) were set to define the air mass trajectories (). We discarded trajectories that did not pass through either box. With this partitioning 411 trajectories were eliminated from a total of 1355 trajectories in Period 1, and 558 were discarded from a total of 1358 trajectories in Period 2. This left 69% of the back-trajectories in Period 1 (19% from east and 50% from west) and 59% in Period 2 (9% from east and 50% from west).
shows the median particle number size distributions during the NE monsoon season for eastern and western air masses, separately. The size distribution shape and the modal concentrations are rather similar in easterly air masses between Periods 1 and 2, clearly bimodal, and both having modal peak diameters at around 100 nm and 300 nm. The mean total number concentration was 1666 ± 819 (median 1745
) in Period 1 and 1915 ± 470
(median 1849
) in Period 2 (an increase in median total number concentration of 6% compared to Period 1).
During the NE monsoon, the majority of the air masses follow the western coast of the Indian subcontinent. A significant difference in particle number was observed in westerly air masses between Periods 1 and 2. The mean total number concentration was 879 ± 422 (median 772
) in Period 1 and 1615 ± 527
(median 1562
) in Period 2 (an increase in median total number concentration of 102%). Again, both size distributions showed a bimodal shape, with the first mode around 100 nm and the second mode around 200 nm. There were more intense rainfall events during Period 1 than during Period 2, which may partly explain the observed increase but this is difficult to attribute reliably.
The results indicate a general increase in the aerosol particle number concentration from Period 1 to Period 2, especially in air masses originating from the western coast of the Indian subcontinent and from over the Indian Ocean. Given the limited measurement time it is not immediately clear whether these changes are explained by the changes in emissions or rather the environmental factors.
To investigate whether emissions have increased between the two measurement periods, we extracted observations with accumulated rainfall amounts along the backtrajectories of 5 mm or less. For example, for transport down the western coast of India during the NE monsoon, the mean total number concentration increased from in Period 1 to
in Period 2, suggesting a major increase in emissions of aerosol particles or their precursors. The increase seen for transport down the eastern coastline was much less (
in Period 1 and
in Period 2). Oceanic emissions have also increased slightly (
in Period 1 and
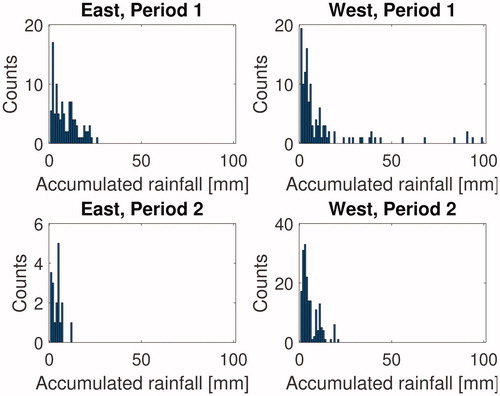
in Period 2 during SW monsoon). These changes are broadly in line with trends seen in long-term satellite observations of Aerosol Optical Depth (AOD) over South East Asia and the Indian ocean basin (Srivastava, Citation2017). Finally, we consider the possible impact of the changes in wet scavenging intensity during the NE monsoon season on the total number concentration. The histograms in show that, during the NE monsoon season, accumulations of up to 30 mm were encountered during the 4-days prior to arrival. The particle number concentration clearly decreases with increasing precipitation due to the wet scavenging process (see Supplement ), but our observations suggest that modification of the particle size distribution shape by precipitation is much less pronounced, at least for the NE monsoon (see Supplement ). In general, there are more precipitation events in Period 1 NE monsoon season than in Period 2 NE monsoon season. Air masses from the western side of the Indian subcontinent occasionally experienced accumulated rainfall amounts of up to 100 mm.
Fig. 8. Rainfall accumulation histograms for air masses travelling down either the eastern or western side of the Indian subcontinent during the NE monsoon season. The number of counts for the first rainfall accumulation bin of the histogram is divided by 30 for better comparison with the other values.
3.3. Particle wet scavenging during the SW monsoon
The main seasonal shift in particle number concentration is for the large part explained by the changes in air mass source regions; meanwhile the modal features are very prone to aerosol processing during transport. Of particular interest during the SW monsoon are wet deposition and cloud processing. Rain events during the NE monsoon season are very sporadic and so the main focus here will be on the analysis of the SW monsoon season data.
In Hanimaadhoo, the local daily accumulated rainfall during the NE monsoon season ranges from 0 to 58 mm and during the SW monsoon from 0 to 147 mm (values based on daily rainfall observations in Hanimaadhoo between 2005 and 2015). The mean daily rainfall amount at this location is low (1.8 mm for the NE monsoon season, 6.2 mm for the SW monsoon season). We estimated the amount of precipitation during transport to the measurement site using meteorological output data from the HYSPLIT model. As a representative proxy for the precipitation intensity, we used the preceding four days data before the air mass arrived to the measurement site, and compared it with the in-situ measured aerosol particle number size distribution. The analysis method is similar to that used by Tunved et al. (Citation2013). The maximum total accumulated rainfall amount during the four days of transit in our study was 150 mm. This can be compared with the 50 mm accumulated rainfall calculated by Tunved et al. (Citation2013) using 10-day back-trajectories prior to the air mass arrival at their Arctic measurement site. The precipitation accumulations experienced in the Asian SW monsoon and used in this study were thus three times higher than in the previous similar study from the Arctic.
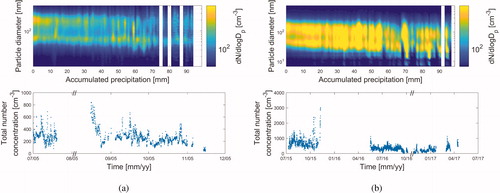
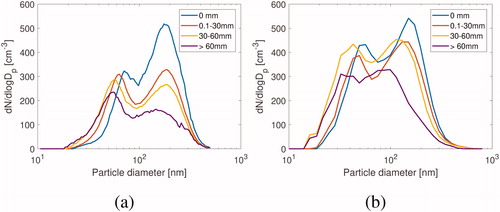
The accumulated rainfall was divided into 1 mm bins between 0 and 100 mm, and the measured particle size distributions were averaged according to these bins. The evolution of particle size distribution as a function of the accumulated rainfall shows a persistent change in the number size distribution (). The total particle number concentration decreases when the air mass experiences more precipitation in the preceding 4-days period. This concentration decrease is mainly due to the decreasing number of accumulation mode particles (). Similar decrease is observed in both Periods: the accumulation mode number concentration decreases below 50% when the rainfall accumulation exceeds 60 mm. The nucleation mode number concentration remains rather constant but the size shifts towards smaller diameters. This could indicate an absence of the strong accumulation mode condensation sink for the gaseous precursor gases, which therefore causes activation of the secondary particle formation processes.
. Impact of accumulated rainfall on measured particle size distribution and total number concentration time series during the SW monsoon season in (a) Period 1, and (b) Period 2. In the upper figure on the x-axis is the accumulated rainfall (mm) during four days before the air mass arrived to the measurement site, on the y-axis is the particle diameter (nm) and the concentration (
) is in colour. In the lower figure on the x-axis is time
and on the y-axis is the total number concentration (
). All data are in hourly resolution, and the particle size distribution data are averaged to 1 mm rain bins.
. Impact of accumulated rainfall on measured particle size distribution during the SW monsoon season in (a) Period 1, and (b) Period 2. On the x-axis is the particle diameter (nm) and on the y-axis is the particle concentration (
). All data are in hourly resolution. The size distributions with different amounts of rainfall are plotted with different colours.
4. Conclusions
We combined aerosol particle number size distribution measurements conducted at the Maldives Climate Observatory at Hanimaadhoo (MCOH) from two different time periods: 2004–2008 (Period 1) and 2014–2017 (Period 2) to permit the first multiyear study of the aerosol size distribution seasonal characteristics in the South-Asian outflow and SW monsoon.
The main origin of aerosol during the NE monsoon season is the Indian subcontinent, and over half of the air masses arriving at MCOH had trajectories following the western coastline of India over the Arabian Sea. The other transport route was via the eastern coastline over the Bay of Bengal. The measured long-range transported aerosol size distributions at MCOH did not show significant differences between these two origins and transport routes except in terms of number concentration, with decreases in number concentration attributed to increases in accumulated precipitation.
During the SW monsoon season, the Indian Ocean is the origin of aerosols observed at MCOH. Aerosol total number concentrations were about a quarter of that measured during the NE monsoon season. Precipitation efficiently removed accumulation mode aerosols, while the nucleation mode concentration remained similar or even slightly increased, with increasing rainfall accumulation.
Overall, the aerosols observed at MCOH showed a bimodal size distribution which is typical for marine sub-micrometre aerosols. During NE monsoon seasons, the season with more anthropogenic aerosols, a decrease in number concentrations around 100 nm in diameter, the so called Hoppel minimum, was observed. This could be explained by both presumably different chemical composition and an excess in cloud nuclei number.
There was a gap of about 10 years between the two measurement periods available. Our results showed an increase in particle number during this gap, for both NE and SW monsoon seasons. This increase could be partly explained by environmental factors, such as the differences in air flow patterns and precipitation, but is also consistent with a real increase in aerosol number, as suggested by satellite observations of AOD over the Indian subcontinent. This could be due to increasing primary or precursor emissions, or decrease in aerosol sinks. The main challenge that we face in determining which factors are responsible is the lack of previous aerosol number and size studies from both this region and the source regions.
We would like to encourage future studies on South Asian aerosol number and size distributions as well as call for better interaction with the global modelling communities in order to account for the Asian aerosol transport processing in large scale models.
Acknowledgements
The authors are grateful to Professor Veerabhadran Ramanathan for providing the SMPS data and to the Maldives Meteorological Services (MMS) and the Government of the Republic of the Maldives for their support of MCOH. We would also like to thank the technicians at MCOH for their help with instruments.
Disclosure statement
No potential conflict of interest was reported by the authors.
Supplemental data
Supplemental data for this article can be accessed here.
Additional information
Funding
References
- Albrecht, B. A. 1989. Aerosols, cloud microphysics, and fractional cloudiness. Science 245, 1227–1230. doi:10.1126/science.245.4923.1227
- Andronache, C. 2004. Estimates of sulfate aerosol wet scavenging coefficient for locations in the Eastern United States. Atmos. Environ. 38, 795–804. doi:10.1016/j.atmosenv.2003.10.035
- Budhavant, K., Bikkina, S., Andersson, A., Asmi, E., Backman, J. and co-authors. 2018. Anthropogenic fine aerosols dominate the wintertime regime over the northern Indian Ocean. Tellus Ser. B 70, 1–15. doi:10.1080/16000889.2018.1464871
- Corrigan, C. E., Ramanathan, V. and Schauer, J. J. 2006. Impact of monsoon transitions on the physical and optical properties of aerosols. J. Geophys. Res. 111. D18208.
- Dasari, S., Andersson, A., Bikkina, S., Holmstrand, H., Budhavant, K. and co-authors. 2019. Photochemical degradation affects the light absorption of water-soluble brown carbon in the South Asian outflow. Sci. Adv. 5, eaau8066 doi:10.1126/sciadv.aau8066
- Draxler, R. R. and Hess, G. D. 1997. Description of the HYSPLIT4 modeling system. NOAA Tech. Memo. ERL ARL-224, 24 pp. [Available online at www.arl.noaa.gov/documents/reports/arl-224.pdf.]
- Draxler, R. R. and Hess, G. D. 1998. An overview of the HYSPLIT_4 modelling system for trajectories. Aust. Meteorol. Mag 47, 295–308.
- Draxler, R. R., Stunder, B., Rolph, G. and Taylor, A. 1999. HYSPLIT4 user’s guide. NOAA Tech. Memo. ERL ARL-230. [Available online at www.arl.noaa.gov/documents/reports/hysplit_user_guide.pdf]
- Dusek, U., Frank, G. P., Hildebrandt, L., Curtius, J., Schneider, J. and co-authors. 2006. Size matters more than chemistry for cloud-nucleating ability of aerosol particles. Science 312, 1375–1378. doi:10.1126/science.1125261
- Fitzgerald, J. W. 1991. Marine aerosols: a review. Atmos. Environ. Part A 25, 533–545. doi:10.1016/0960-1686(91)90050-H
- Haywood, J. and Boucher, O. 2000. Estimates of the direct and indirect radiative forcing due to tropospheric aerosols: a review. Rev. Geophys. 38, 513–543. doi:10.1029/1999RG000078
- Holton, J. R. and Hakim, G. J. 2012. An Introduction to Dynamic Meteorology (Fifth Edition), Vol. 88. Academic Press, Boston.
- Hoppel, W. A., Fitzgerald, J. W., Frick, G. M., Larson, R. E. and Mack, E. J. 1990. Aerosol size distributions and optical properties found in the marine boundary layer over the Atlantic Ocean. J. Geophys. Res. 95, 3659–3686. doi:10.1029/JD095iD04p03659
- Jayaraman, A., Lubin, D., Ramachandran, S., Ramanathan, V., Woodbridge, E. and co-authors. 1998. Direct observations of aerosol radiative forcing over the tropical Indian Ocean during the January-February 1996 pre-INDOEX cruise. J. Geophys. Res. 103, 13827–13836. doi:10.1029/98JD00559
- Jiang, H., Xue, H., Teller, A., Feingold, G. and Levin, Z. 2006. Aerosol effects on the lifetime of shallow cumulus. Geophys. Res. Lett. 33, L14806.
- Kanamitsu, M. 1989. Description of the NMC global data assimilation and forecast system. Wea. Forecast. 4, 335–342. doi:10.1175/1520-0434(1989)004<0335:DOTNGD>2.0.CO;2
- Koch, D., Schulz, M., Kinne, S., McNaughton, C., Spackman, J. R. and co-authors. 2009. Evaluation of black carbon estimations in global aerosol models. Atmos. Chem. Phys. 9, 9001–9026. doi:10.5194/acp-9-9001-2009
- Kulshrestha, U. C., Reddy, L. A. K., Satyanarayana, J. and Kulshrestha, M. J. 2009. Real-time wet scavenging of major chemical constituents of aerosols and role of rain intensity in Indian region. Atmos. Environ. 43, 5123–5127. doi:10.1016/j.atmosenv.2009.07.025
- Lelieveld, J., Crutzen, P. J., Ramanathan, V., Andreae, M. O., Brenninkmeijer, C. M. and co-authors. 2001. The Indian Ocean experiment: widespread air pollution from South and Southeast Asia. Science 291, 1031–1036. doi:10.1126/science.1057103
- Liu, X., Easter, R. C., Ghan, S. J., Zaveri, R., Rasch, P. and co-authors. 2012. Toward a minimal representation of aerosols in climate models: description and evaluation in the Community Atmosphere Model CAM5. Geosci. Model Dev. 5, 709–739. doi:10.5194/gmd-5-709-2012
- Lobert, J. M. and Harris, J. M. 2002. Trace gases and air mass origin at Kaashidhoo, Indian Ocean. J. Geophys. Res. 107, INX2-12.
- Lohmann, U. and Feichter, J. 2005. Global indirect aerosol effects: a review. Atmos. Chem. Phys. 5, 715–737. doi:10.5194/acp-5-715-2005
- Lu, Z., Zhang, Q. and Streets, D. G. 2011. Sulfur dioxide and primary carbonaceous aerosol emissions in China and India, 1996–2010. Atmos. Chem. Phys. 11, 9839–9864. doi:10.5194/acp-11-9839-2011
- Madden, R. A. and Julian, P. R. 1971. Detection of a 40–50 day oscillation in the zonal wind in the tropical Pacific. J. Atmos. Sci. 28, 702–708. doi:10.1175/1520-0469(1971)028<0702:DOADOI>2.0.CO;2
- Okita, T., Hara, H. and Fukuzaki, N. 1996. Measurements of atmospheric SO2 and SO42−, and determination of the wet scavenging coefficient of sulfate aerosols for the winter monsoon season over the Sea of Japan. Atmos. Environ. 30, 3733–3739. doi:10.1016/1352-2310(96)00090-8
- Raes, F., Dingenen, R. V., Vignati, E., Wilson, J., Putaud, J.-P. and co-authors. 2000. Formation and cycling of aerosols in the global troposphere. Atmos. Environ. 34, 4215–4240., doi:10.1016/S1352-2310(00)00239-9
- Ramachandran, S. 2004. Spectral aerosol optical characteristics during the northeast monsoon over the Arabian Sea and the tropical Indian Ocean: 1. Aerosol optical depths and their variabilities. J. Geophys. Res. 109, D19207.
- Ramana, M. V. and Ramanathan, V. 2006. Abrupt transition from natural to anthropogenic aerosol radiative forcing: observations at the ABC-Maldives Climate Observatory. J. Geophys. Res. 111. D20207.
- Ramanathan, V. and Crutzen, P. J. 2003. New directions: Atmospheric Brown “Clouds”. Atmos. Environ. 28, 4033–4035.
- Ramanathan, V., Crutzen, P. J., Lelieveld, J., Mitra, A. P., Althausen, D. and co-authors. 2001. Indian Ocean experiment: an integrated analysis of the climate forcing and effects of the great Indo-Asian haze. J. Geophys. Res. 106, 28371–28398. doi:10.1029/2001JD900133
- Ramanathan, V., Li, F., Ramana, M. V., Praveen, P. S., Kim, D. and co-authors. 2007. Atmospheric brown clouds: hemispherical and regional variations in long-range transport, absorption, and radiative forcing. J. Geophys. Res. 112. D22S21.
- Rasch, P. J., Feichter, J., Law, K., Mahowald, N., Penner, J. and co-authors. 2000. A comparison of scavenging and deposition processes in global models: results from the WCRP Cambridge Workshop of 1995. Tellus Ser. B 52, 1025–1056. doi:10.3402/tellusb.v52i4.17091
- Srivastava, R. 2017. Trends in aerosol optical properties over South Asia. Int. J. Climatol. 37, 371–380. doi:10.1002/joc.4710
- Stein, A. F., Draxler, R. R., Rolph, G. D., Stunder, B. J. B., Cohen, M. D. and co-authors. 2015. NOAA’s HYSPLIT atmospheric transport and dispersion modeling system. Bull. Am. Meteorol. Soc 96, 2059–2077. doi:10.1175/BAMS-D-14-00110.1
- Stocker, T. F., et al. IPCC. 2013. Climate change, 2013.
- Taraphdar, S., Zhang, F., Leung, L. R., Chen, X. and Pauluis, O. M. 2018. MJO affects the monsoon onset timing over the Indian region. Geophys. Res. Lett. 45, 10011–10018. doi:10.1029/2018GL078804
- Textor, C., Schulz, M., Guibert, S., Kinne, S., Balkanski, Y. and co-authors. 2006. Analysis and quantification of the diversities of aerosol life cycles within AeroCom. Atmos. Chem. Phys. 6, 1777–1813. doi:10.5194/acp-6-1777-2006
- Tunved, P., Ström, J. and Krejci, R. 2013. Arctic aerosol life cycle: linking aerosol size distributions observed between 2000 and 2010 with air mass transport and precipitation at Zeppelin station, Ny-Ålesund, Svalbard. Atmos. Chem. Phys. 13, 3643–3660. doi:10.5194/acp-13-3643-2013
- van Donkelaar, A., Martin, R. V., Brauer, M., Kahn, R., Levy, R. and co-authors. 2010. Global estimates of ambient fine particulate matter concentrations from satellite-based aerosol optical depth: development and application. Environ. Health Perspect. 118, 847–855. doi:10.1289/ehp.0901623
- Wiedensohler, A., Birmili, W., Nowak, A., Sonntag, A., Weinhold, K. and co-authors. 2012. Mobility particle size spectrometers: harmonization of technical standards and data structure to facilitate high quality long-term observations of atmospheric particle number size distributions. Atmos. Meas. Tech. 5, 657–685. doi:10.5194/amt-5-657-2012
- World Meteorological Organization. 1992. International Meteorological Vocabulary. WMO-No. 182. Geneva.
- Zhang, J. and Reid, J. S. 2010. A decadal regional and global trend analysis of the aerosol optical depth using a data-assimilation grade over-water MODIS and Level 2 MISR aerosol products. Atmos. Chem. Phys. 10, 10949–10963. doi:10.5194/acp-10-10949-2010