
Abstract
Climate change is not only about changes in means of climatic variables such as temperature, precipitation and wind, but also their extreme values which are of critical importance to human society and ecosystems. To inspire the Swedish climate research community and to promote assessments of international research on past and future changes in extreme weather events against the global climate change background, the Earth Science Class of the Royal Swedish Academy of Sciences organized a workshop entitled ‘Extreme weather events in a warming world’ in 2019. This article summarizes and synthesizes the key points from the presentations and discussions of the workshop on changes in floods, droughts, heat waves, as well as on tropical cyclones and extratropical storms. In addition to reviewing past achievements in these research fields and identifying research gaps with a focus on Sweden, future challenges and opportunities for the Swedish climate research community are highlighted.
1. Introduction
Externally driven climate change, now detectable from a single day of globally observed temperature and moisture (Sippel et al., Citation2020), is often described in terms of average changes in e.g. temperature, precipitation. However, most of the social and economic impacts are caused by extreme weather events (e.g. Perera et al., Citation2020). Extreme weather events can occur naturally, i.e. without anthropogenic influence. Therefore, relevant questions in this context can be To what extent has global warming changed characteristics of extreme weather events? Are they becoming more or less frequent/intense? What research is being carried out in Sweden in this field and what research can and should be prioritized in the future? To answer these and other related questions, the Earth Science Class of the Royal Swedish Academy of Sciences (RSAS) organized a workshop entitled ‘Extreme weather events in a warming world’ at the University of Gothenburg in Sweden on November 11-12th 2019.
The main purpose of this workshop was to inspire the Swedish climate research community and to contribute to assessments of the subject. Focus was placed on recent and future trends in flooding and drought, as well as on tropical cyclones and extratropical storms. Although these extremes can occur in different parts of the world, most attention was paid to Fennoscandia. Specifically, the following objectives were addressed: (1) review and synthesize recent advances in studying extreme weather events, with a focus on detection and attribution of the events to anthropogenic forcings, (2) identify challenges and critical knowledge gaps in the research on extreme weather events, and (3) promote and stimulate future cooperation among Swedish climate researchers and between the Swedish and international research communities.
The workshop was attended by 13 RSAS Earth Science Class members, 19 researchers active in the field and three outstanding international experts specialized in this research field. After half a day of presentations by the three invited international experts and six of the Swedish researchers, the participants spent nearly one day on discussions. The presentations and discussion were focused on the following three questions: (1) How have selected extreme events changed in the past (about 100 years back)? (2) How much of the changes can be attributed to global warming? and (3) What are the future outlooks (20–30 years from now)?
We focused on three types of extreme events, (1) storms and cyclones, (2) heat waves, and (3) floods and droughts. Below we summarize the presentations and discussions/deliberations of the workshop.
2. Results from the workshop
2.1. Presentations by the invited speakers
Prof. Sonia I. Seneviratne from the Institute for Atmospheric and Climate Science, ETH Zürich, Switzerland gave a keynote on ‘Climate extremes in a warming climate: 1.5 °C, 2 °C and higher’. She started with the extreme weather events of 2018 around the globe, including what has happened in Sweden. Then she focused on introducing the Special report on ‘Global warming of +1.5 °C’ published by the Intergovernmental Panel on Climate Change (IPCC, Citation2018). The key messages from this report are (1) we already have +1 °C of global warming since the industrial revolution; (2) under present climate change (+ 1 °C) there are already detectable changes in extreme events which are attributable to anthropogenic greenhouse gas emissions, including increases in heat waves/hot extremes in most land regions, increases in heavy precipitation at global scale, increase in drought in the Mediterranean region, and higher intensity of precipitation associated with tropical cyclones; (3) a limitation of global warming to 1.5 °C compared to 2 °C would contribute to avoid substantial increase in extreme events and related impacts; half a degree difference in warming level matters; and (4) emissions so far do not commit us to a world with more than +1.5 °C warming; they however require unprecedented changes, i.e. immediate reduction of CO2 emissions (until 2030: 50% of 2010), and net-zero CO2 emissions at the latest in 2040–2050. Meanwhile, the present commitments would lead to more than +3 °C of global warming.
Other aspects of interest were covered by Sonia I. Seneviratne. The analysis of observational data during the so-called global warming hiatus or ‘pause’ demonstrated a continued increase of hot extremes over land (Seneviratne et al. (Citation2014). This tendency was shown to be greater for the most extreme events. Seneviratne et al. (Citation2016) also demonstrated that regional changes in extreme temperature and precipitation were related to global mean temperature and cumulative CO2 emissions, and that this was particularly relevant for changes in regional extreme temperatures on land that are much greater than changes in the associated global mean (see also Wartenburger et al., Citation2017). She also stressed that a + 1.5 °C climate is very different from a + 2 °C climate (e.g. Wartenburger et al. Citation2017). An increase of global warming to +2° C would imply e.g. an increase in hot extremes in most inhabited regions of the world, heavier precipitation in several regions, and increased drying in some regions (e.g. Mediterranean, Southern Africa). Drijfhout et al. (Citation2015) also show that the risk of reaching tipping points increases when global warming is > 1.5 °C, and additional risks become very high for > 2 °C warming. Moreover, several risks are not yet well assessed, i.e. compound extreme events and co-occurrence of extreme events at several locations. Extreme events have long been studied as isolated events. However, Zscheischler et al. (Citation2018) show that drivers of compound events (i.e. multivariate extremes) are often positively correlated, and therefore compound events could substantially increase impacts. Floods, wildfires, heatwaves and droughts often result from a combination of interacting physical processes, e.g. fire is correlated to both drought and heatwaves, and coastal floods to sea-level rise and higher precipitation. Baldwin et al. (Citation2019) present the first quantifications of hazard from compound heat waves, and demonstrate that compound events will lead to a larger proportion of heatwave risk with global warming. Vogel et al. (Citation2019) discuss co-occurrence of extreme events at multiple locations and show that model simulations agree with observations. They conclude that the concurrent heat events in the Northern Hemisphere in summer 2018 could not have occurred without anthropogenic climate change, and that a 2018-like situation could occur nearly every year with a + 2 °C global warming.
Prof. Panmao Zhai from the Chinese Academy of Meteorological Sciences presented a keynote entitled ‘Changes in Frequency, Intensity and Persistency of Extreme Precipitation in China’ in which he focused on extreme precipitation changes in the last decades over eastern China. Notable changes in persistency of precipitation are identified in North China, the Yangtze River Valley, South China and Southwest China. Such precipitation changes have led to increased flooding intensity and drought duration/intensity in these regions. The changes in persistence of precipitation seem to link to low-frequency water vapor transportation in association with large scale circulation changes since late 1970s.
Prof. Kerry Emanuel from the Lorenz Center, Massachusetts Institute of Technology, presented a keynote on ‘Tropical Cyclones, Medicanes, and Polar Lows in a Warming World’. He started by showing compelling observational evidence for significantly increasing trend in the historical records for major hurricanes in the North Atlantic during 1851–2016 (Lavender et al., Citation2018) and for global Tropical Cyclone (TC) intensity during 1980–2016 (Zhan and Wang, Citation2017). Based on a simple Carnot cycle model to estimate the maximum intensity of TCs under somewhat warmer conditions, he showed that a 40–50% increase in the destructive potential of hurricanes and 12–15% increase in wind speed can be expected in a warmer climate caused by a doubling of CO2 (Emanuel, Citation1987). Theoretically, the potential intensity of hurricanes can be expected to increase, leading to increased frequency of high-intensity hurricanes under global warming. Increases in potential intensity should be faster in the sub-tropics, and future hurricanes will produce substantially more rain. Reanalysis data beginning in 1979 show that potential intensity is indeed increasing, and doing so more rapidly in the subtropics. He also discussed the problem that the resolutions of today’s global climate models are far too coarse to simulate destructive hurricanes and presented a novel method to use a statistical–deterministic approach based on physics to estimate hurricane risk with examples for Mediterranean Hurricanes (‘Medicanes’) and Polar Lows (Romero and Emanuel, Citation2017). In summary, global warming results in more rain, stronger storms but more compact hurricane inner regions, and possibly larger storm diameters. The response of Medicanes and polar lows to climate change is more complex, with decreasing frequency of polar lows indicated in most regions.
2.2. Presentations by other speakers
Five scientists from Sweden presented their research on past and/or future changes in extreme weather and climate events in the US, India, and the Euro-Atlantic and Baltic Sea region. They reported on summer heat waves and precipitation extremes, storminess, statistical modeling of extreme precipitation, as well as influences of large-scale atmospheric circulation, ocean-atmosphere interactions, and land-atmosphere feedback on some of the changes.
Dr. Frederik Schenk (Stockholm University) presented the latest research on Euro-Atlantic storminess in the past, present and future. In general, two antagonistic physical processes related to extra-tropical storminess compete under global warming: (1) A change in the thermal wind balance in response to a more rapid warming of high latitudes (Arctic Amplification) might reduce the pole-equator pressure gradient and weaken cyclone formation. However, (2) continued warming will increase heat release from condensation which may intensify storms.
On centennial- to millennial time scales, a new geological study for the last >6000 years finds higher storminess in NW-Scotland during cold periods with larger sea-ice extent and low solar activity (Kylander et al., Citation2020). This suggests that changes in external forcing and Arctic Amplification will have an impact also on future storminess.
Historical storm indices from Scandinavia (e.g. Bärring and Fortuniak, Citation2009; Rutgersson et al., Citation2014; BACC Author Team, Citation2015) and other regions do not show consistent long-term trends. However, long-term variability on timescales of decades or more are seen in these studies as well as in Feser et al (Citation2015) who finds a NE-shift of the storm track towards Scandinavia since the 1980s, which is consistent with previous studies based on reanalysis and climate model data (Ulbrich et al., Citation2009).
Such a NE-shift of the Euro-Atlantic storm track is also projected by new very high-resolution (∼25 km) global climate simulations with increased precipitation and wind extremes over Scandinavia under +1.5 and +2 °C warming levels (Barcikowska et al., Citation2018). While these results confirm comparable results from a majority of previous multi-model studies (e.g. Ulbrich et al. Citation2009; Feser et al., Citation2015), these simulations suggest that most of the changes will only occur after exceeding the +1.5 °C warming level. It remains unclear whether current climate models underestimate variations and changes in storminess given that long observational indices and geological proxies suggest considerably larger changes in the past than typically encountered in simulations.
Prof. Anna Rutgersson (Uppsala University) presented an ongoing assessment focusing on extreme events in the Baltic Sea region (defined by the Baltic Sea drainage basin). This work is done within the framework of the Baltic Earth scientific program. The climate of the Baltic Sea region (including extreme events) is to a large extent determined by the larger scale dynamics and the circulation patterns. An increase in the persistence of circulation patterns has been observed and an eastward and poleward extension of storm tracks is expected according to scenario simulations. As global warming is associated with an intensification of the hydrological cycle, heavy precipitation is projected to increase in this area. There is also an increasing risk of heat waves. Extreme events can also include ecosystem response to global warming, for the Baltic Sea one example includes an expected increased frequency of phytoplankton blooms (BACC Author Team, Citation2015).
Dr. Kaiqiang Deng (University of Gothenburg) presented a study on North American summer heat waves. This research indicates that southern North America experienced more frequent heat waves over the past few decades. While the interannual variability of heat waves in southern North America is linked to ENSO (El Niño Southern Oscillation) conditions, the upward trend in heat waves is found to be significantly associated with the tropical Pacific zonal sea surface temperature gradient (PZSSTG) (Deng et al., Citation2018a). They further propose that the amplification of PZSSTG led to both enhanced convection in the western Pacific and suppressed convection in the central-eastern Pacific, both of which can induce anomalous anticyclones over the Texas area through two distinct planetary wave trains during the antecedent spring. As a result, anomalously sinking motions and divergent water vapor flux appear over southern North America, which reduced the local precipitation and increased downward solar radiation, leading to dry and hot soil that favors the occurrence of summer heat waves.
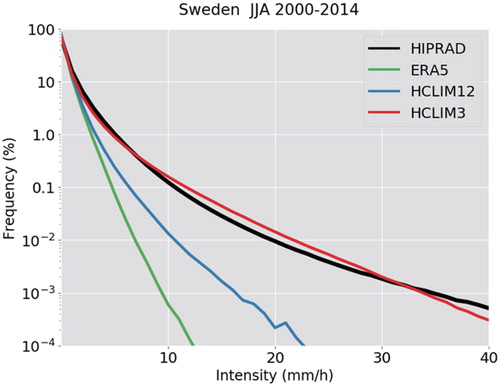
Prof. Erik Kjellström (SMHI) presented a talk on ‘Changing summertime precipitation extremes in a warmer climate – Findings from a new convection-permitting regional climate model’. A joint Nordic collaboration has resulted in the very first 20-year simulations of historical and future climate covering Fennoscandia at convection-permitting scales (3 km grid spacing) (Belušić et al. Citation2020). The results corroborate findings from other regions. This includes significant improvements over coarser-scale climate models in simulating the diurnal cycle of convective precipitation and in representing high-intensity low-frequency precipitation events. First results clearly shows added value from using a high-resolution convection-permitting model both at aggregated spatial scales representing the coarser-scale climate models and by producing information at the higher resolution not covered by such coarse-scale models as illustrated in (see also Belušić et al. Citation2020). Furthermore, the results are indicative of stronger increases in heavy precipitation compared to the coarser-scale models. For some parts of Scandinavia super-Clausius-Clapeyron scaling, meaning that hourly precipitation has a response to warming exceeding the Clausius–Clapeyron (CC) relation, is found comparable to findings for other regions (e.g. Kendon et al., Citation2014; Lenderink et al., Citation2019). An important implication of this finding is that earlier assessments of changes of extreme precipitation based only on coarser-scale climate models may have shown too weak increases in heavy precipitation related to summertime cloudbursts in a range of climates now including also the high-latitude Nordic region.
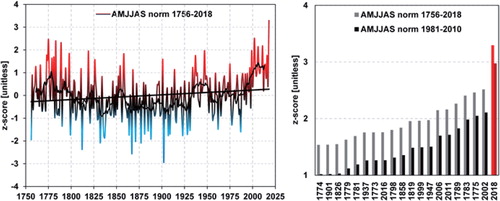
Fig. 1. Annual mean warm-season temperatures (April to September) in Stockholm 1756–2018. Left: Time evolution and long-term trend of warm-season temperatures normalized relative to the mean of 1756–2018. Right: Ranked warm seasons >1 z-score relative to 1756–2018 (grey) and their z-scores relative to 1981–2018 (black). The data was corrected for urban heat island effect (Moberg et al., Citation2002a). The linear warming trend is significantly different from zero at p<0.01. Data by A. Moberg is taken from the Bolin Centre Database https://bolin.su.se/data/.
Dr. Wilhelm May (Centre for Environmental and Climate Research at Lund University) gave a presentation ‘On the variability and extremes of daily precipitation for present and future times’, focusing on two specific issues that can be relevant when analyzing the variability and extremes of daily precipitation.
The first issue was on choosing the appropriate extreme value distribution when computing longer (i.e. 30-year) return levels of daily precipitation. From observations of daily precipitation in India during the monsoon season (June through September), 30-year return levels were derived using two distributions, the Generalized Extreme Value (GEV) and the Generalized Pareto (GPA) distribution (e.g. Coles, Citation2001). The results revealed that the GPA distribution is generally better suited for describing the behavior of 30-year return levels of daily precipitation during the Indian summer monsoon than the GEV distribution (May, Citation2004). That is, the magnitude of these return levels is markedly (typically by around 30%) underestimated when the GEV distribution is applied. This is related to the substantial variability of daily rainfall during the Indian summer monsoon, both on sub-seasonal and interannual time scales. Thus, the consideration of block maxima (i.e. the maximum value for each monsoon season) misses out many rather strong daily precipitation events but admits many relatively weak ones.
The second issue was on choosing better suited variables for describing extreme precipitation events with regard to the impacts of such events. That is, potential future changes in the 30-year return levels of daily precipitation in Europe were compared to the respective changes in the 30-year return levels in the precipitation accumulated during wet spells as obtained from a scenario simulation for Europe. During extended wet periods the soil will be saturated and all the precipitation will run into streams and rivers, possibly causing large-scale flooding. The results revealed that regional variation of the future changes across Europe are much more distinct for the 30-year return level of precipitation accumulated during wet spells than for the 30-year return level of daily precipitation (May, Citation2008). That is particular the case for summer (June through August), when the differences between the southern part of Europe with decreased return levels and the northern part with increased values is more pronounced. Furthermore, the projected changes in the 30-year return level of accumulated precipitation are generally more robust than for the 30-year return level of daily precipitation.
3. Discussions and deliberations
Based on the presentations and the overarching objectives of the workshop, three break-out groups discussed the three major questions presented above and four additional issues, as follows: (1) What role can Swedish scientists play in the analysis of extreme weather events? (2) Do we have unique data or unique expertise? (3) What critical research concerning extreme weather events in a changing climate is missing? (4) Given the gaps identified in (3), what major research questions would be rewarding for Swedish scientists to focus on in the future?
3.1. Group one on storms and cyclones
The discussion was chaired by Leif Anderson. A recent assessment of TCs (Knutson et al., Citation2019, Citation2020) was discussed in some detail during the workshop. On a global scale, it is difficult to find changes in TC frequency. However, a poleward migration of the latitude of TC peak intensity under global warming is clear, as is an increase in TC rain in those few regions with adequate rainfall data.
For polar lows, our knowledge is generally limited. It was noted that no significant hemispheric long-term trends over the last decades are observed, although some regions have experienced significant downward or upward trends (Stoll et al., Citation2018). But a significant declining trend for intensive polar lows in the northern hemisphere has been identified. For the next 2–3 decades, the trends in the model projections are not clear, but downscaling methods show decreasing frequency of polar lows in the North Atlantic. In general, global warming is projected to cause a significantly lower number of polar lows and a northward shift of their mean genesis region over the North Atlantic (Zahn and von Storch, Citation2010).
Gaps in the understanding of lake effect snow, factors influencing surface mean and gust winds (e.g. increased friction, see Zhang et al., Citation2019), and the role played by the North Atlantic Oscillation (NAO) on storms were identified. Future efforts need to make long records of observations accessible (incl. digitization of relatively long instrumental data in Swedish records on papers), and to aim at developing high-resolution coupled atmosphere-ocean models, which is important for a correct representation of the NAO centers of action (Davini and Cagnazzo, Citation2014) and for a better description in and around coastal areas such as in the North Sea and the Baltic Sea, thereby increasing the ability of such models for use in climate change impact studies (Rechid et al., Citation2016).
Swedish scientists have been leading in the development of coupled regional climate models including components for the ocean and waves (Döscher et al., Citation2002; Wu et al., Citation2019) and for dynamic vegetation (Smith et al., Citation2011). For the Baltic Sea this has resulted in tools that are better suited for addressing regional features such as lake effect snow fall (Jeworrek et al., Citation2017) and storm simulations (Wu et al., Citation2017).
Swedish scientists have also been playing a major role in the development of EC-Earth model which provides global, high resolution and many ensemble member simulations. A recent study shows that Millennia-long simulation with EC-Earth can provide statistical estimation of maximum annual number of tropical cyclones (Lavender et al., Citation2018).
3.2. Group two on heat waves and droughts
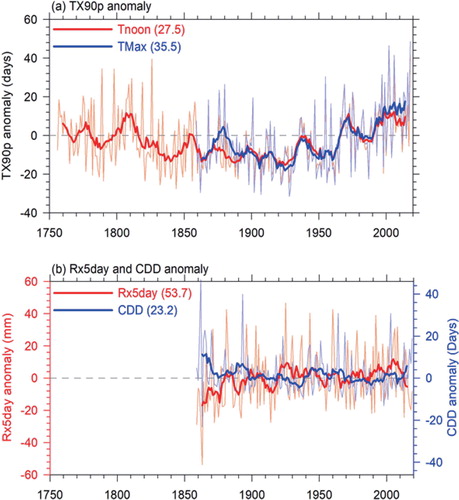
This group was chaired by Anna Rutgersson. A heat wave is associated with unusually high temperatures and as such it can occur in any season, although summer heat waves are a natural concern to many. In fact, unusually warm days outside summer such as long warm winter spells are also of concern for Sweden. displays evolution of all-season heat waves in Stockholm characterized by a frequently used index based on daily maximum temperature TX90p – the 90th percentile of maximum temperature (e.g. Chen et al., Citation2015). Despite the high variability, the frequent high peaks in the recent decades do stand out compared to the series since 1859. However, if the data is extended back in time until 1756, some similar high peaks around 1810 (though not so concentrated and somewhat lower compared to the recent 2 decades) can also be found, which demonstrates the importance of the natural variability of the Swedish climate.
Fig. 2. Frequency diagram showing summer (June-August) hourly precipitation from all model grid points in Sweden. HIPRAD is a combined radar and rain gauge data set covering Sweden at 2 × 2 km at 1-hourly time resolution (Berg et al., Citation2016). ERA5 is the global reanalysis data at 30 km horizontal resolution (Hoffmann et al., Citation2019) used to force the regional climate models at 12 km (HCLIM12) and 3 km (HCLIM3). All model results have been calculated at their native grid resolution and only data from events with > 0.1 mm/hour has been included. The figure clearly shows higher precipitation intensities with higher model resolution that is closer to the observations..
Like previous heat waves, the extremely high summer temperatures in 2018 in Stockholm were to a large extent due to unusually persistent atmospheric blocking patterns over Fennoscandia from May to August which are comparable to previous blocking situations causing an abrupt increase in major heatwaves in Europe in recent decades (e.g. Duchez et al. Citation2016; Liu et al. Citation2020).
An increase in persistence can add to the problem of extreme ‘compound events’ (e.g. Zscheischler et al. Citation2018) which may have high impacts on society and ecosystems beyond daily or weekly extreme events. In fact, dry conditions seem to be closely linked with heat waves in Europe (Miralles et al., Citation2012; Liu et al., Citation2020; Seneviratne et al., Citation2010).
A meteorological drought can be defined by precipitation only, while agricultural/hydrological drought needs to take both precipitation and evapotranspiration into account (Vicente-Serrano et al. Citation2012). There are a number of drought indicators using precipitation only. gives an example of evolution of Consecutive Dry Days (CDD) for Stockholm. CDD is defined as the maximum number of consecutive dry days per year with daily precipitation amount of less than 1 mm and shows length of dry spells. Thus, this index is a measure of low precipitation, with high values corresponding to long periods of low precipitation and potentially drought-favoring conditions. It is interesting to note that the positive anomalies are much stronger than the negative ones during 1859–2018, which indicates that dry spells require a special attention.
The Standardized Precipitation Evapotranspiration Index (SPEI) is designed to consider both precipitation and potential evapotranspiration (PET) in determining drought (Vicente-Serrano et al. Citation2010). It is a drought index defined as the difference between atmospheric supply (precipitation) and demand (potential evapotranspiration) of land surface water. It estimates drought severity by taking not only precipitation but also multi-factors such as temperature, wind speed, and near-surface incoming solar radiation into account (Vicente-Serrano et al. Citation2010). Due to its multi-scalar feature, the index can estimate drought status of each month based on the data preceding the target month over a selected length of period (number of months). Thus, by selecting a corresponding timescale in the calculation, the drought index can estimate drought status related to a particular water resource such as soil moisture, ground water, snowpack, streamflow or reservoir storage (Vicente-Serrano et al. 2012).
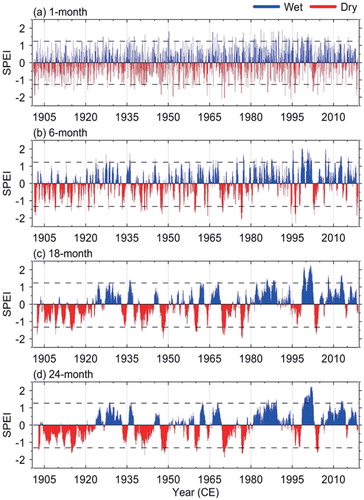
shows the variability of monthly SPEI over Sweden at four particular timescales ranging from 1 to 24 months. The results show an overall wetting trend over Sweden since the start of the 20th century for all the time scales considered, as indicated by more months having SPEI values above zero over the second half of the whole period. The wetting results from a general increase in precipitation as can be seen from SMHIs precipitation observations (not shown). As there are uncertainties related to historical precipitation measurements and as observational systems have been upgraded over the years there is an uncertainty to this wetting trend. However, the wetter conditions in recent decades and also in the 1920s are consistent with findings based on river discharge data (Lindström and Bergström, Citation2004) increasing our confidence in the long-term evolution of the SPEI. Despite the generally wetter conditions in recent decades, the magnitudes of the short-term (up to 6 months) dry conditions in the recent decades have been the highest over the whole period although the frequency of these dry conditions has been relatively low. As 6-month SPEI is expected to be related to ground water resource (McKee et al. Citation1993), the recent rare but extremely dry years caution the risk of possible shortage of groundwater even within wetness-prevailing periods.
Fig. 3. Time series of (a) anomalies of TX90p (number of days when daily maximum temperature (TMax) > 90th percentile) during 1756–2018, (b) anomalies of R × 5day (maximum consecutive 5-day precipitation) and CDD (maximum number of consecutive days with daily precipitation amount < 1mm) during 1859–2018, with reference period 1961–1990, for Stockholm. Thick lines show the 9-years running average of the time series. Daily temperature and precipitation data for Stockholm were provided by Moberg et al. (Citation2002a) (Same as ) and SMHI (downloaded from https://opendata.smhi.se/). Since there was no TMax observation during 1756–1858, the noon (13–14 PM CET) observation of the three times per day observations of temperature was taken as a proxy for Tmax in the calculation of TX90p during 1756–1858. The two curves of TX90p using Tmax and the noon observation during 1859–2018 generally follow each other well, which makes the longer perspective by extending the data back to 1756 meaningful and interesting. Values in the brackets show the climatological means during 1961–1990 for each index..
Precipitation deficit and high evapotranspiration caused by lasting heat waves during the groundwater recharge period has become an issue in Sweden because it can result in falling groundwater levels. This type of drought in Sweden needs to be studied further in the future. Furthermore, the discussion pointed to the need to distinguish between dynamical and thermodynamic effects when studying heat waves and drought. Thermodynamic effects are mainly related to temperature increase and faster depletion of soil moisture (positive warming feedback caused by decrease of evaporative cooling), affecting the threshold of an extreme, while dynamical effects are associated with atmospheric circulation, which affects spell length/persistence and frequency of extremes.
Once a certain meteorological situation is set, temperature extremes such as heat waves can to a large extent be described by thermodynamic reasoning. Thus, future changes in this type of extremes are expected to be closely linked to global warming trends. A recent study evaluated the climate models that were used in the IPCC 4th Assessment Report by comparing their approximately 20-year predictions for global mean temperature with what actually happened (Hausfather et al., Citation2020). The results show that most of the climate models have been quite accurate in their predictions. This is encouraging, especially in light of the continued improvement of global climate models used in the framework of CMIP5 (Reichler and Kim, Citation2008) and CMIP6 (e.g. Gusain et al. Citation2020). As for extra-tropical storminess, summer weather and Arctic Amplification may also contribute to weakening the jetstream, which, in turn, can dynamically induce more persistent blocking patterns and therefore heat waves and droughts (e.g. Zhang et al., Citation2017; Coumou et al., Citation2018).
Droughts are more complex, and require improved understanding of modes of and persistence in atmospheric circulation. So far it is only in southern Europe that clear trends can be detected. There is currently no consensus on the mechanisms causing the sudden increase in major European heat waves in recent decades. One possible mechanism, although its robustness is yet uncertain (Borchert et al., Citation2019), suggested that most major heat waves/droughts during this period appear to be linked with unusually cold North Atlantic sea-surface temperatures (e.g. Duchez et al., Citation2016) possibly due to a slowdown of the Atlantic Meridional Overturning Circulation (e.g. Caesar et al., Citation2018). Paleoclimate studies show evidence for an Atlantic sea-surface temperature control on past heat waves and fire activity in particular for central-northern Europe (e.g. Drobyshev et al., Citation2016; Zhang et al., Citation2017), suggesting a cold-ocean-warm-summer mechanism with more persistent atmospheric-blocking situations consistent with recent observations (Duchez et al., Citation2016), paleoclimate simulations (Schenk et al., Citation2018) and possibly future scenario simulations (e.g. Haarsma et al., Citation2015). These results stand in contrast to modelling studies e.g. from CMIP6 suggesting a 0 to 8% probability for heat waves following cold surface temperatures (Borchert et al., Citation2019) or single-event attributions which show a small or no surface temperature control (Wehrli et al., Citation2019).
Sweden is one of the few countries in the world which have long daily instrumental meteorological records, notably with regard to temperature and precipitation (Chen et al., Citation2015; Moberg et al., Citation2006), as illustrated in and . This provides unique opportunities to study long-term changes of extreme weather events. In addition, Fennoscandia including Sweden has uniquely long, dense and reliable tree-ring paleo records of temperature and hydroclimate over the last 1000 years (e.g. Linderholm et al., Citation2015; Seftigen et al., Citation2017), which provides a natural variability (and solar, ocean, volcanic forcing) context of current changes. There is thus a great potential to combine the proxy data with modeling and reanalysis to gain new insights. Further, Sweden has a long and strong tradition in forestry studies. Some of the records, if digitized, can be useful to climate studies with a focus on extremes (e.g. storminess), and may even shed light on the robustness of the cold sea-surface temperature mechanism in the North Atlantic Ocean in triggering major heat waves, as discussed above.
Fig. 4. Multi-timescale monthly SPEI variability in Sweden over 1901–2018. (a) 1-month SPEI from 1901-01 to 2018–12; (b) 6-month SPEI from 1901–06 to 2018-12; (c) 18-month SPEI from 1902-06 to 2018-12; (d) 24-month SPEI from 1902-12 to 2018-12. Upper and lower horizontal dashed lines in each panel indicate 95th and 5th percentile of SPEI over the whole time period, respectively. The SPEI calculations are based on CRU TS v.4.03 monthly precipitation and potential evapotranspiration 0.5 longitude × 0.5 latitude grid dataset (Harris et al. Citation2014), which is accessible from http://dx.doi.org/10.5285/10d3e3640f004c578403419aac167d82.
3.3. Group three on flooding
The last group was chaired by Erik Kjellström. Currently snowmelt and rain-on-snow events are the most important cause of flooding across Scandinavia and north eastern Europe in spring and winter with rain driven events being the main responsible for flooding during the rest of the year. Snowmelt and rain-on-snow events are also the dominant cause of flooding in 31% of European catchments. Furthermore, soil moisture excess is the dominant mechanism in a plurality of catchments whilst extreme precipitation plays a dominant role in 22% of catchments (Berghujis et al., Citation2019). In western North America significantly increased flood risk in a majority of catchments is projected due to increases in water available for runoff and increased rainfall intensity (Musselman et al., Citation2018).
Many new insights on extremely intensive precipitation have been obtained since the publication of the IPCC AR5 (IPCC, Citation2013), including (1) a larger contribution of changes in heavy precipitation to changes in mean precipitation (Jacob et al., Citation2014), (2) increased precipitation associated with tropical cyclones (IPCC, Citation2012; Kitoh and Endo, Citation2019), (3) convection permitting models indicate stronger changes in (extreme) heavy precipitation events (Kendon et al., Citation2014; Prein et al., Citation2017; Lenderink et al., Citation2019). However, there is still a large uncertainty in observed changes in heavy precipitation events in Europe, especially for such extremes as 50-year return levels (there are contradictory results for Northern Europe, either showing an increase or no trends, see e.g. Belušić et al. (Citation2019) for a review). Thus, it is desirable to continue observations at the limited number of stations with a long history, and to ensure quality of the observations, especially with regard to solid precipitation. Also, high-frequency (e.g. sub-daily) data is crucial here. Most data series with high temporal resolutions do not go back more than 20–30 years. Thus, there are large needs here for monitoring, handling and treating such data.
Maximum consecutive 5-day precipitation (Rx5day) is a frequently used index for extremely heavy precipitation and to some extent also flooding risk. provides an example showing the long-term annual variations of Rx5day for Stockholm. While the interannual variability is large, a long-term wetting trend is also observed. This is in line with the overall wetting in Sweden reflected by SPEI (). In fact, SPEI, especially those for longer time scales (3 month and upwards) are more useful indicators for floods than precipitation-based indexes. As an example, the high SPEI values around 2000 shown in correspond to the historical peak river discharge in Sweden well (Arheimer and Lindström, Citation2015).
For an outlook at the next 2–3 decades, climate projections at regional scale are difficult to interpret due to the large natural variability (Kjellström et al., Citation2013). Also, the insufficient representation of processes relevant for heavy precipitation events in current coarse-scale climate models limits the ability of assessing future changes (e.g. Kendon et al. Citation2014; Belušić et al. Citation2019). Nevertheless, most of the model projections point to an overall wetting effect in Northern Europe and further increase in the contribution of the changes from heavy precipitation events to the changes in mean precipitation (Jacob et al., Citation2014). In addition, there is also a strong theoretical basis pointing to more intense precipitation simply as a result of the fact that warmer air can hold more water vapor.
For future research, the following issues are considered critical: (1) to improve our understanding of the role played by aerosols for heavy precipitation; (2) to consider the effect of the land surface conditions (e.g. soil moisture) on heavy precipitation and its impacts; (3) to determine linkages between heavy precipitation events and variations of the large-scale circulation; (4) to use changes in relevant circulation patterns as precursors for changes in heavy precipitation events; (5) to conduct research on event-based attribution; (6) to understand spatial patterns in extreme events across multiple scales from local to regional; (7) identify the cause and mechanisms behind the abrupt increase in unusually persistent heat waves in Europe in recent decades. Given the seemingly continuous increase and high impact of such extreme events, a new ‘event-based attribution science’ gradually appeared in the 2000s (e.g. Stott et al., Citation2004; Otto, Citation2017). Event-based attribution makes it possible to attribute a specific past extreme event from a probabilistic point of view to forcings such as greenhouse gas emissions and urbanization (e.g. Zhou et al., Citation2020).
Aerosol particles have been found to invigorate deep convective clouds by suppressing precipitation in the initial stages of cloud formation due to a reduction in droplet sizes (Rosenfeld et al., Citation2008). This type of invigoration has been found to result in increased precipitation intensity (Fan et al., Citation2018). High aerosol concentrations could thus lead to more extreme precipitation. However, there are studies that indicate that this type of invigoration does not occur in convective clouds formed in colder climates more relevant for Scandinavian conditions (Li et al., Citation2011, Sporre et al., Citation2014). Aerosol can also affect heavy precipitation through effects on the radiation balance. Both these effects are still associated with large uncertainties and more research is needed to assess how aerosol particles affect heavy precipitation.
In a recent knowledge synthesis produced at SMHI, Belušić et al. (Citation2019) discuss global scale research results on climate extremes interpreted with a focus on Sweden. They review the knowledge situation about climate extremes with respect to occurrence of past and present extremes, possible future changes in response to increasing levels of atmospheric greenhouse gas concentrations and impacts of climate extremes on society as well as collecting gaps in the existing research. They found that in western Europe summertime heat waves have increased and that the number and intensity of cold spells in winter have decreased since 1880, which is also supported by the long instrumental data from Sweden (Chen et al., Citation2015). Apart from this they find that the available information is not sufficient to identify clear trends in recent decades for extremes including precipitation, snow, floods, hailstorms, thunderstorms, tornadoes and ice storms. They further conclude that the very strong natural variability on the scale of years and decades and rather short observational records makes it difficult to identify long term trends in extremes.
In summary, the following points can be highlighted:
In addition to the unique long instrumental meteorological records and high-density reconstructions, Sweden also holds long forestry data which have yet to be digitized and used for climate research.
More research is needed to better understand the roles played by aerosol, atmospheric circulation, and land surface conditions for changes in extreme weather events, to integrate data and modelling, and to conduct event-based attribution studies.
4. Concluding remarks
The workshop provided a useful basis for reviewing the knowledge about past and future changes in extreme weather events with emphasis on the situation in Fennoscandia and neighboring regions. In addition to the three external experts the Swedish participants represented a good portion of the Swedish climate research community. The outcome of the workshop included not only the review as summarized above but it also stimulated the participants to discuss current research activities and to share ideas about possible joint research projects in areas where Swedish scientists have a unique position to contribute.
Cooperation between SMHI and universities in Sweden should be strengthened to take advantage of the modelling efforts and observational data at SMHI. Further, international cooperation through e.g. CORDEX (The Coordinated Regional Downscaling Experiment) under WCRP (World Climate Research Programme) or Baltic Earth concerning historical and future changes in relevant extreme events should also be encouraged. Strengthened link between extreme events and natural hazards and inclusion of social and economic factors are important aspects which contribute to increased societal preparedness for future challenges. This workshop was an excellent example to provide such a platform to promote national and international cooperation. It is desirable that similar workshops are organized on a regular basis in the future.
Acknowledgements
We are grateful to Petter Lind at SMHI for contributing with . Elin Mellqvist and Aifang Chen made an important contribution to the organization of the workshop.
Disclosure statement
No potential conflict of interest was reported by the authors.
Correction Statement
This article has been republished with minor changes. These changes do not impact the academic content of the article.
Additional information
Funding
References
- Arheimer, B. and Lindström, G. 2015. Climate impact on floods: changes in high flows in Sweden in the past and the future (1911–2100). Hydrol. Earth Syst. Sci. 19, 771–784. doi:10.5194/hess-19-771-2015
- BACC Author Team. 2015. Second Assessment of Climate Change for the Baltic Sea Basin. Springer International Publishing, Cham, 501 pp.
- Baldwin, J. W., Dessy, J. B., Vecchi, G. A. and Oppenheimer, M. 2019. Temporally compound heat wave events and global warming: an emerging hazard. Earth's Future 7, 411–427. doi:10.1029/2018EF000989
- Barcikowska, M. J., Weaver, S. J., Feser, F., Russo, S., Schenk, F., and co-authors. 2018. Euro-Atlantic winter storminess and precipitation extremes under 1.5 °C vs. 2 °C warming scenarios. Earth Syst. Dyn. 9, 679–699. doi:10.5194/esd-9-679-2018
- Bärring, L. and Fortuniak, K. 2009. Multi-indices analysis of southern Scandinavian storminess 1780–2005 and links to interdecadal variations in the NW Europe-North Sea region. Int. J. Climatol. 29, 373–384. doi:10.1002/joc.1842
- Belušić, D., Berg, P., Bozhinova, D., Bärring, L., Döscher, R, and co-authors. 2019. Climate extremes for Sweden. State of knowledge and implications for adaptation and mitigation. SMHI SE-60176 Norrköping, 75 pp. Available at: http://urn.kb.se/resolve?urn=urn:nbn:se:smhi:diva-5461
- Belušić, D., de Vries, H., Dobler, A., Landgren, O., Lind, P., and co-authors. 2020. HCLIM38: A flexible regional climate model applicable for different climate zones from coarse to convection permitting scales. Geoscient. Model Dev. 13, 1311–1333. doi:10.5194/gmd-13-1311-2020
- Berg, P., Norin, L. and Olsson, J. 2016. Creation of a high resolution precipitation data set by merging gridded gauge data and radar observations for Sweden. J. Hydrol. 541, 6–13. doi:10.1016/j.jhydrol.2015.11.031
- Berghuijs, W. R., Harrigan, S., Molnar, P., Slater, L. J. and Kirchner, J. W. 2019. The relative importance of different flood-generating mechanisms across Europe. Water Resour. Res. 55, 4582–4593.
- Borchert, L. F., Pohlmann, H., Baehr, J., Neddermann, N. C., Suarez-Gutierrez, L. and co-authors. 2019. Decadal predictions of the probability of occurrence for warm summer temperature extremes. Geophys. Res. Lett. 46, 14042–14051. doi:10.1029/2019GL085385
- Caesar, L., Rahmstorf, S., Robinson, A., Feulner, G. and Saba, V. 2018. Observed fingerprint of a weakening Atlantic Ocean overturning circulation. Nature 556, 191–196. doi:10.1038/s41586-018-0006-5
- Chen, D., Walther, A., Moberg, A., Jones, P. D., Jacobeit, J. and co-authors. 2015. European Trend Atlas of Extreme Temperature and Precipitation. Springer, Dordrecht, pp 178.
- Coles, S. 2001. An Introduction to Statistical Modeling of Extreme Values. Springer-Verlag, London, pp 208.
- Coumou, D., Di Capua, G., Vavrus, S., Wang, L. and Wang, S. 2018. The influence of Arctic amplification on mid-latitude summer circulation. Nat. Commun. 9, 2959. doi:10.1038/s41467-018-05256-8
- Davini, P. and Cagnazzo, C. 2014. On the misinterpretation of the North Atlantic Oscillation in CMIP5 models. Clim. Dyn. 43, 1497–1511. doi:10.1007/s00382-013-1970-y
- Deng, K., Ting, M., Yang, S. and Tan, Y. 2018a. Increased frequency of summer extreme heat waves over Texas area tied to the amplification of Pacific zonal SST gradient. J. Clim. 31, 5629–5647. doi:10.1175/JCLI-D-17-0554.1
- Deng, K., Yang, S., Ting, M., Lin, A. and Wang, Z. 2018b. An intensified mode of variability modulating the summer heat waves in eastern Europe and northern China. Geophys. Res. Lett. 45, 11361–11369.
- Deng, K., Yang, S., Ting, M., Zhao, P. and Wang, Z. 2019. Dominant modes of China summer heat waves driven by global sea surface temperature and atmospheric internal variability. J. Clim. 32, 3761–3775. doi:10.1175/JCLI-D-18-0256.1
- Döscher, R., Willén, U., Jones, C., Rutgersson, A., Meier, H. E. M, and co-authors. 2002. The development of the regional coupled ocean-atmosphere model RCAO. Boreal Env. Res. 7, 183–192.
- Drijfhout, S., Bathiany, S., Beaulieu, C., Brovkin, V., Claussen, M, and co-authors. 2015. Catalogue of abrupt shifts in Intergovernmental Panel on Climate Change climate models. Proc. Natl. Acad. Sci. USA 112, 5777–5786.
- Drobyshev, I., Bergeron, Y., de Vernal, A., Moberg, A., Ali, A. and co-authors. 2016. Atlantic SSTs control regime shifts in forest fire activity of Northern Scandinavia. Sci. Rep. 6, 1–13.
- Duchez, A., Frajka-Williams, E., Josey, S. A., Evans, D. G., Grist, J. P., and co-authors. 2016. Drivers of exceptionally cold North Atlantic Ocean temperatures and their link to the 2015 European heat wave. Environ. Res. Lett. 11, 074004. doi:10.1088/1748-9326/11/7/074004
- Emanuel, K. A. 1987. The dependence of hurricane intensity on climate. Nature 326, 483–485. doi:10.1038/326483a0
- Fan, J., Rosenfeld, D., Zhang, Y., Giangrande, S. E., Li, Z., and co-authors. 2018. Substantial convection and precipitation enhancements by ultrafine aerosol particles. Science 359, 411–418. doi:10.1126/science.aan8461
- Feser, F., Barcikowska, M., Krueger, O., Schenk, F., Weisse, R. and co-authors. 2015. Storminess over the North Atlantic and northwestern Europe – A review. Q. J. R. Meteorol. Soc. 141, 350–382. doi:10.1002/qj.2364
- Gusain, A., Ghosh, S. and Karmakar, S. 2020. Added value of CMIP6 over CMIP5 models in simulating Indian summer monsoon rainfall. Atmos. Res. 232, 104680. doi:10.1016/j.atmosres.2019.104680
- Haarsma, R. J., Selten, F. M. and Sybren, S. D. 2015. Decelerating Atlantic meridional overturning circulation main cause of future west European summer atmospheric circulation changes. Environ. Res. Lett. 10, 094007. doi:10.1088/1748-9326/10/9/094007
- Harris, I., Jones, P. D., Osborn, T. J. and Lister, D. H. 2014. Updated high‐resolution grids of monthly climatic observations–the CRU TS3. 10 Dataset. Int. J. Climatol. 34, 623–642. doi:10.1002/joc.3711
- Hausfather, Z., Drake, H. F., Abbott, T. and Schmidt, G. A. 2020. Evaluating the performance of past climate model projections. Geophys. Res. Lett. 47, e2019GL085378. doi:10.1029/2019GL085378
- Hoffmann, L., Günther, G., Li, D., Stein, O., Wu, X., and co-authors. 2019. From ERA-Interim to ERA5: the considerable impact of ECMWF's next-generation reanalysis on Lagrangian transport simulations. Atmos. Chem. Phys. 19, 3097–3124. doi:10.5194/acp-19-3097-2019
- IPCC. 2012. Managing the risks of extreme events and disasters to advance climate change adaptation. In: A Special Report of Working Groups I and II of the Intergovernmental Panel on Climate Change (ed. C. B. Field). Cambridge University Press, Cambridge, pp 582.
- IPCC. 2013. Climate change 2013: the physical science basis. In: Contribution of Working Group I to the Fifth Assessment Report of the Intergovernmental Panel on Climate Change (eds. Stocker, T. F., Qin, D., Plattner, G.-K., Tignor, M., Allen, S. K., Boschung, J., Nauels, A., Xia, Y., Bex, V., and Midgley, P. M.). Cambridge University Press, Cambridge, 1535 pp.
- IPCC. 2018. Summary for policymakers. In: Global Warming of 1.5 °C. An IPCC Special Report on the Impacts of Global Warming of 1.5 °C above Pre-Industrial Levels and Related Global Greenhouse Gas Emission Pathways, in the Context of Strengthening the Global Response to the Threat of Climate Change, Sustainable Development, and Efforts to Eradicate Poverty (eds. Masson-Delmotte, V., Zhai, P. M., Pörtner, H. O., Roberts, D., Skea, J., Shukla, P. R., Pirani, A., Moufouma-Okia, W., Péan, C., Pidcock, R., Connors, S., Matthews, J. B. R., Chen, Y., Zhou, X., Gomis, M. I., Lonnoy, E., Maycock, T., Tignor, M., and Waterfield, T.). World Meteorological Organization, Geneva, Switzerland, pp 32.
- Jacob, D., Petersen, J., Eggert, B., Alias, A., Christensen, O. B., and co-authors. 2014. EURO-CORDEX: new high-resolution climate change projections for European impact research. Reg. Environ. Change 14, 563–578. doi:10.1007/s10113-013-0499-2
- Jeworrek, J., Wu, L., Dieterich, C. and Rutgersson, A. 2017. Characteristics of convective snow bands along the Swedish east coast. Earth Syst. Dyn. 8, 163–175. doi:10.5194/esd-8-163-2017
- Kendon, E. J., Roberts, N. M., Fowler, H. J., Roberts, M. J., Chan, S. C. and co-authors. 2014. Heavier summer downpours with climate change revealed by weather forecast resolution model. Nat. Clim. Change 4, 570–576. doi:10.1038/nclimate2258
- Kitoh, A. and Endo, H. 2019. Future changes in precipitation extremes associated with tropical cyclones projected by large-ensemble simulations. J. Meteorol. Soc. Jpn. 97, 141–152. doi:10.2151/jmsj.2019-007
- Kjellström, E., Thejll, P., Rummukainen, M., Christensen, J. H., Boberg, F., and co-authors. 2013. Emerging regional climate change signals for Europe under varying large-scale circulation conditions. Clim. Res. 56, 103–119. doi:10.3354/cr01146
- Knutson, T., Camargo, S. J., Chan, J. C. L., Emanuel, K., Ho, C.-H., and co-authors. 2019. Tropical cyclones and climate change assessment: Part I. Detection and attribution. Bull. Amer. Meteor. Soc 100, 1987–2007. doi:10.1175/BAMS-D-18-0189.1
- Knutson, T., Camargo, S. J., Chan, J. C. L., Emanue, K., Ho, C.-H, and co-authors. 2020. Tropical cyclones and climate change assessment: Part II. Projected response to anthropogenic warming. Bull. Amer. Meteor. Soc. 101, E303–E322. doi:10.1175/BAMS-D-18-0189.1
- Kylander, M. E., Söderlindh, J., Schenk, F., Gyllencreutz, R., Rydberg, J., and co-authors. 2020. It's in your glass: a history of sea level and storminess from the Laphroaig bog, Islay (southwestern Scotland). Boreas 49, 152–167. doi:10.1111/bor.12409
- Lavender, S. L., Walsh, K. J. E., Caron, L.-P., King, M., Monkiewicz, S., and co-authors. 2018. Estimation of the maximum annual number of North Atlantic tropical cyclones using climate models. Sci. Adv. 4, eaat6509. doi:10.1126/sciadv.aat6509
- Lenderink, G., Belušić, D., Fowler, H. J., Kjellström, E., Lind, P., and co-authors. 2019. Systematic increases in the thermodynamic response of hourly precipitation extremes in an idealized warming experiment with a convection-permitting climate model. Environ. Res. Lett. 14, 074012. doi:10.1088/1748-9326/ab214a
- Li, Z., Niu, F., Fan, J., Liu, Y., Rosenfeld, D. and co-authors. 2011. Long-term impacts of aerosols on the vertical development of clouds and precipitation. Nat. Geosci. 4, 888–894. doi:10.1038/ngeo1313
- Linderholm, H. W., Björklund, J. A., Seftigen, K., Gunnarson, B. E. and Fuentes, M. 2015. Fennoscandia revisited: a spatially improved tree-ring reconstruction of summer temperatures for the last 900 years. Clim. Dyn. 45, 933–947. doi:10.1007/s00382-014-2328-9
- Lindström, G. and Bergström, S. 2004. Runoff trends in Sweden 1807–2002. Hydrol. Sci. J. 49, 69–83. doi:10.1623/hysj.49.1.69.54000
- Liu, X., He, B., Guo, L., Huang, L. and Chen, D. 2020. Similarities and differences in the mechanisms causing the European summer heatwaves in 2003, 2010, and 2018. Earth’s Future 8, e2019EF001386. doi:10.1029/2019EF001386
- May, W. 2004. Variability and extremes of daily rainfall during the Indian summer monsoon in the period 1901-1989. Glob. Planet. Change 44, 83–105. doi:10.1016/j.gloplacha.2004.06.007
- May, W. 2008. Potential future changes in the characteristics of daily precipitation in Europe simulated by the HIRHAM regional climate model. Clim. Dyn. 30, 581–603. doi:10.1007/s00382-007-0309-y
- McKee, T. B., Doesken, N. J. and Kleist, J. 1993. The relationship of drought frequency and duration to time scales. Proc.8th Conf. Appl. Climatol. 17, 179–183.
- Miralles, M., van den Berg, J., Teuling, A. J. and de Jeu, R. A. M. 2012. Soil moisture temperature coupling: a multiscale observational analysis. Geophys. Res. Lett. 39, L21707. doi:10.1029/2012GL053703
- Moberg, A., Bergström, H., Ruiz Krigsman, J. and Svanered, O. 2002a. Daily air temperature and pressure series for Stockholm (1756–1998). Clim. Change 53, 171–212. doi:10.1023/A:1014966724670
- Moberg, A., Bergström, H., Ruiz Krigsman, J. and Svanered, O. 2002b. Erratum. Clim. Change 53, 171–250. doi:10.1023/A:1014966724670
- Moberg, A., Jones, P. D., Lister, D., Walther, A., Brunet, M., and co-authors. 2006. Indices for daily temperature and precipitation extremes in Europe analysed for the period 1901-2000. J. Geophys. Res 111, D22106. doi:10.1029/2006JD007103
- Musselman, K. N., Lehner, F., Ikeda, K., Clark, M. P., Prein, A. F., and co-authors. 2018. Projected increases and shifts in rain-on-snow flood risk over western North America. Nat. Clim. Change 8, 808–812. doi:10.1038/s41558-018-0236-4
- Otto, F. E. L. 2017. Attribution of weather and climate events. Annu. Rev. Environ. Resour. 42, 627–646. doi:10.1146/annurev-environ-102016-060847
- Perera, A. T. D., Nik, V. M., Chen, D., Scartezzini, J. L. and Hong, T. 2020. Quantifying the impacts of climate change and extreme climate events on energy systems. Nat. Energy 5, 150–159. doi:10.1038/s41560-020-0558-0
- Prein, A. F., Liu, C., Ikeda, K., Trier, S. B., Rasmussen, R. M., and co-authors. 2017. Increased rainfall volume from future convective storms in the US. Nat. Clim. Change 7, 880–884. doi:10.1038/s41558-017-0007-7
- Rechid, D., Meier, H. E., Schrum, C., Rummukainen, M., Moseley, C. G. and co-authors. 2016. Climate model simulation for the North Sea Region. In: North Sea Regional Climate Change Assessment (eds. M. Quante and F. Colijn). Springer International Publishing, Cham. 495 pp. doi:10.1007/978-3-319-39745-0
- Reichler, T. and Kim, J. 2008. How well do coupled models simulate today's climate? Bull. Amer. Meteor. Soc. 89, 303–312. doi:10.1175/BAMS-89-3-303
- Romero, R. and Emanuel, K. 2017. Climate change and hurricane-like extratropical cyclones: projections for north Atlantic polar lows and Medicanes based on CMIP5 models. J. Clim. 30, 279–299. doi:10.1175/JCLI-D-16-0255.1
- Rosenfeld, D., Lohmann, U., Raga, G. B., O'Dowd, C. D., Kulmala, M., and co-authors. 2008. Flood or drought: how do aerosols affect precipitation? Science 321, 1309–1313. doi:10.1126/science.1160606
- Rutgersson, A., Jaagus, J., Schenk, F. and Stendel, M. 2014. Observed changes and variability of atmospheric parameters in the Baltic Sea region during the last 200 years. Clim. Res. 61, 177–190. doi:10.3354/cr01244
- Schenk, F., Väliranta, M., Muschitiello, F., Tarasov, L., Heikkilä, M., and co-authors. 2018. Warm summers during the Younger Dryas cold reversal. Nat. Commun. 9, 1634. doi:10.1038/s41467-018-04071-5
- Seftigen, S., Goosse, H., Klein, F. and Chen, D. 2017. Hydroclimate variability in Scandinavia over the last millennium – insights from a climate model-proxy data comparison. Clim. Past 13, 1831–1850. doi:10.5194/cp-13-1831-2017
- Seneviratne, S. I., Corti, T., Davin, E. L., Hirschi, M., Jaeger, E. B. and co-authors. 2010. Investigating soil moisture climate interactions in a changing climate: a review. Earth Sci. Rev. 99, 125–161. doi:10.1016/j.earscirev.2010.02.004
- Seneviratne, S. I., Donat, M., Mueller, B. and Alexander, L. V. 2014. No pause in the increase of hot temperature extremes. Nat. Clim. Change 4, 161–163. doi:10.1038/nclimate2145
- Seneviratne, S. I., Donat, M. G., Pitman, A. J., Knutti, R., Wilby, R. L, and co-authors. 2016. Allowable CO2 emissions based on regional and impact-related climate targets. Nature 529, 477–483. doi:10.1038/nature16542
- Sippel, S., Meinshausen, N., Fischer, E. M., Székely, E., Knutti, R, and co-authors. 2020. Climate change now detectable from any single day of weather at global scale. Nat. Clim. Change. 10, 35–41. doi:10.1038/s41558-019-0666-7
- Smith, B., Samuelsson, P., Wramneby, A. and Rummukainen, M. 2011. A model of the coupled dynamics of climate, vegetation and terrestrial ecosystem biogeochemistry for regional applications. Tellusa. 63, 87–106. doi:10.1111/j.1600-0870.2010.00477.x
- Sporre, M. K., Swietlicki, E., Glantz, P. and Kulmala, M. 2014. A long-term satellite study of aerosol effects on convective clouds in Nordic background air. Atmos. Chem. Phys. 14, 2203–2217. doi:10.5194/acp-14-2203-2014
- Stoll, P. J., Graversen, R. G., Noer, G. and Hodges, K. 2018. An objective global climatology of polar lows based on reanalysis data. Q J. R Meteorol. Soc. 144, 2099–2117. doi:10.1002/qj.3309
- Stott, P. A., Stone, D. A. and Allen, M. R. 2004. Human contribution to the European heatwave of 2003. Nature 432, 610–614. doi:10.1038/nature03089
- Ulbrich, U., Leckebusch, G. C. and Pinto, J. G. 2009. Extra-tropical cyclones in the present and future climate: a review. Theor. Appl. Climatol. 96, 117–131. doi:10.1007/s00704-008-0083-8
- Vicente-Serrano, S. M., Beguería, S. and López-Moreno, J. I. 2010. A multiscalar drought index sensitive to global warming: the standardized precipitation evapotranspiration index. J. Clim. 23, 1696–1718. doi:10.1175/2009JCLI2909.1
- Vicente-Serrano, S. M., Beguería, S., Lorenzo-Lacruz, J., Camarero, J. J., López-Moreno, J. I., and co-authors. 2012. Performance of drought indices for ecological, agricultural, and hydrological applications. Earth Interact. 16, 1–27. doi:10.1175/2012EI000434.1
- Vogel, M. M., Zscheischler, J., Wartenburger, R., Dee, D. and Seneviratne, S. I. 2019. Concurrent 2018 hot extremes across northern hemisphere due to human-induced climate change. Earths Future. 7, 692–703.
- Wartenburger, R., Hirschi, M., Donat, M. G., Greve, P., Pitman, A. J. and co-authors. 2017. Changes in regional climate extremes as a function of global mean temperature: an interactive plotting framework. Geosci. Model Dev. 10, 3609–3634. doi:10.5194/gmd-10-3609-2017
- Wehrli, K., Guillod, B. P., Hauser, M., Leclair, M. and Seneviratne, S. I. 2019. Identifying key driving processes of major recent heat waves. J. Geophys. Res. Atmos. 124, 11746–11765. doi:10.1029/2019JD030635
- Wu, L., Breivik, O. and Rutgersson, A. 2019. Ocean-wave-atmosphere interaction processes in a fully coupled modeling system. J. Adv. Model. Earth Syst. 11, 3852–3874. doi:10.1029/2019MS001761
- Wu, L., Sproson, D., Sahlée, E. and Rutgersson, A. 2017. Surface wave impact when simulating midlatitude storm development. J. Atmos. Oceanic Technol. 34, 233–248. doi:10.1175/JTECH-D-16-0070.1
- Zahn, M. and von Storch, H. 2010. Decreased frequency of North Atlantic polar lows associated with future climate warming. Nature 467, 309–312. doi:10.1038/nature09388
- Zhan, R. F. and Wang, Y. Q. 2017. Weak tropical cyclones dominate the poleward migration of the annual mean location of lifetime maximum intensity of northwest Pacific tropical cyclones since 1980. J. Clim. 30, 6873–6882. doi:10.1175/JCLI-D-17-0019.1
- Zhang, P., Ionita, M., Lohmann, G., Chen, D. and Linderholm, H. W. 2017. Can tree-ring density data reflect summer temperature extremes and associated circulation patterns over Fennoscandia? Clim. Dyn. 49, 2721–2736. doi:10.1007/s00382-016-3452-5
- Zhang, Z., Wang, K., Chen, D., Li, J. and Dickinson, R. 2019. Increase in surface friction dominates the observed surface wind speed decline during 1973–2014 in the Northern Hemisphere lands. J. Clim. 32, 7421–7435. doi:10.1175/JCLI-D-18-0691.1
- Zhou, C., Chen, D., Wang, K., Dai, A. and Qi, D. 2020. Conditional attribution of the 2018 summer extreme heat over Northeast China: roles of urbanization, global warming and warming-induced circulation changes. Bull. Amer. Meteorol. Soc. 101, S1–S128. doi:10.1175/BAMS-ExplainingExtremeEvents2018.1.
- Zscheischler, J., Westra, S., van den Hurk, B. J. J. M., Seneviratne, S. I., Ward, P. J., and co-authors. 2018. Future climate risk from compound events. Nat. Clim. Change 8, 469–477.